The Clinical Approach to Anemia
From pathophysiology to diagnosis — a three-part guide.
Approach & Classification
The Clinical Approach to the Patient with Anemia
From Pathophysiology to Diagnosis: A Comprehensive Guide
Based on the work of Husain Alkhaldy, M.D.
PATHOPHYSIOLOGY OF BLOOD DISORDERS | CLINICAL HEMATOLOGY SERIES
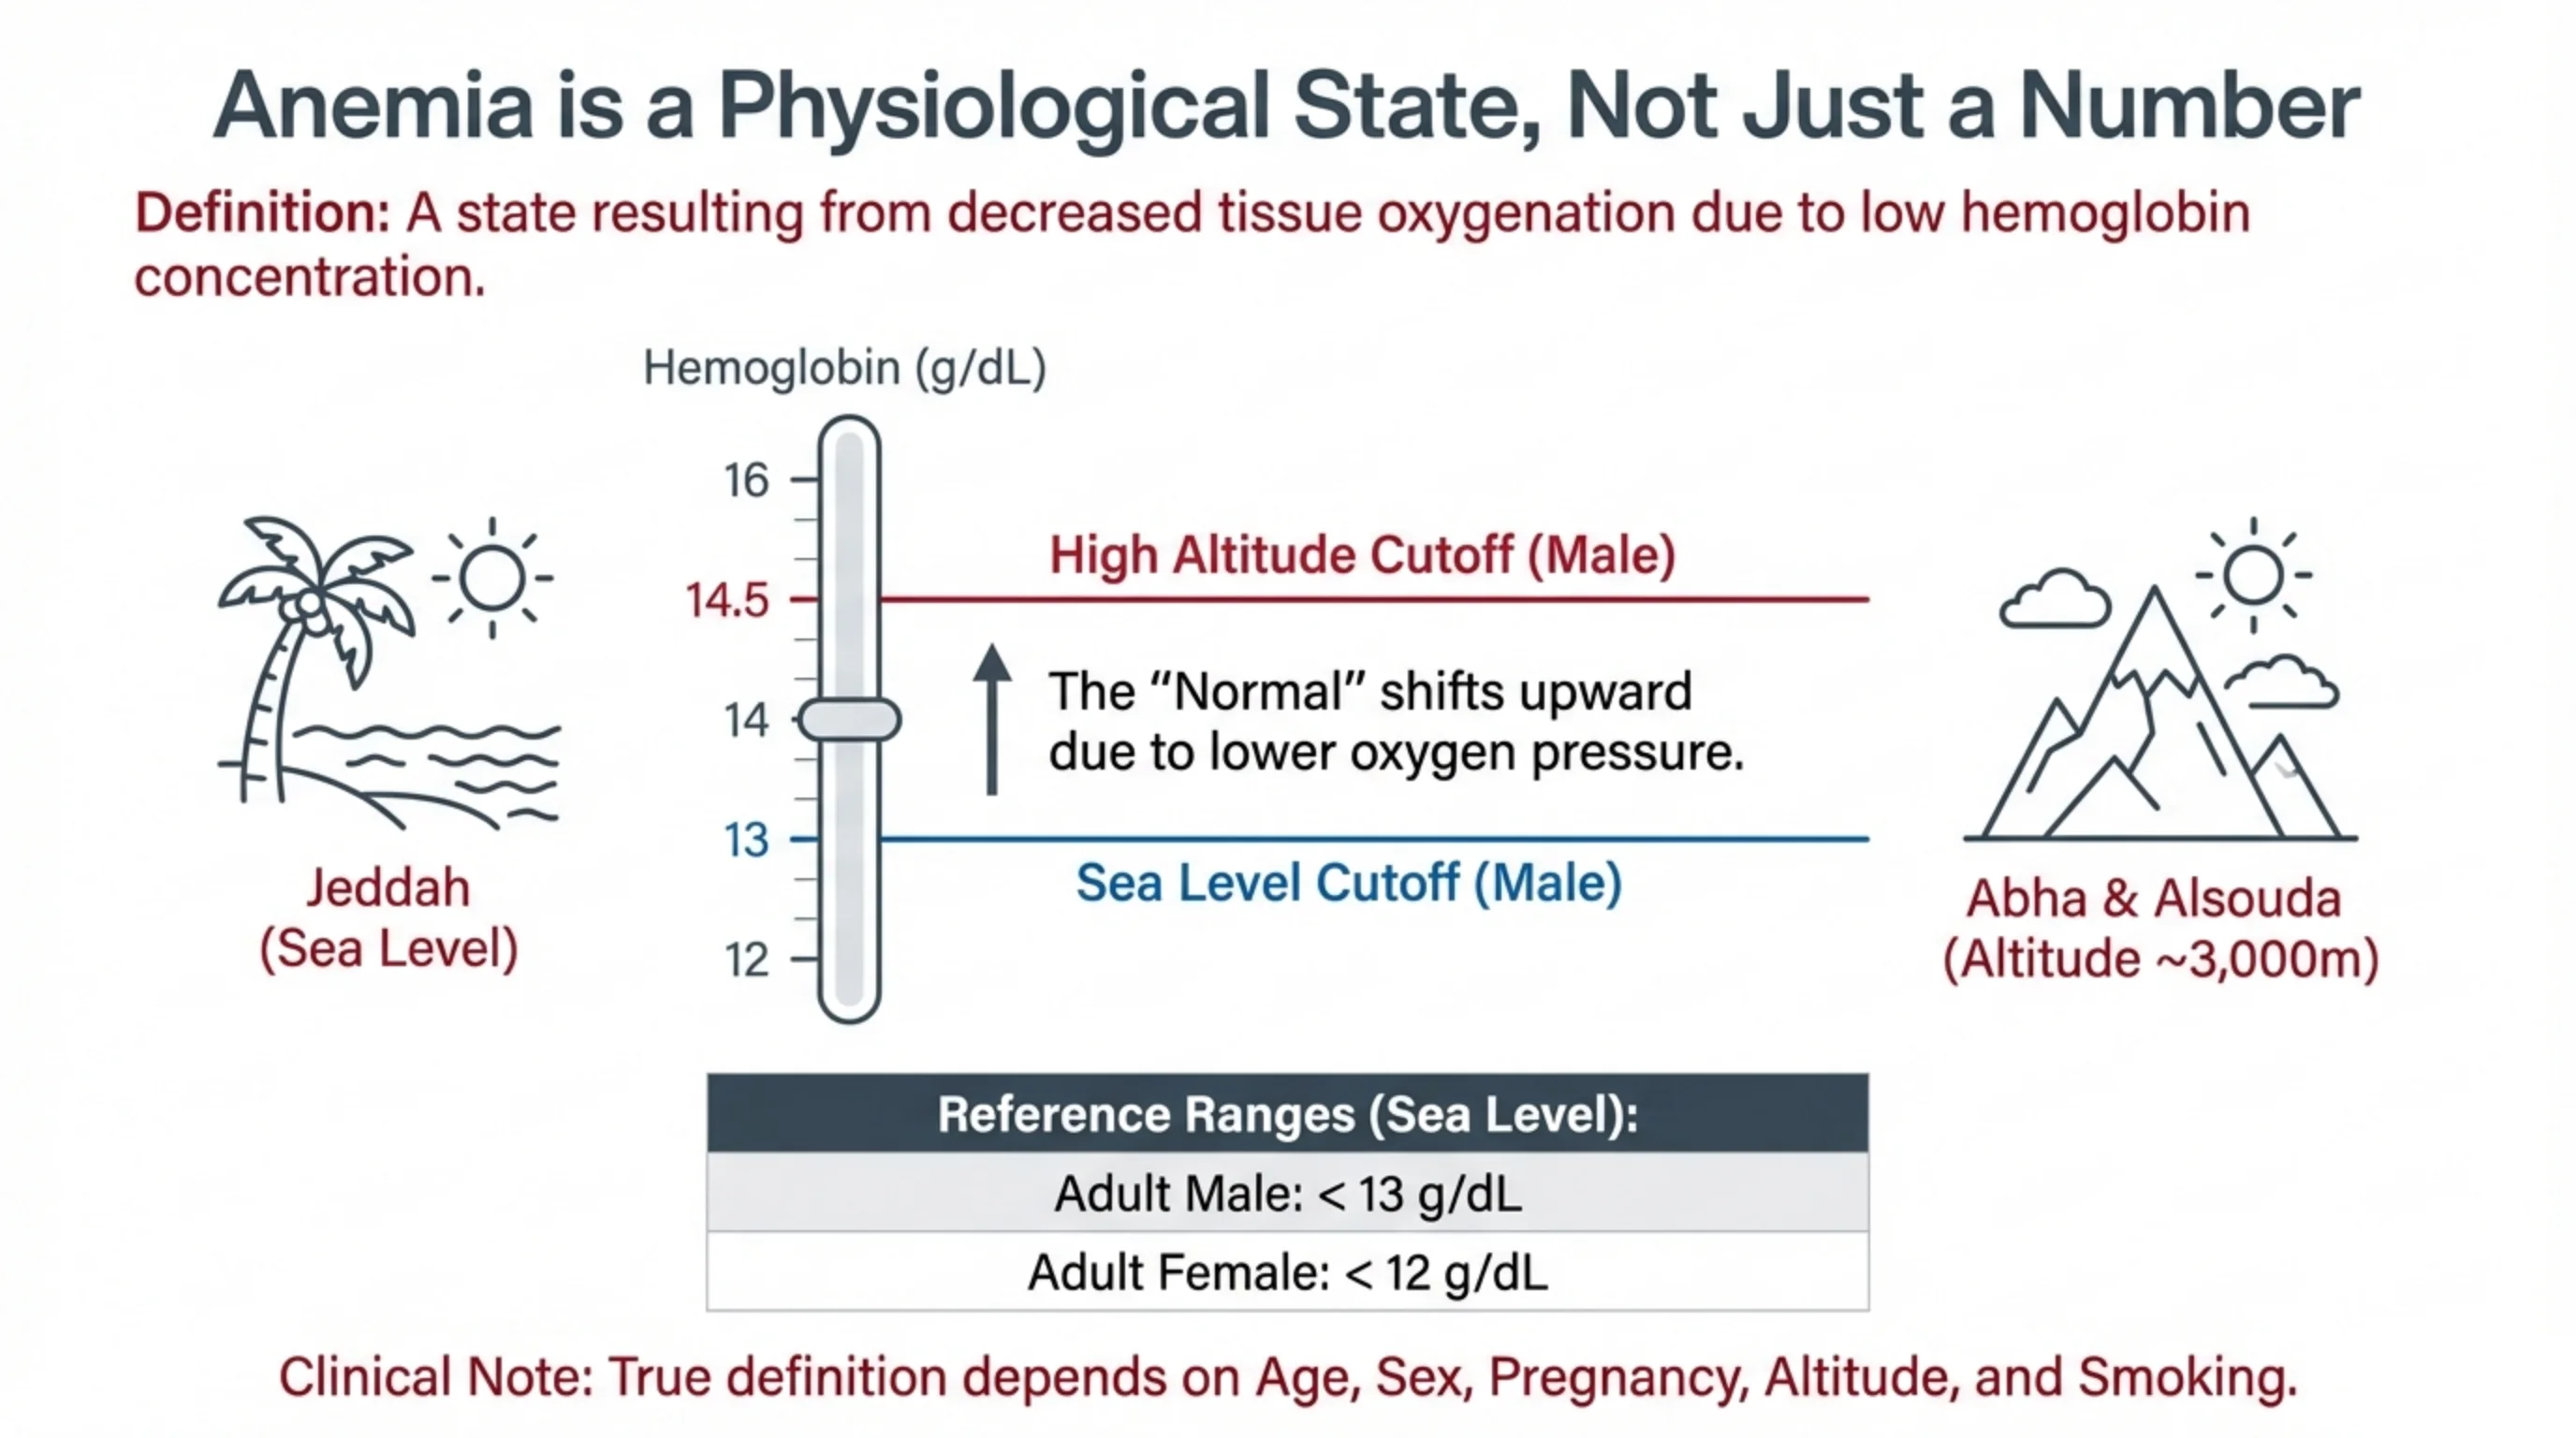
Definition: A state resulting from decreased tissue oxygenation due to low hemoglobin concentration.
Hemoglobin (g/dL) scale
- High Altitude Cutoff (Male): 14.5 g/dL
- Sea Level Cutoff (Male): 13 g/dL
- Jeddah (Sea Level) vs. Abha & Alsouda (Altitude ~3,000 m)
- The “Normal” shifts upward due to lower oxygen pressure.
| Reference Ranges (Sea Level) | |
|---|---|
| Adult Male | < 13 g/dL |
| Adult Female | < 12 g/dL |
Clinical Note: True definition depends on Age, Sex, Pregnancy, Altitude, and Smoking.
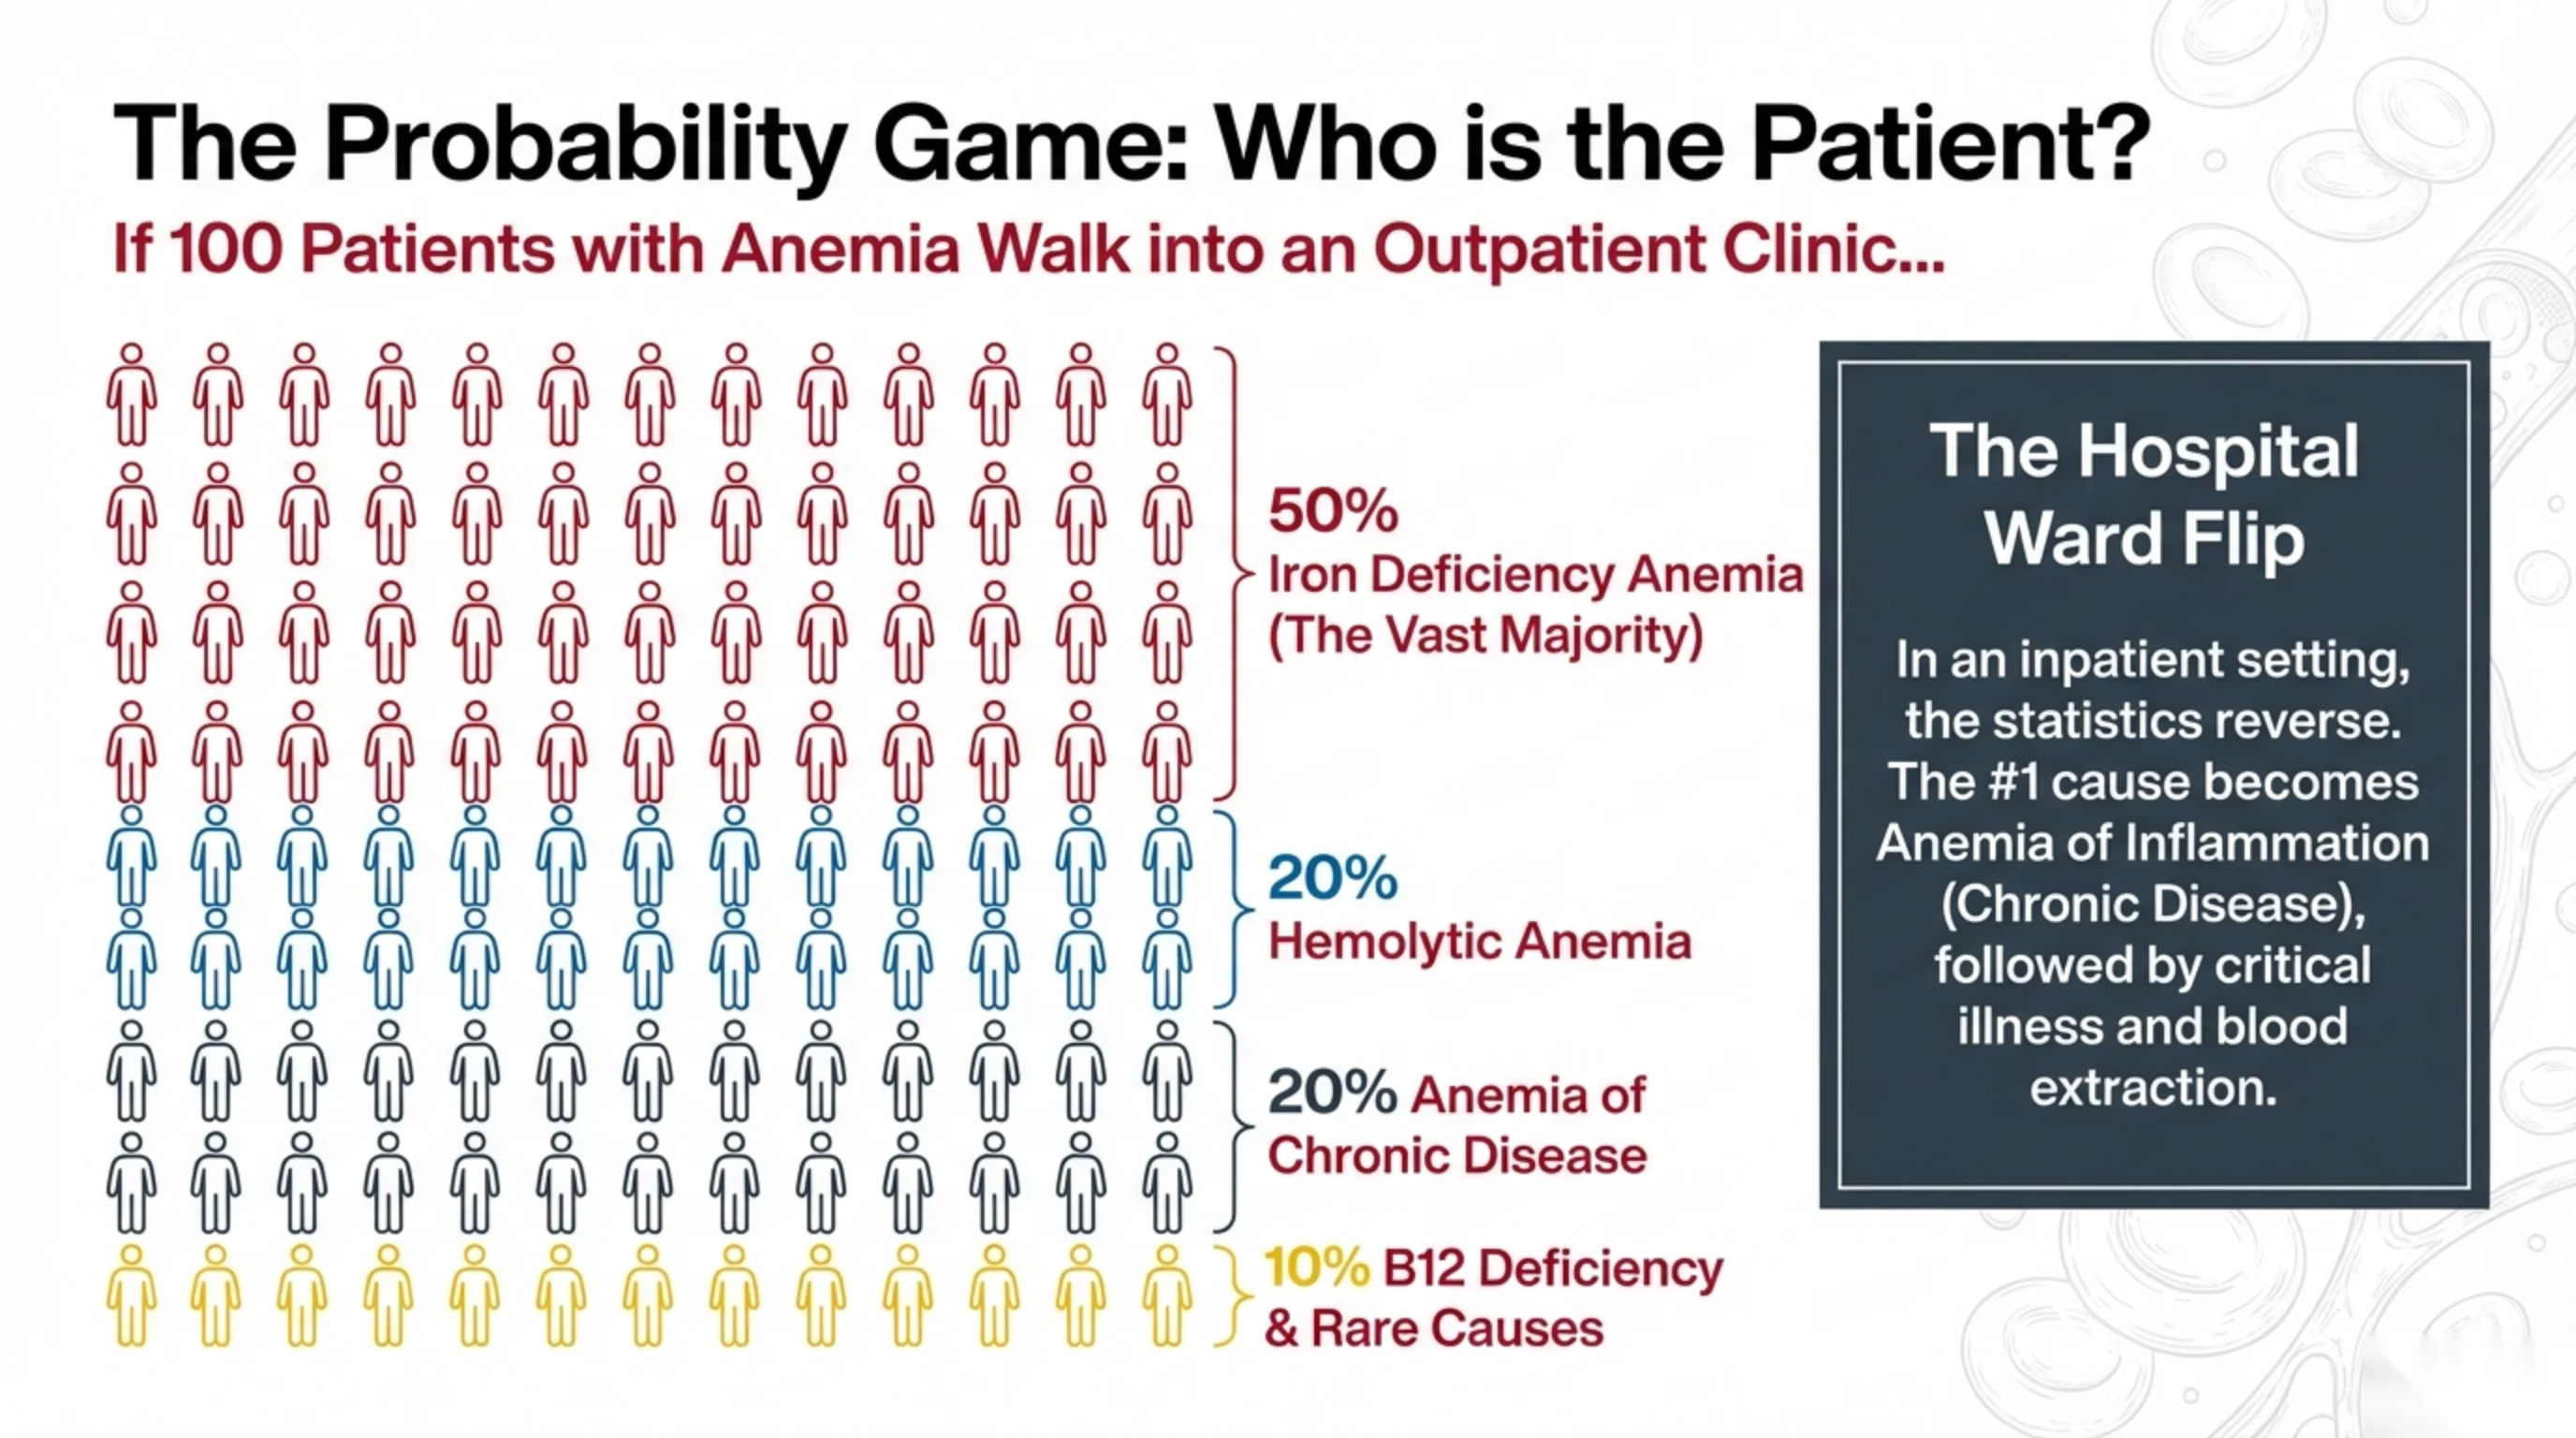
If 100 Patients with Anemia Walk into an Outpatient Clinic...
- 50% Iron Deficiency Anemia (The Vast Majority)
- 20% Hemolytic Anemia
- 20% Anemia of Chronic Disease
- 10% B12 Deficiency & Rare Causes
The Hospital Ward Flip
In an inpatient setting, the statistics reverse. The #1 cause becomes Anemia of Inflammation (Chronic Disease), followed by critical illness and blood extraction.
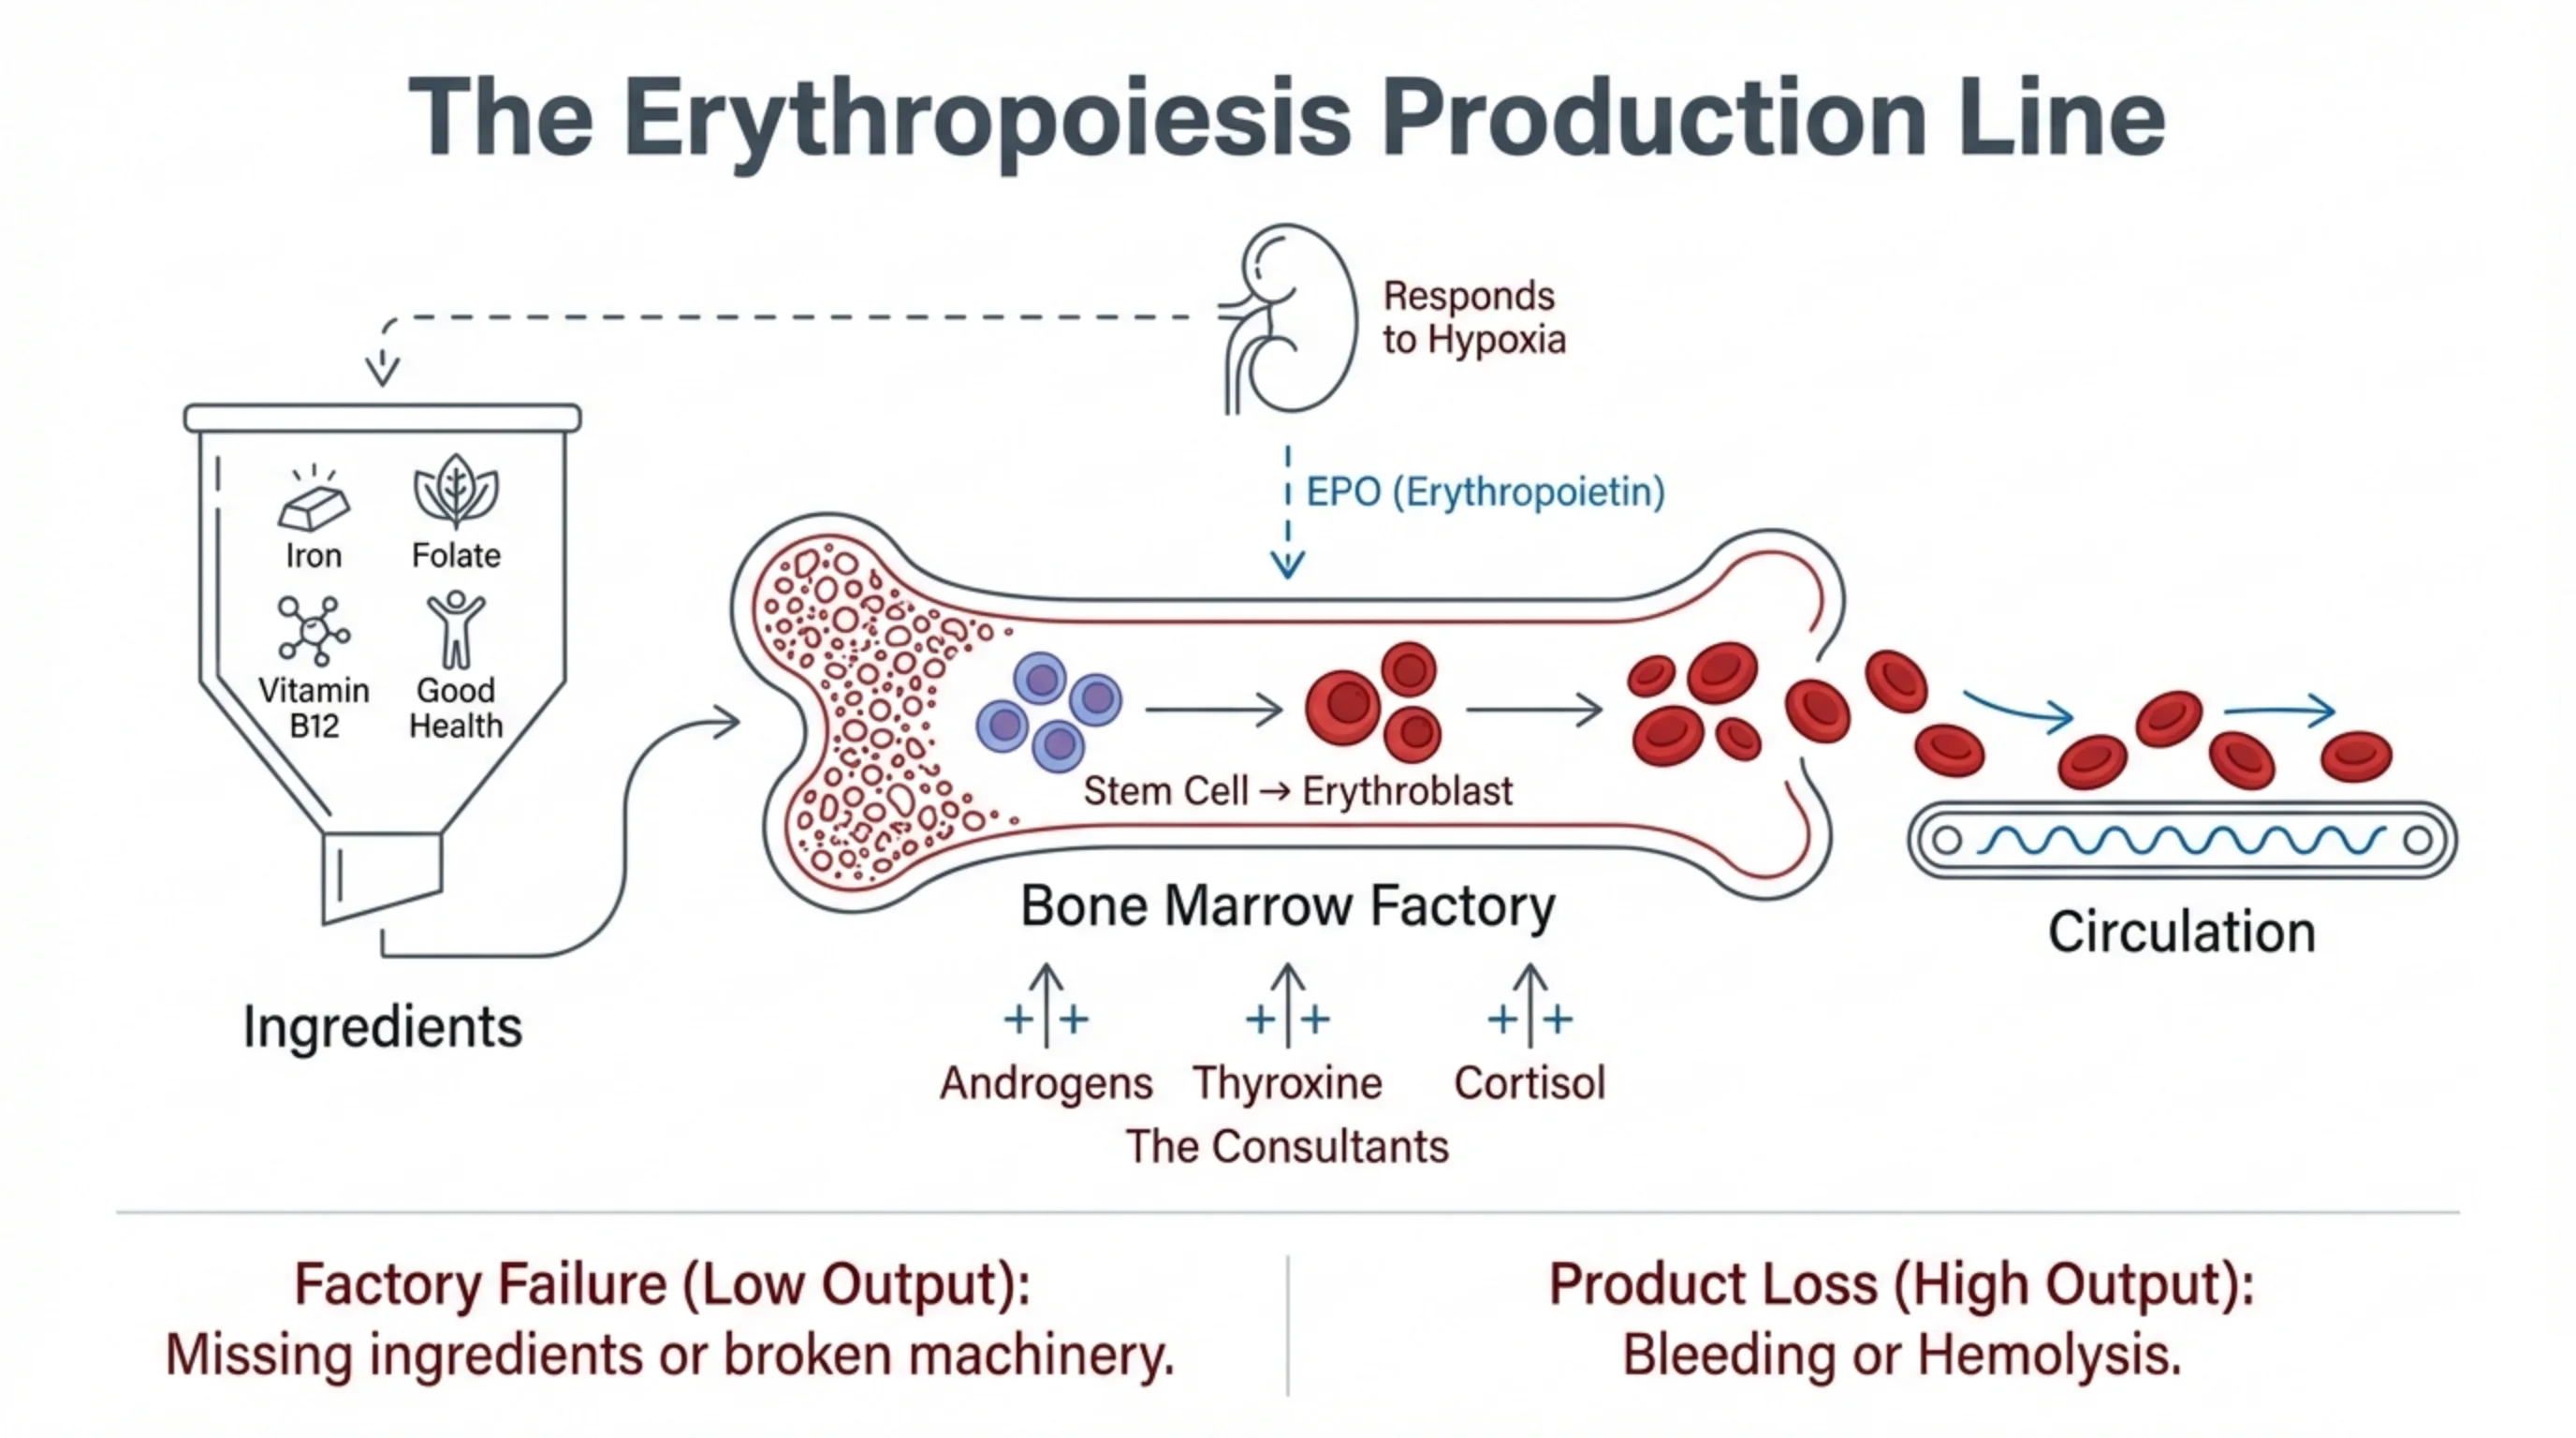
Ingredients (funnel into the factory):
- Iron
- Folate
- Vitamin B12
- Good Health
Kidney: Responds to Hypoxia → releases EPO (Erythropoietin) to the bone marrow.
Bone Marrow Factory: Stem Cell → Erythroblast → red cells → Circulation.
The Consultants (hormones that stimulate erythropoiesis):
- Androgens
- Thyroxine
- Cortisol
Factory Failure (Low Output): Missing ingredients or broken machinery.
Product Loss (High Output): Bleeding or Hemolysis.
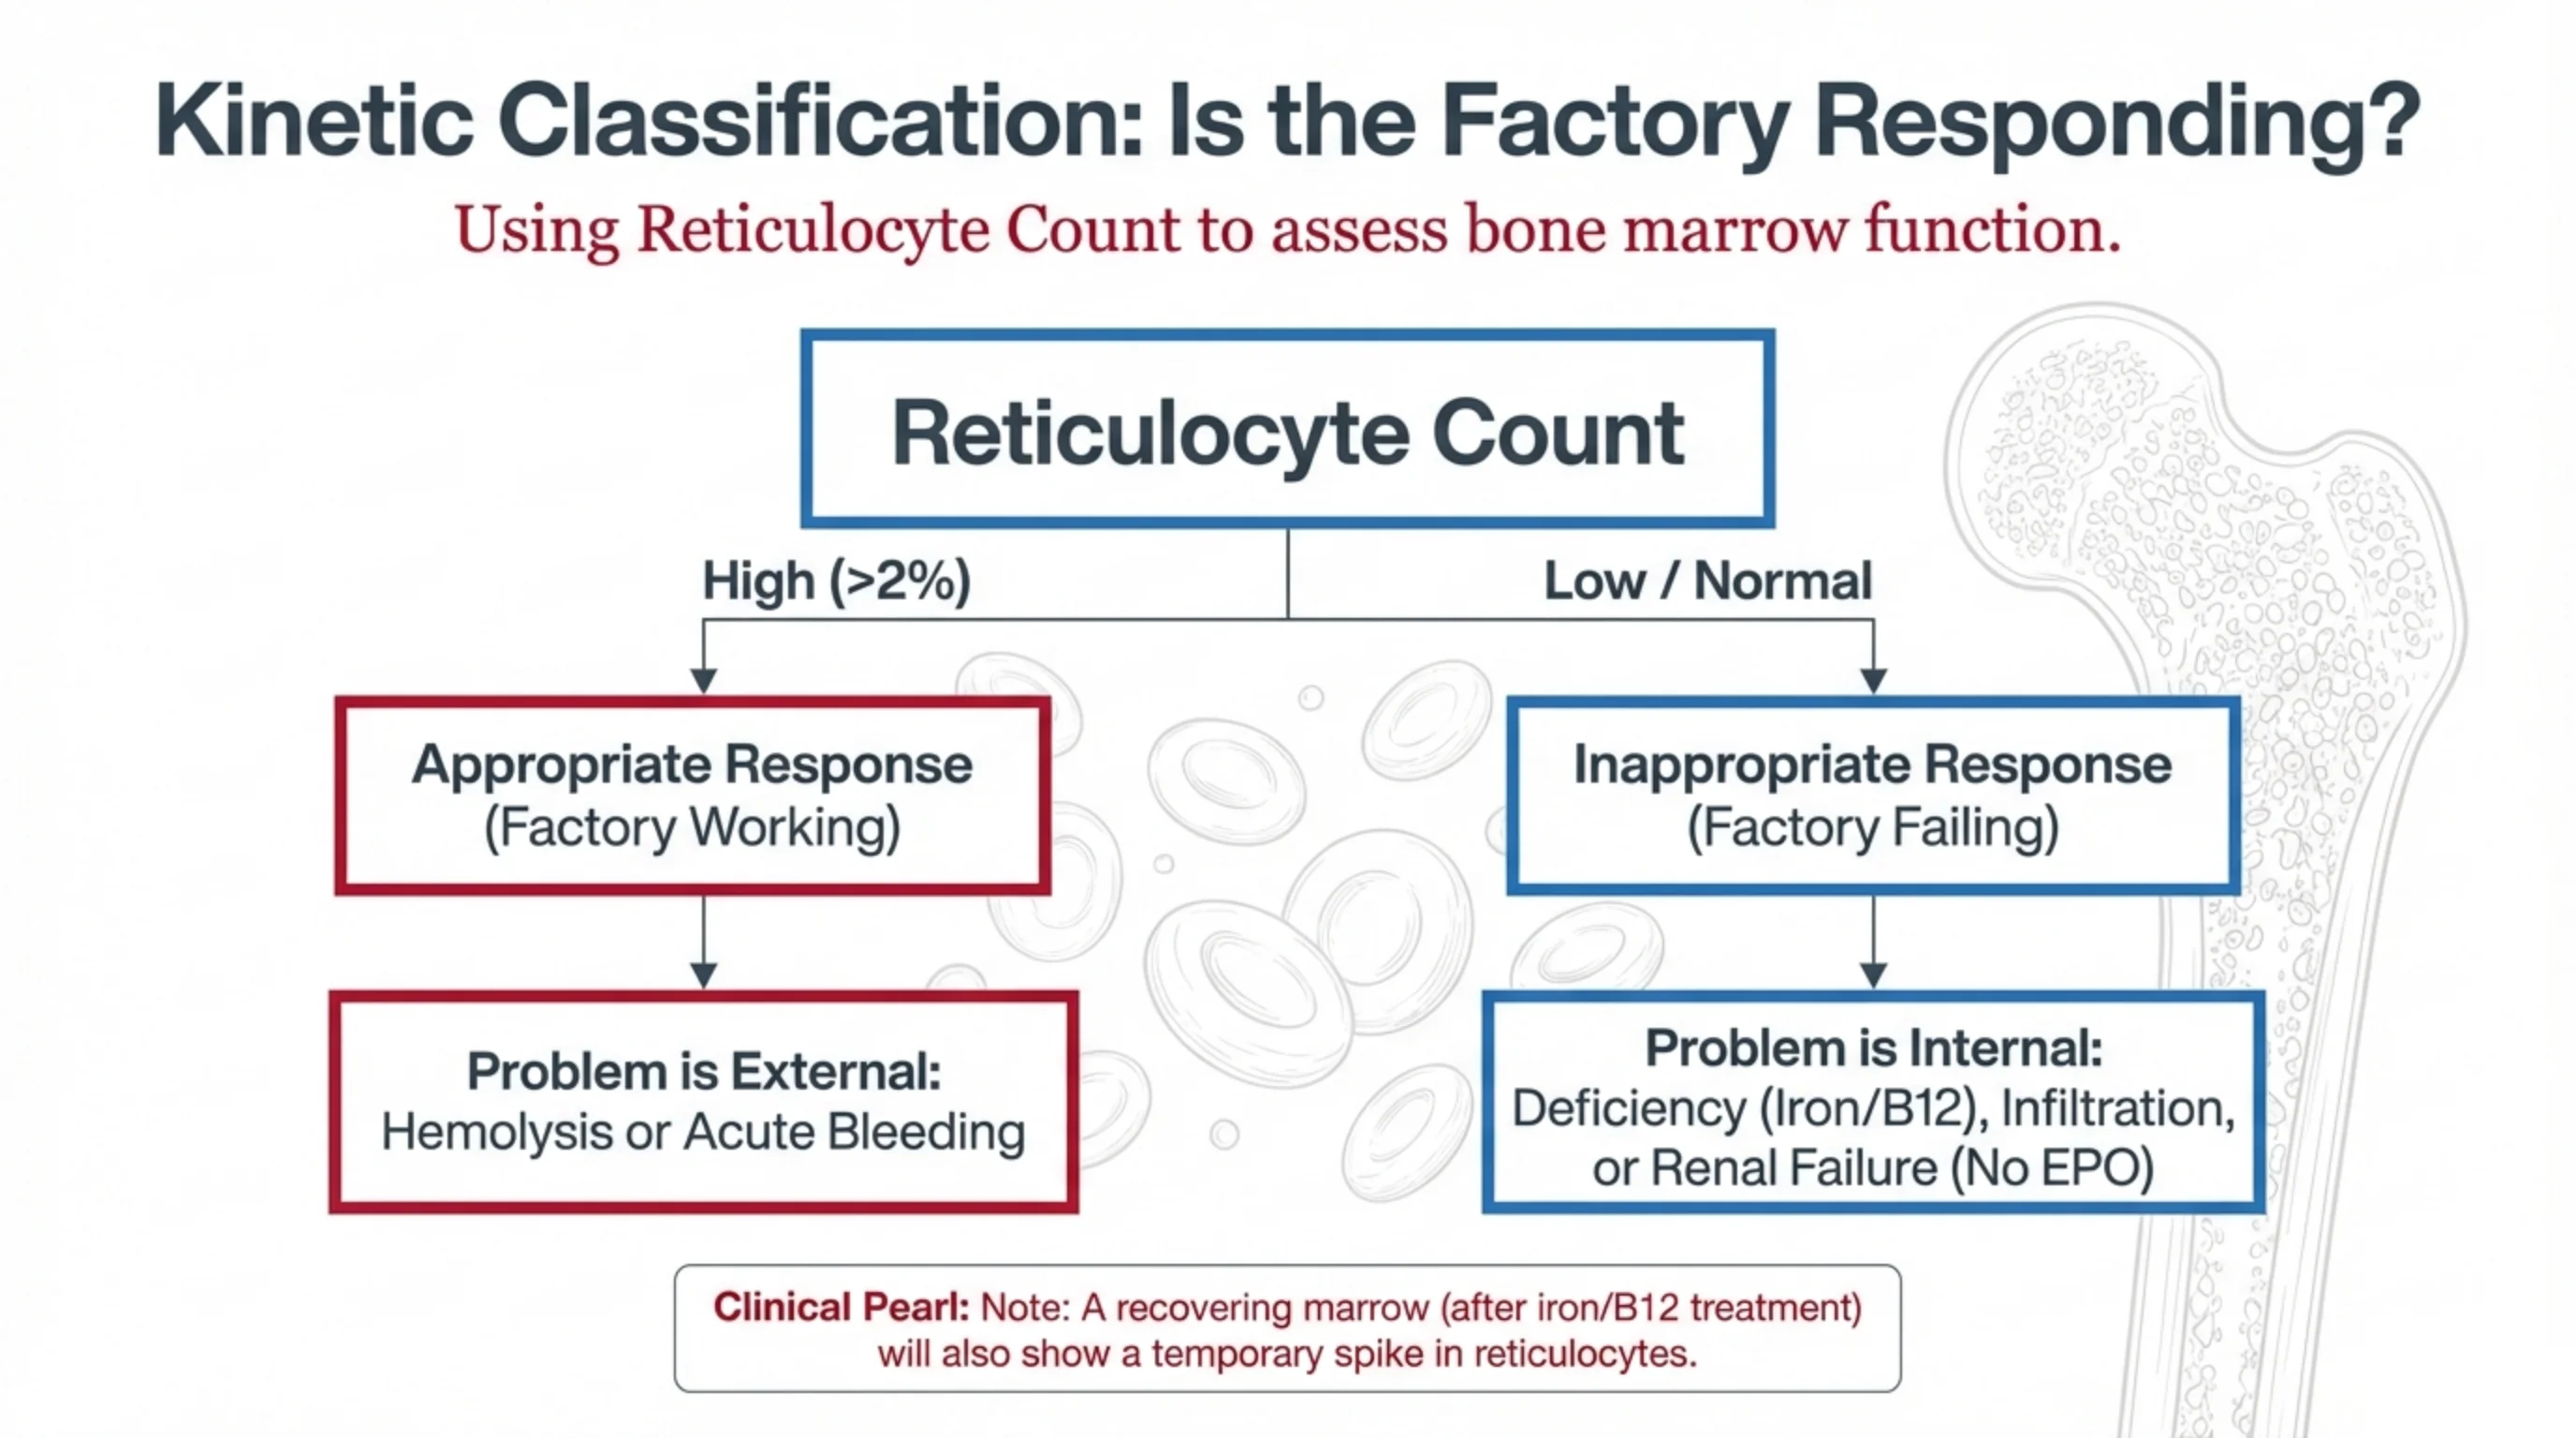
Using Reticulocyte Count to assess bone marrow function.
Reticulocyte Count:
- High (>2%) → Appropriate Response (Factory Working) → Problem is External: Hemolysis or Acute Bleeding
- Low / Normal → Inappropriate Response (Factory Failing) → Problem is Internal: Deficiency (Iron/B12), Infiltration, or Renal Failure (No EPO)
Clinical Pearl: Note: A recovering marrow (after iron/B12 treatment) will also show a temporary spike in reticulocytes.
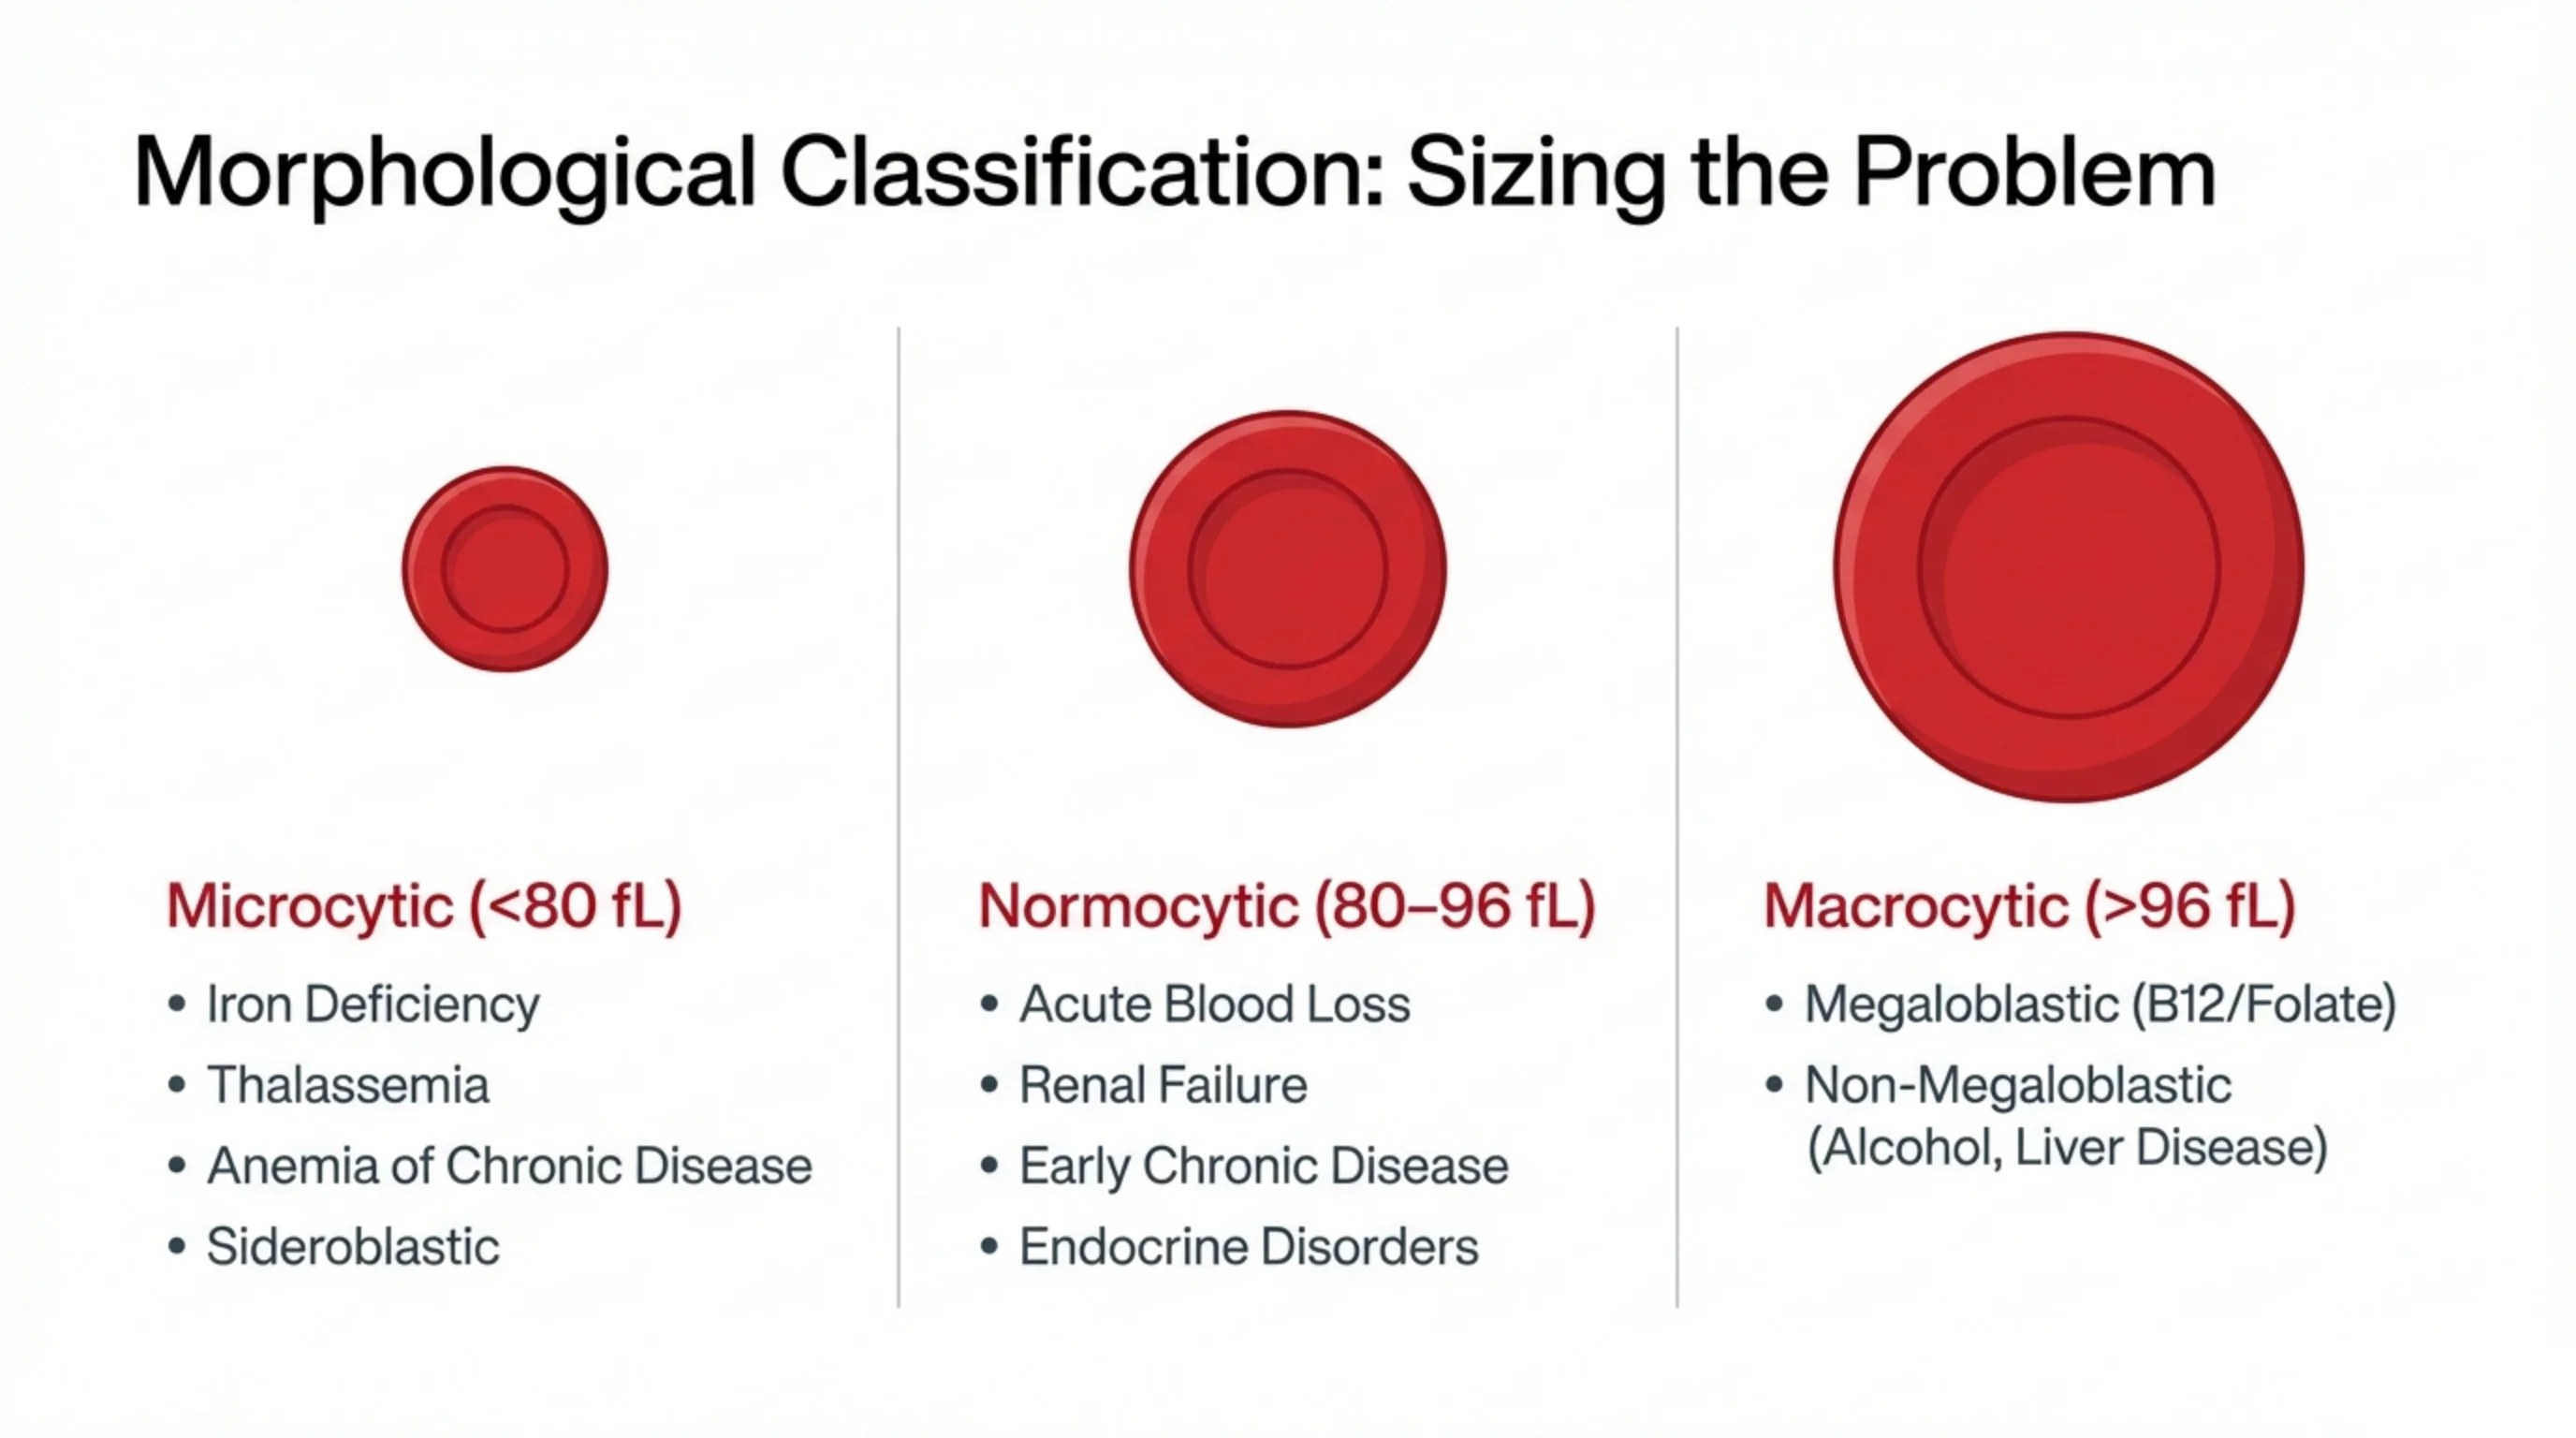
| Microcytic (<80 fL) | Normocytic (80–96 fL) | Macrocytic (>96 fL) |
|---|---|---|
|
|
|
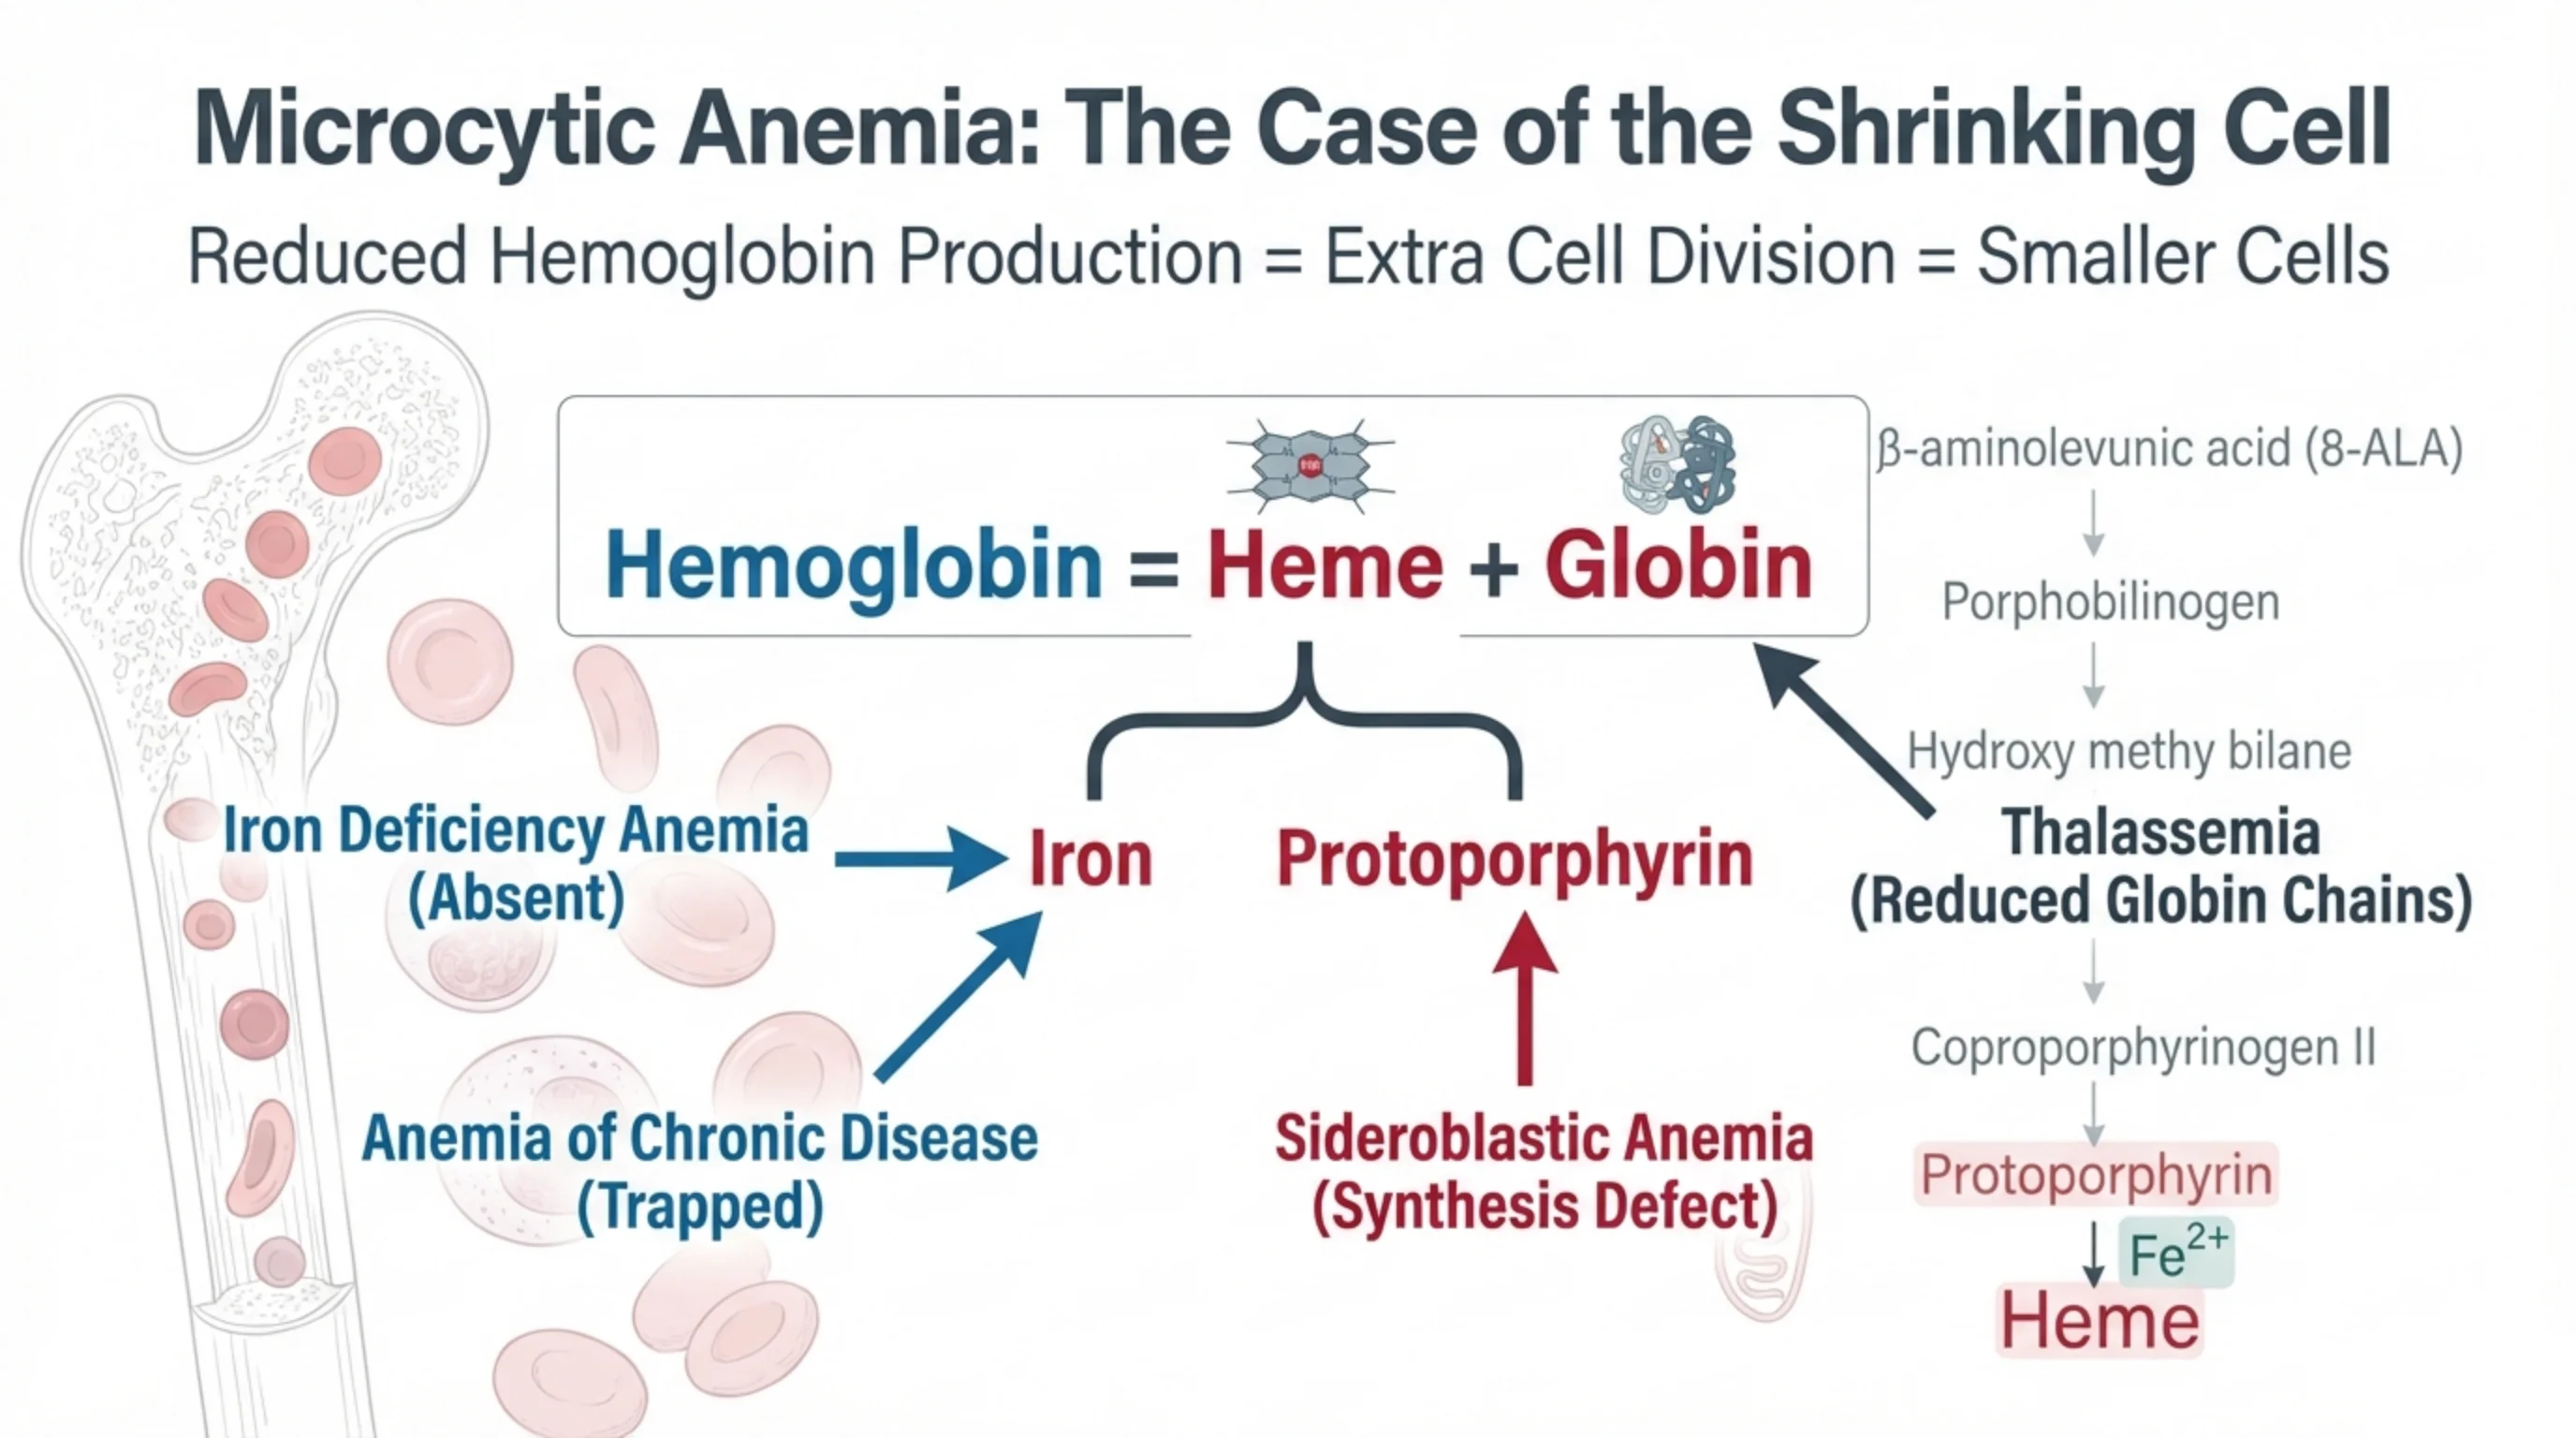
Reduced Hemoglobin Production = Extra Cell Division = Smaller Cells
Hemoglobin = Heme + Globin (Heme = Iron + Protoporphyrin)
- Iron Deficiency Anemia (Absent): affects Iron
- Anemia of Chronic Disease (Trapped): affects Iron
- Sideroblastic Anemia (Synthesis Defect): affects Protoporphyrin
- Thalassemia (Reduced Globin Chains): affects Globin
Heme synthesis pathway (right side):
- β-aminolevunic acid (δ-ALA) [as printed on slide]
- Porphobilinogen
- Hydroxy methy bilane [as printed on slide]
- Coproporphyrinogen II [as printed]
- Protoporphyrin
- + Fe2+ → Heme
Note: some pathway intermediate labels appear misspelled on the slide (transcribed verbatim).
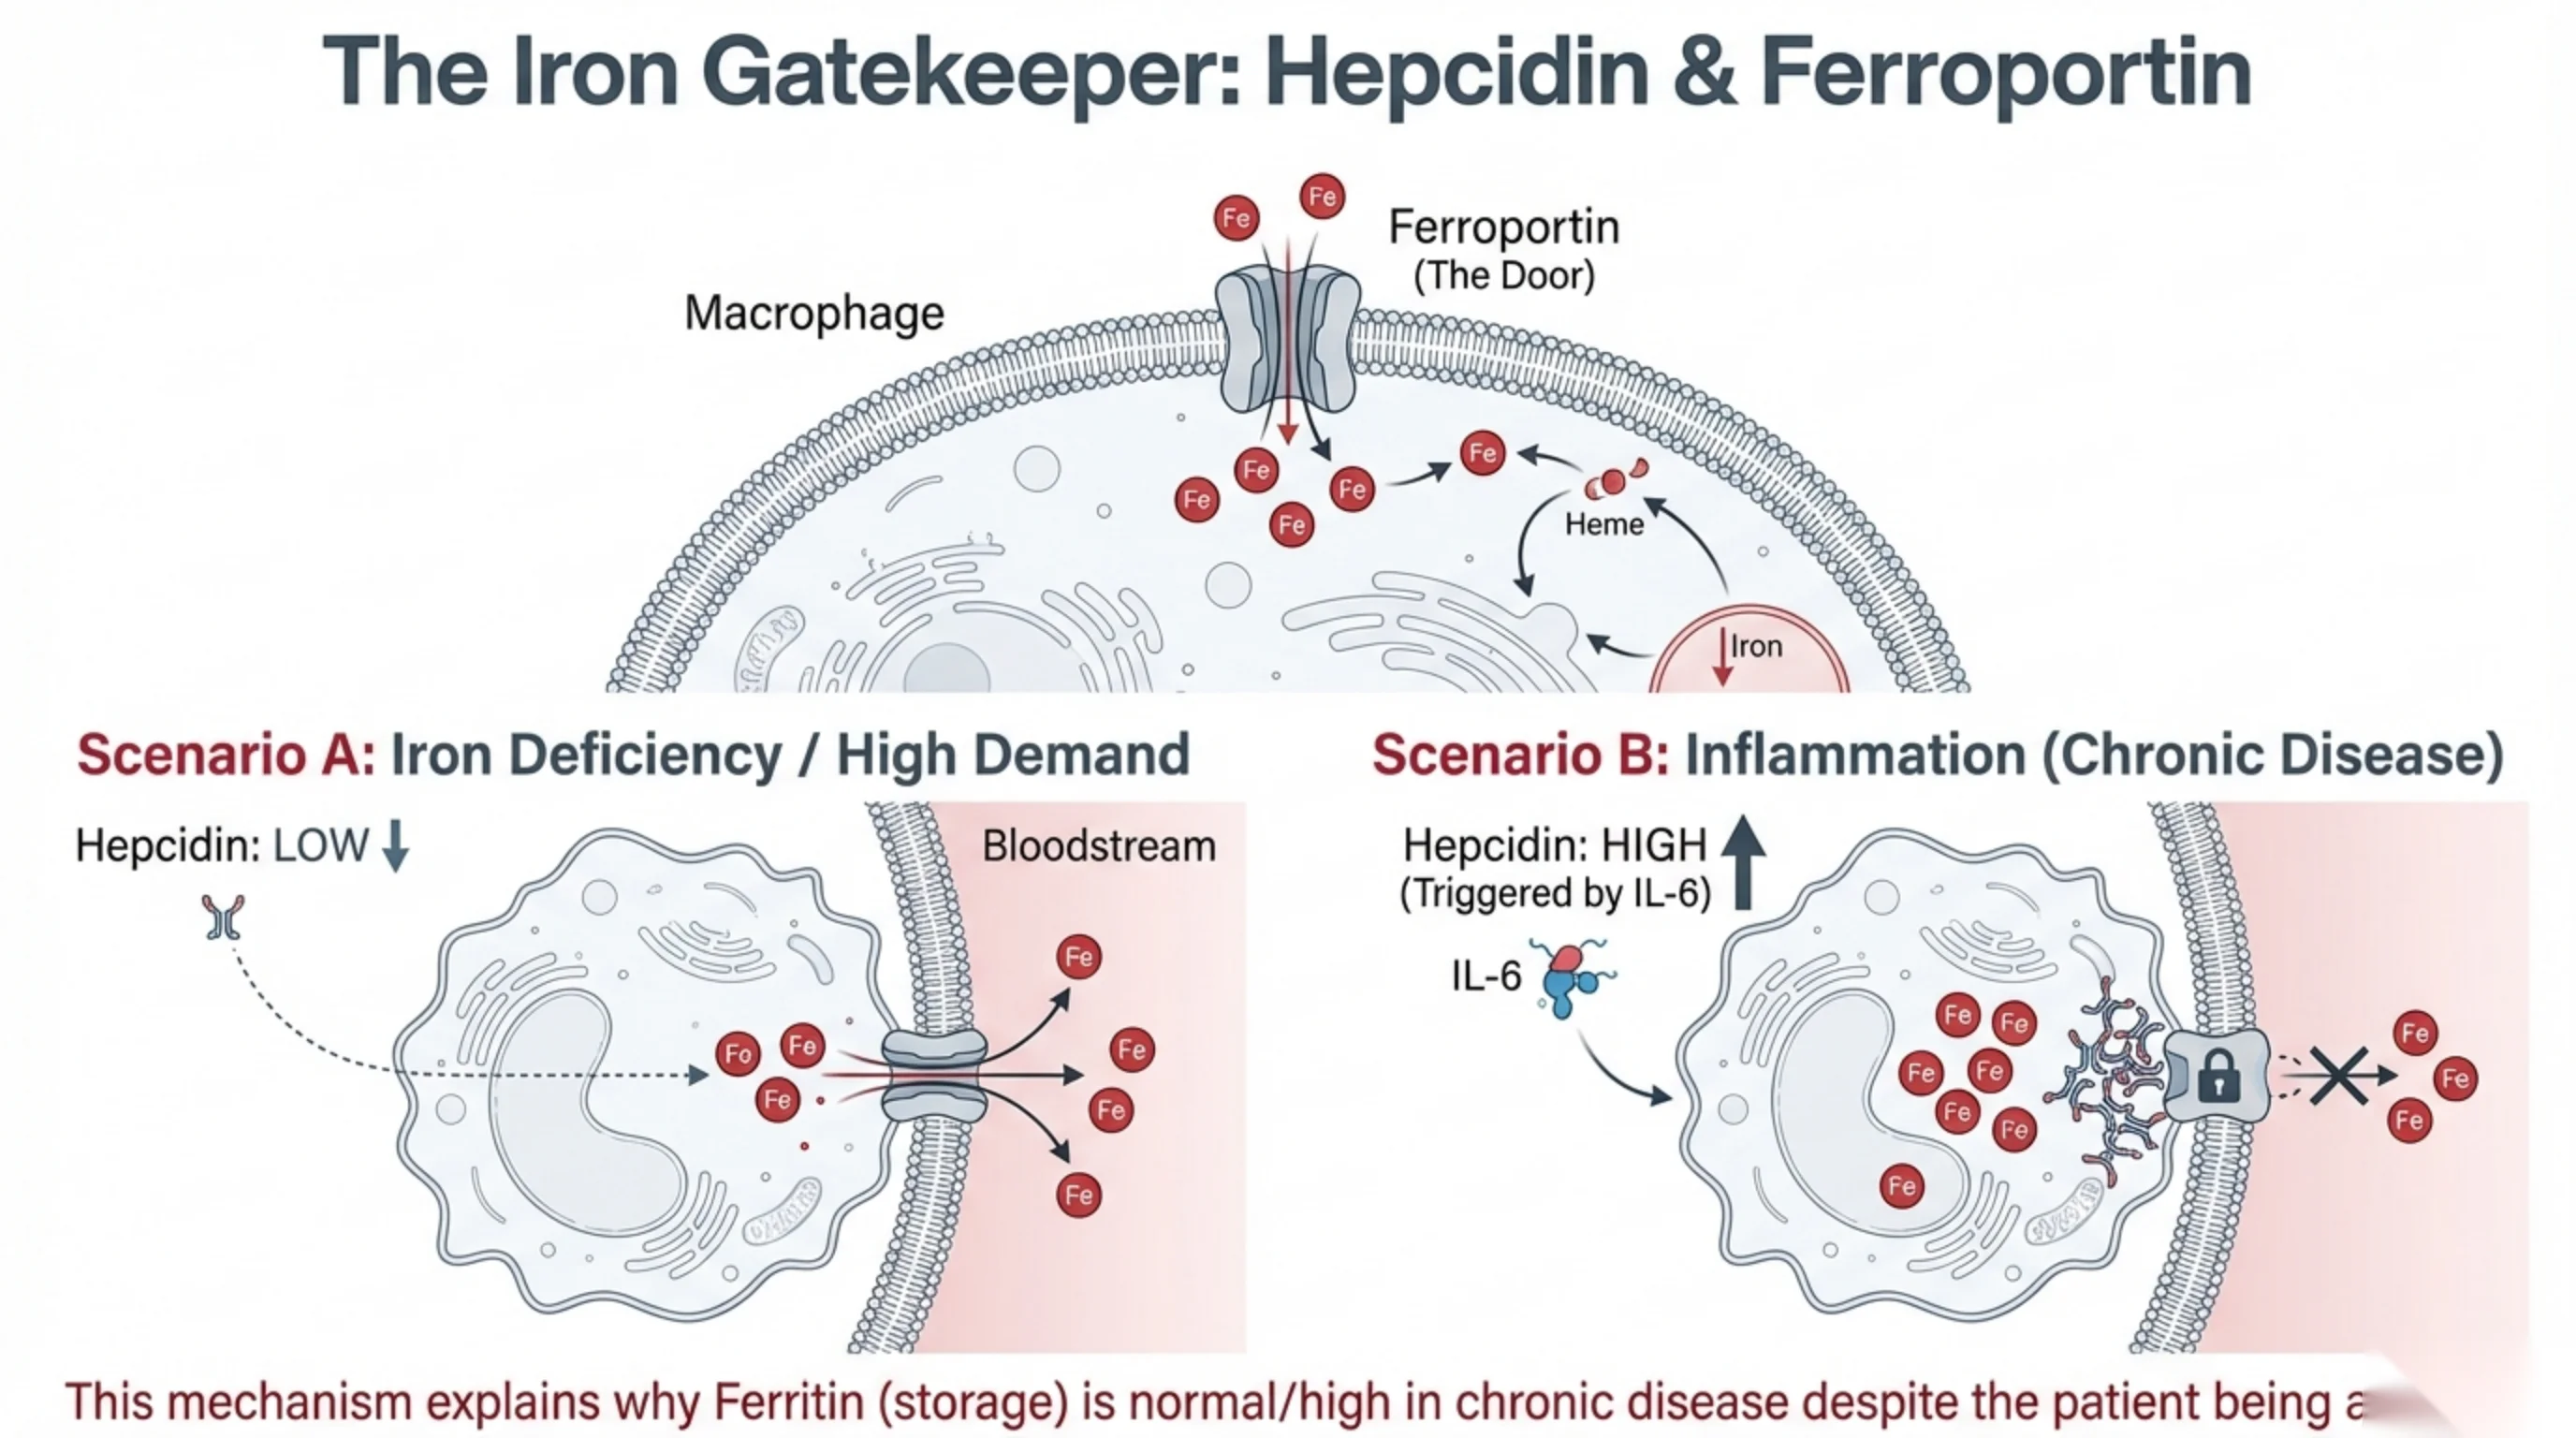
Iron (Fe) exits the Macrophage via Ferroportin (The Door). Recycled iron comes from heme; stored iron sits inside the cell.
Scenario A: Iron Deficiency / High Demand
Hepcidin: LOW ↓ → Ferroportin door stays open → Iron (Fe) is released into the Bloodstream.
Scenario B: Inflammation (Chronic Disease)
Hepcidin: HIGH ↑ (Triggered by IL-6) → Ferroportin door is locked → Iron (Fe) is trapped inside the cell and cannot exit.
Bottom note (partially cut off on slide): “This mechanism explains why Ferritin (storage) is normal/high in chronic disease despite the patient being a…” (text truncated at slide edge; likely “…anemic”).
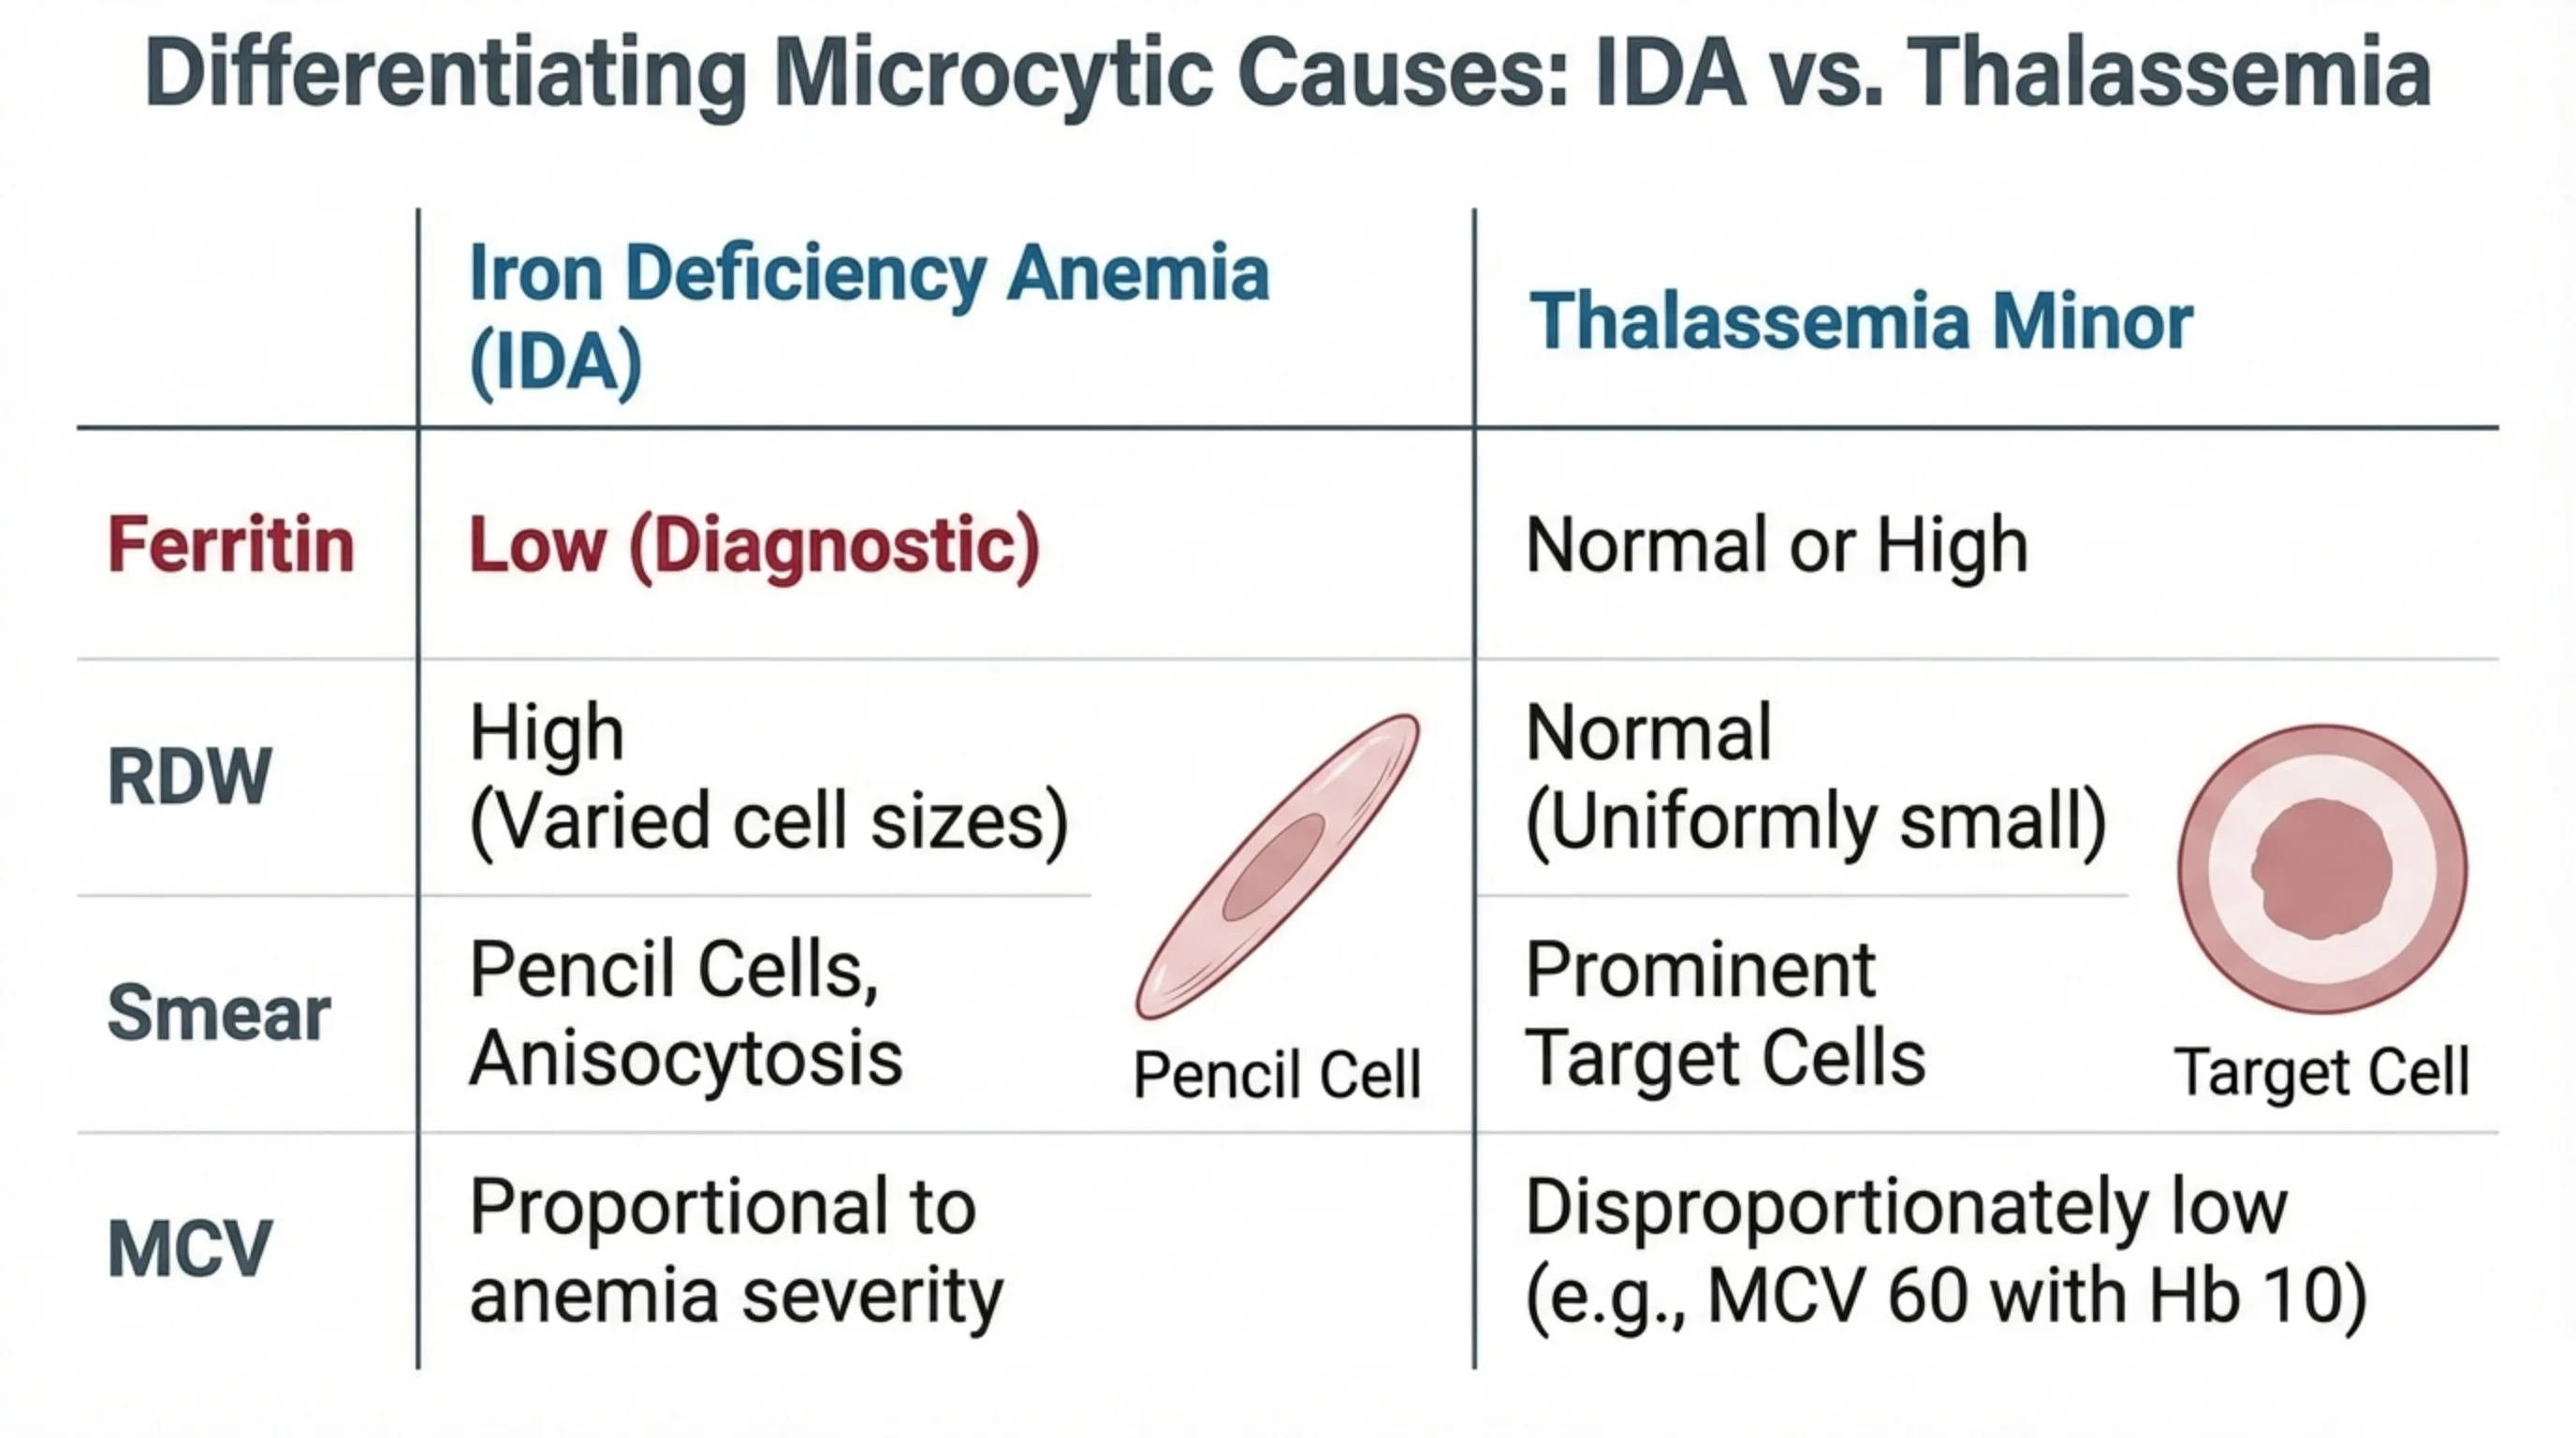
| Iron Deficiency Anemia (IDA) | Thalassemia Minor | |
|---|---|---|
| Ferritin | Low (Diagnostic) | Normal or High |
| RDW | High (Varied cell sizes) | Normal (Uniformly small) |
| Smear | Pencil Cells, Anisocytosis | Prominent Target Cells |
| MCV | Proportional to anemia severity | Disproportionately low (e.g., MCV 60 with Hb 10) |
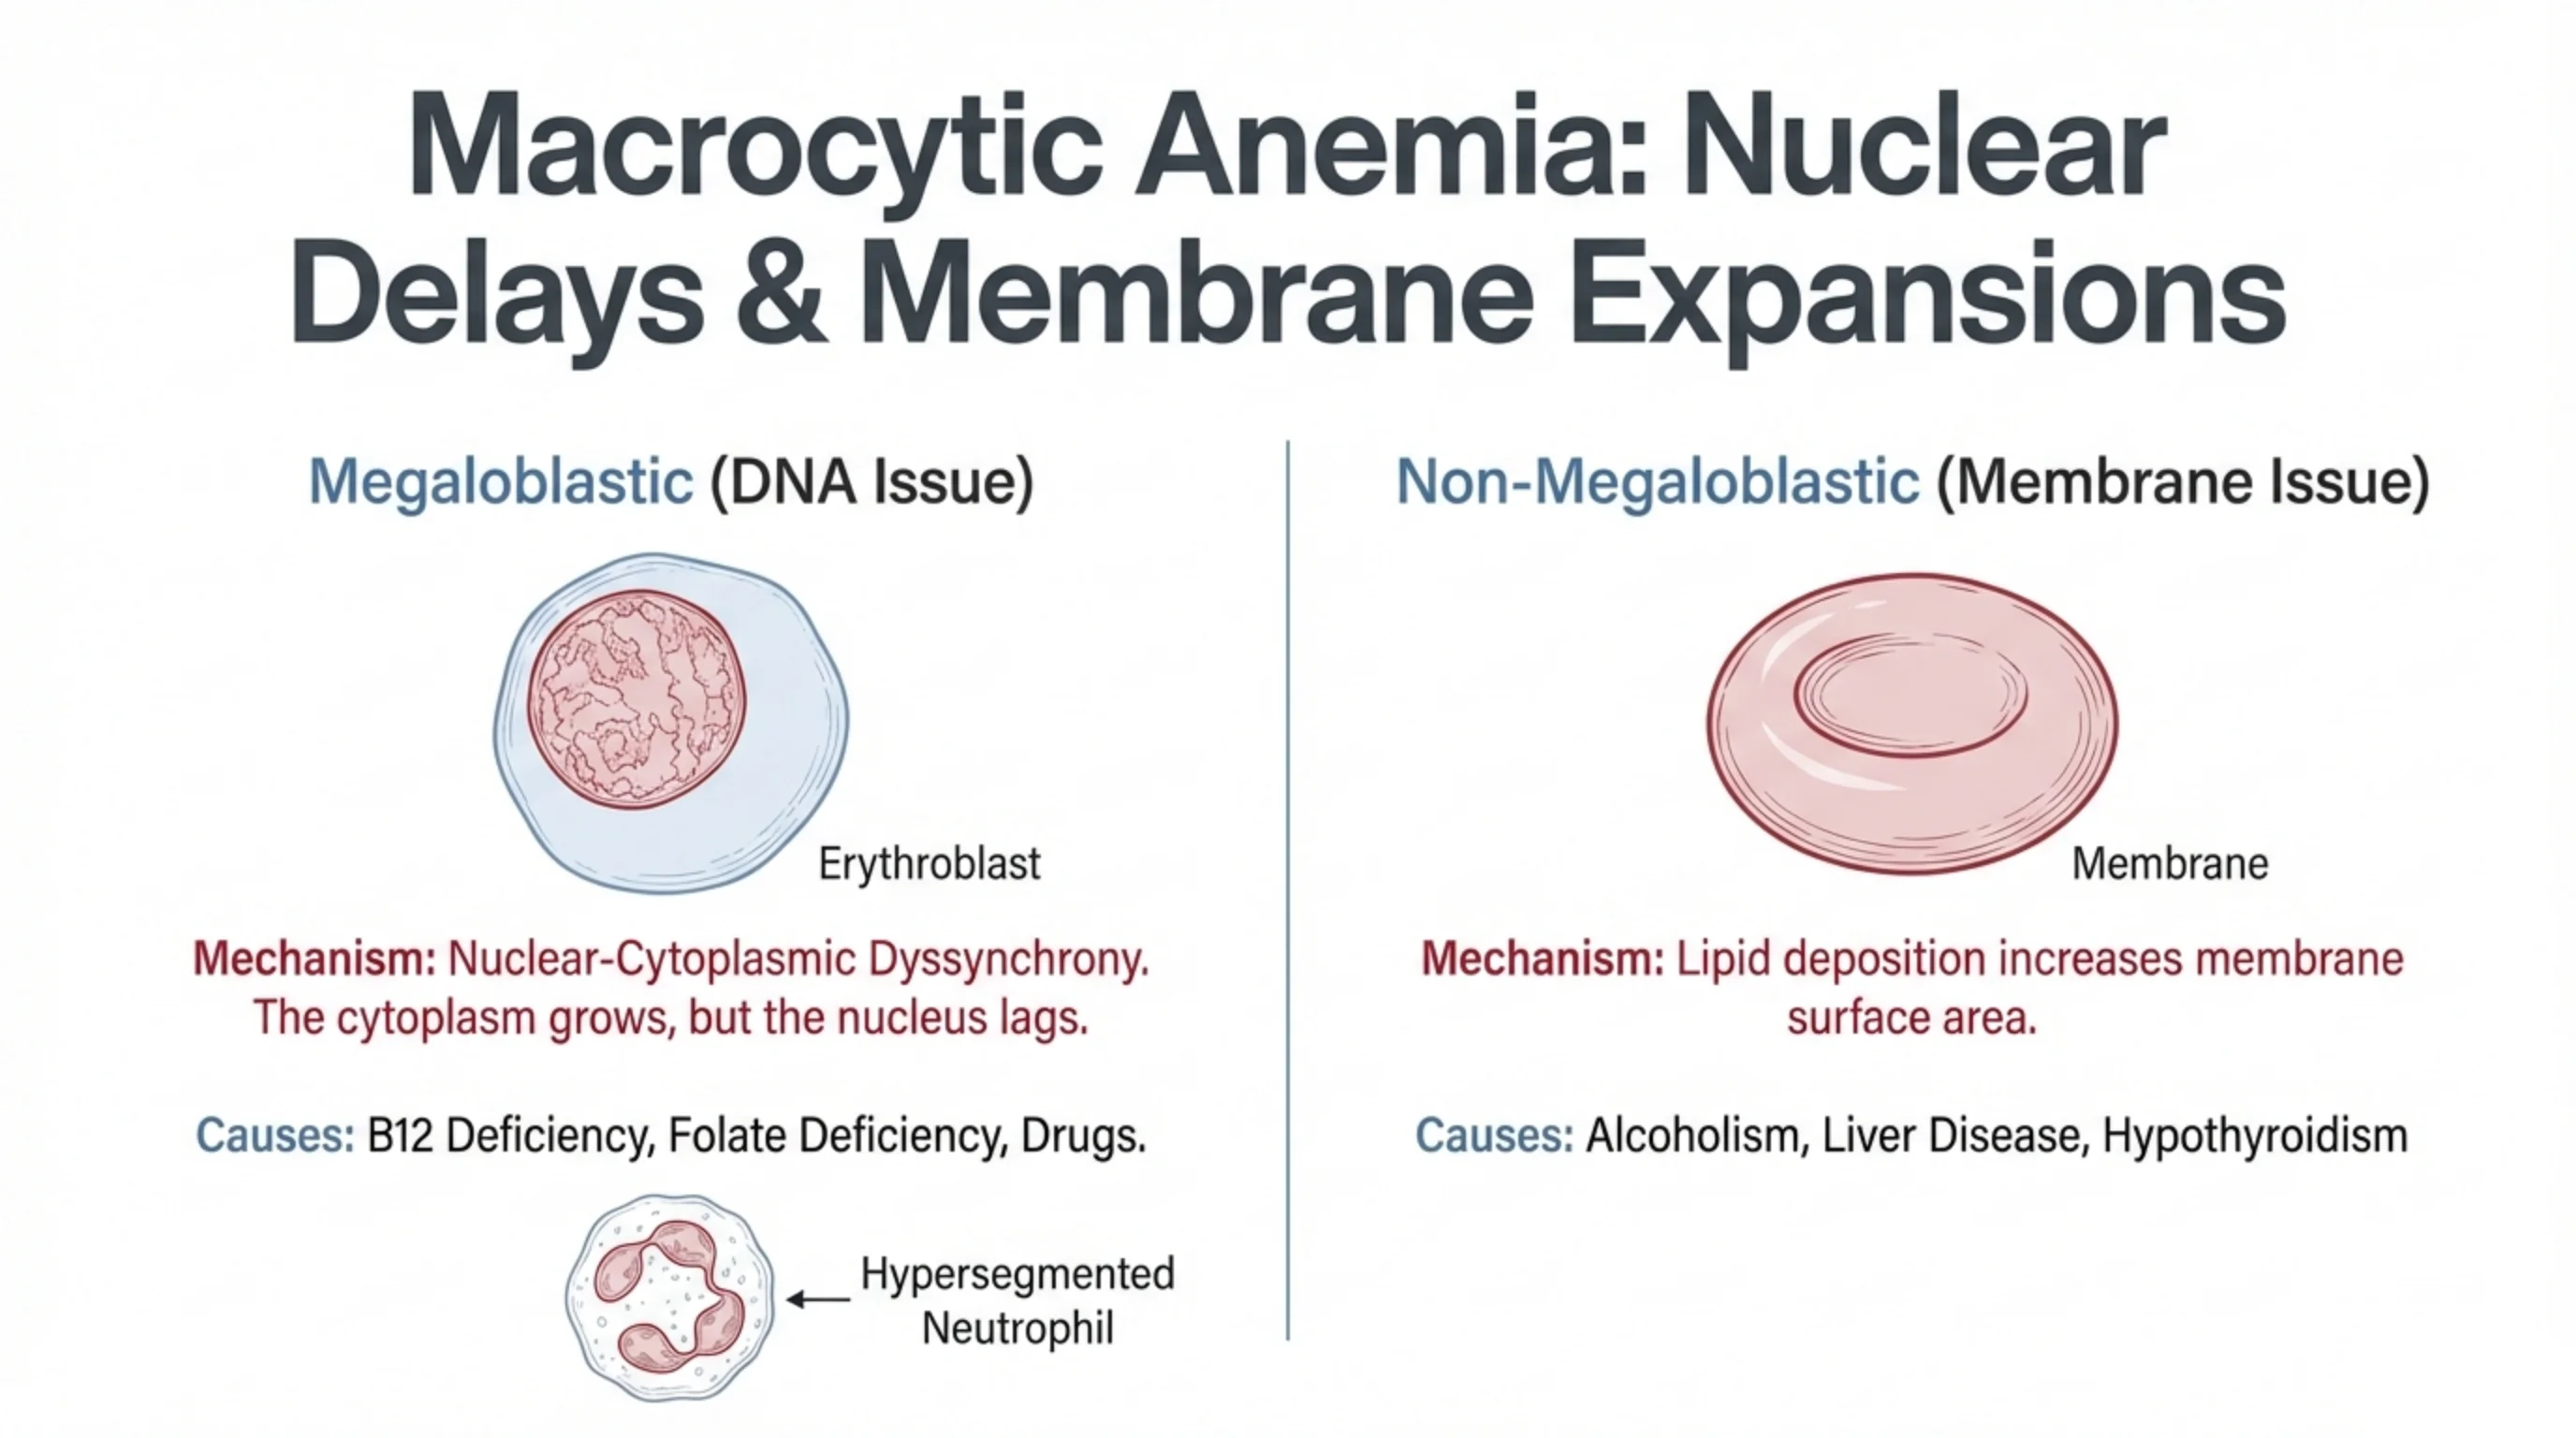
| Megaloblastic (DNA Issue) | Non-Megaloblastic (Membrane Issue) |
|---|---|
Mechanism: Nuclear-Cytoplasmic Dyssynchrony. The cytoplasm grows, but the nucleus lags. Causes: B12 Deficiency, Folate Deficiency, Drugs. Associated finding: Hypersegmented Neutrophil. | Mechanism: Lipid deposition increases membrane surface area. Causes: Alcoholism, Liver Disease, Hypothyroidism. |
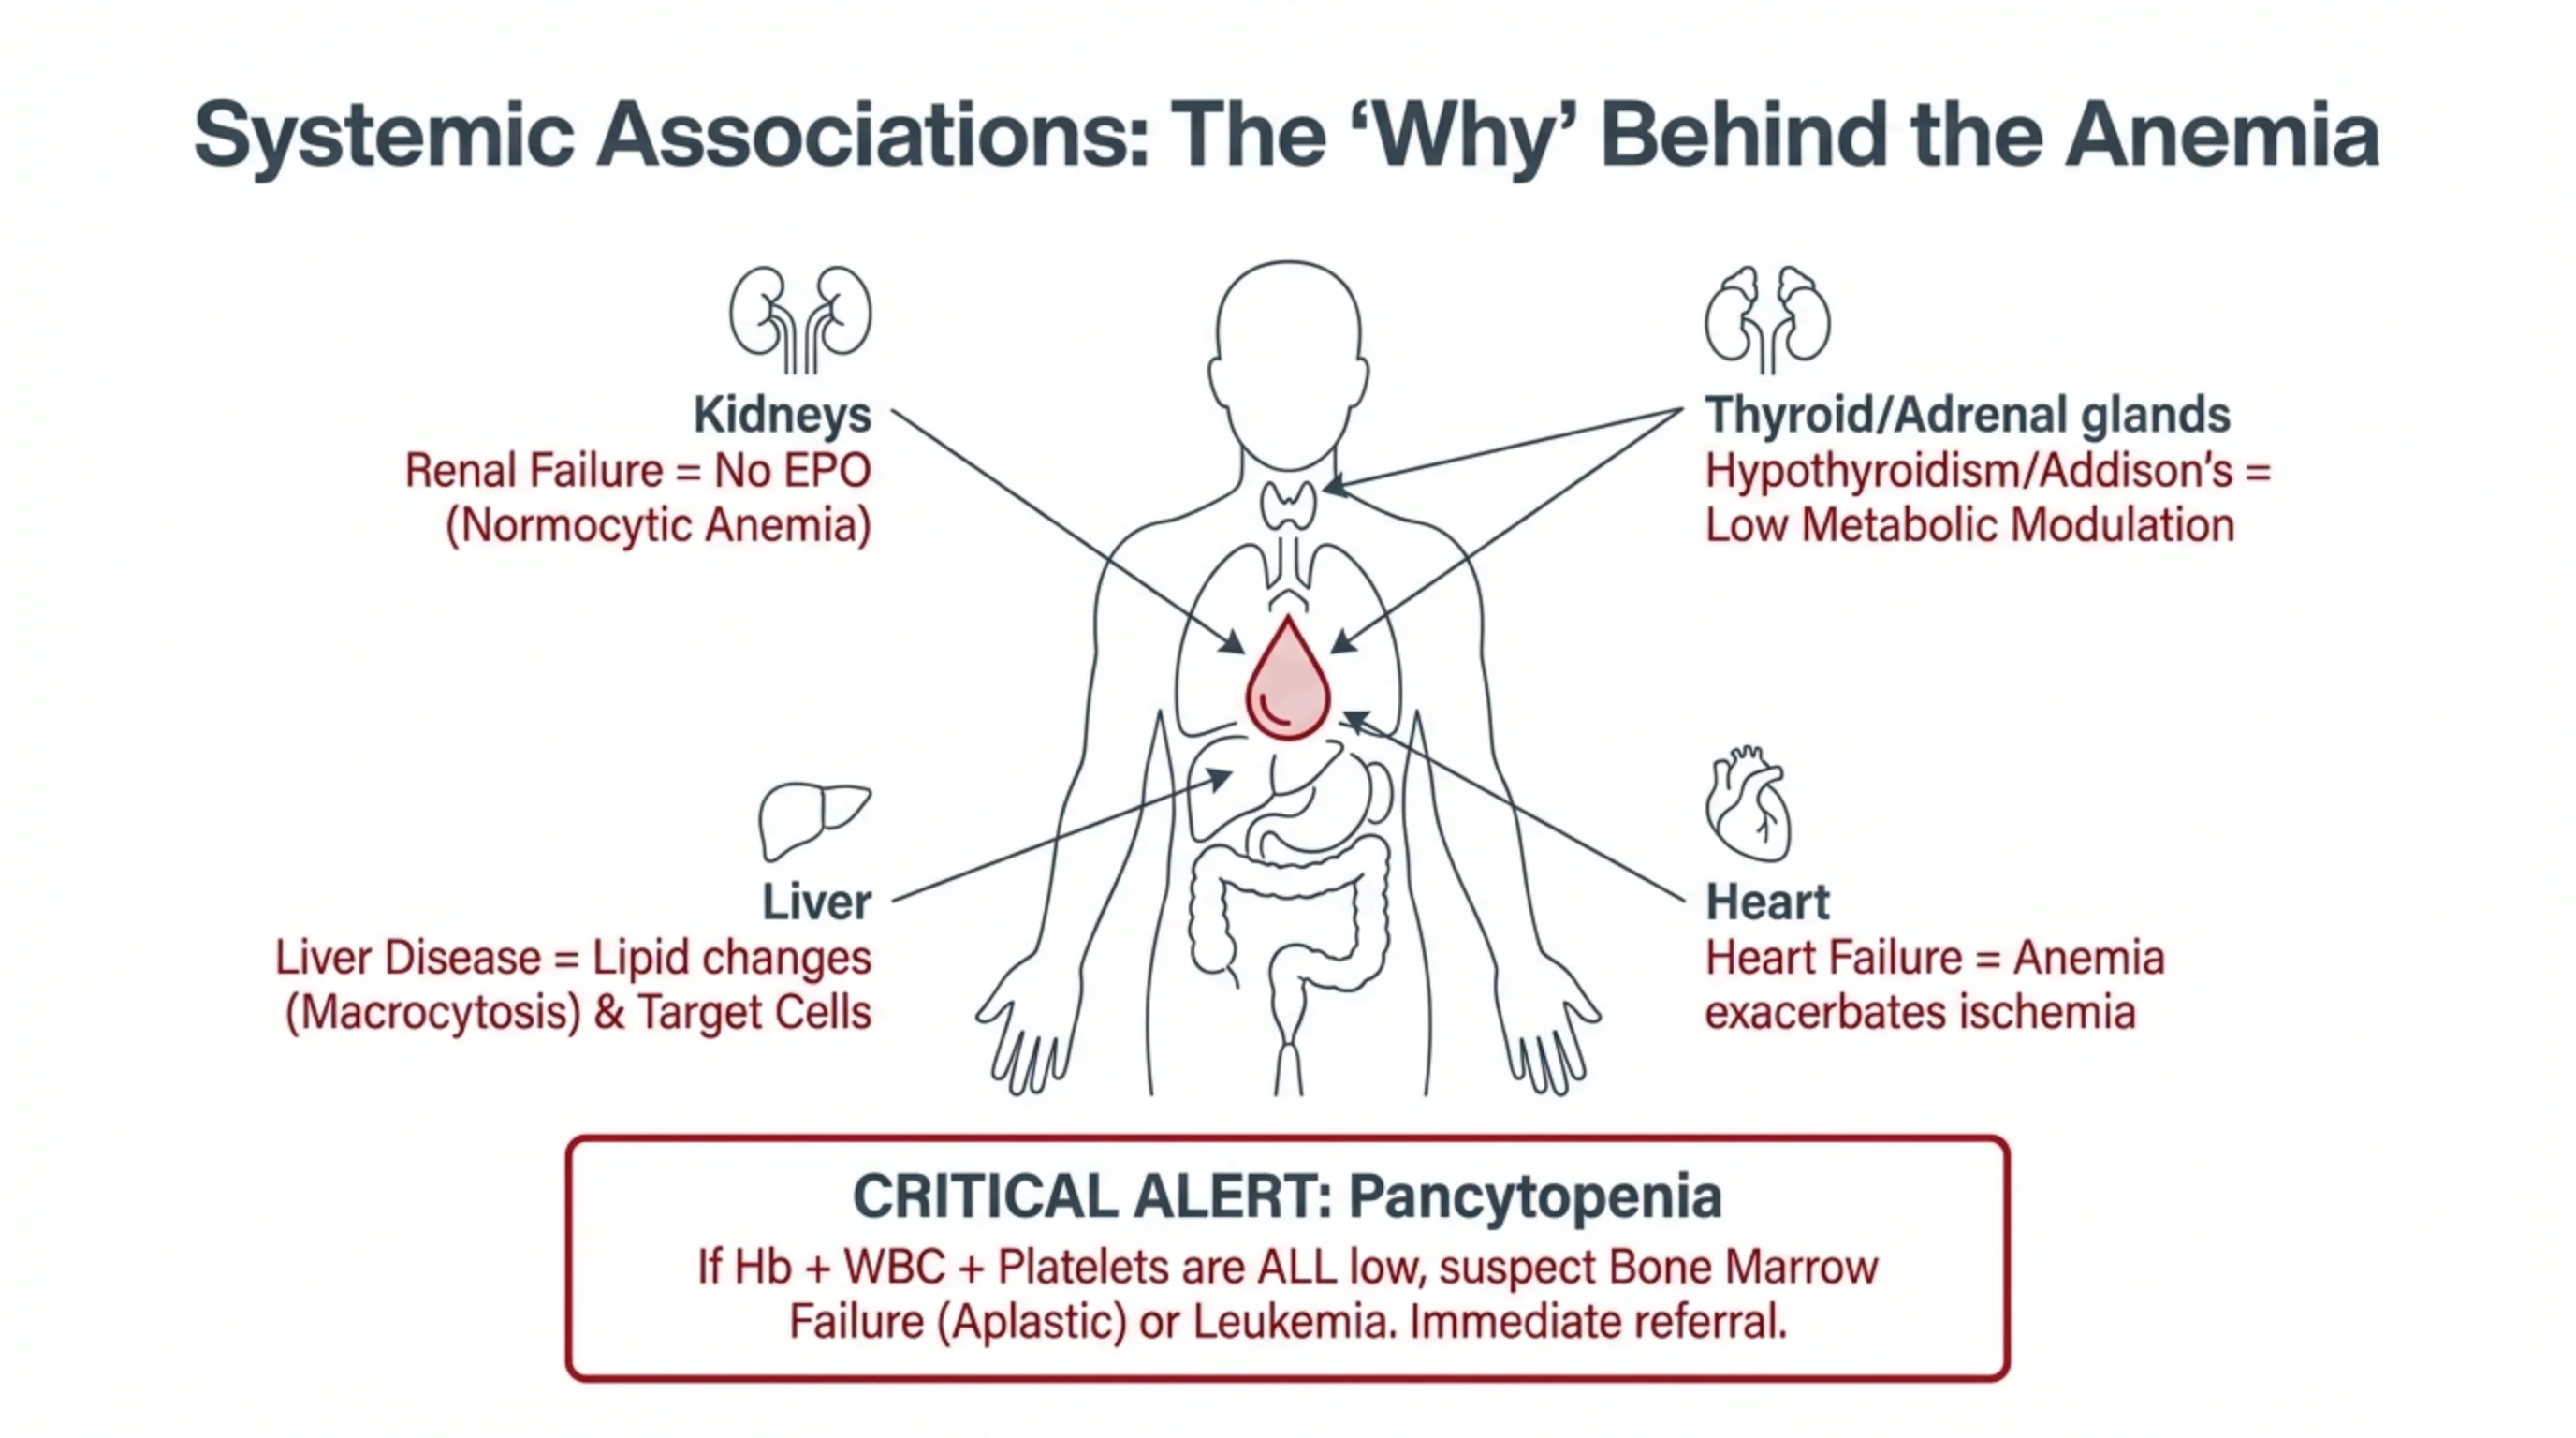
- Kidneys: Renal Failure = No EPO (Normocytic Anemia)
- Thyroid/Adrenal glands: Hypothyroidism/Addison’s = Low Metabolic Modulation
- Liver: Liver Disease = Lipid changes (Macrocytosis) & Target Cells
- Heart: Heart Failure = Anemia exacerbates ischemia
CRITICAL ALERT: Pancytopenia
If Hb + WBC + Platelets are ALL low, suspect Bone Marrow Failure (Aplastic) or Leukemia. Immediate referral.
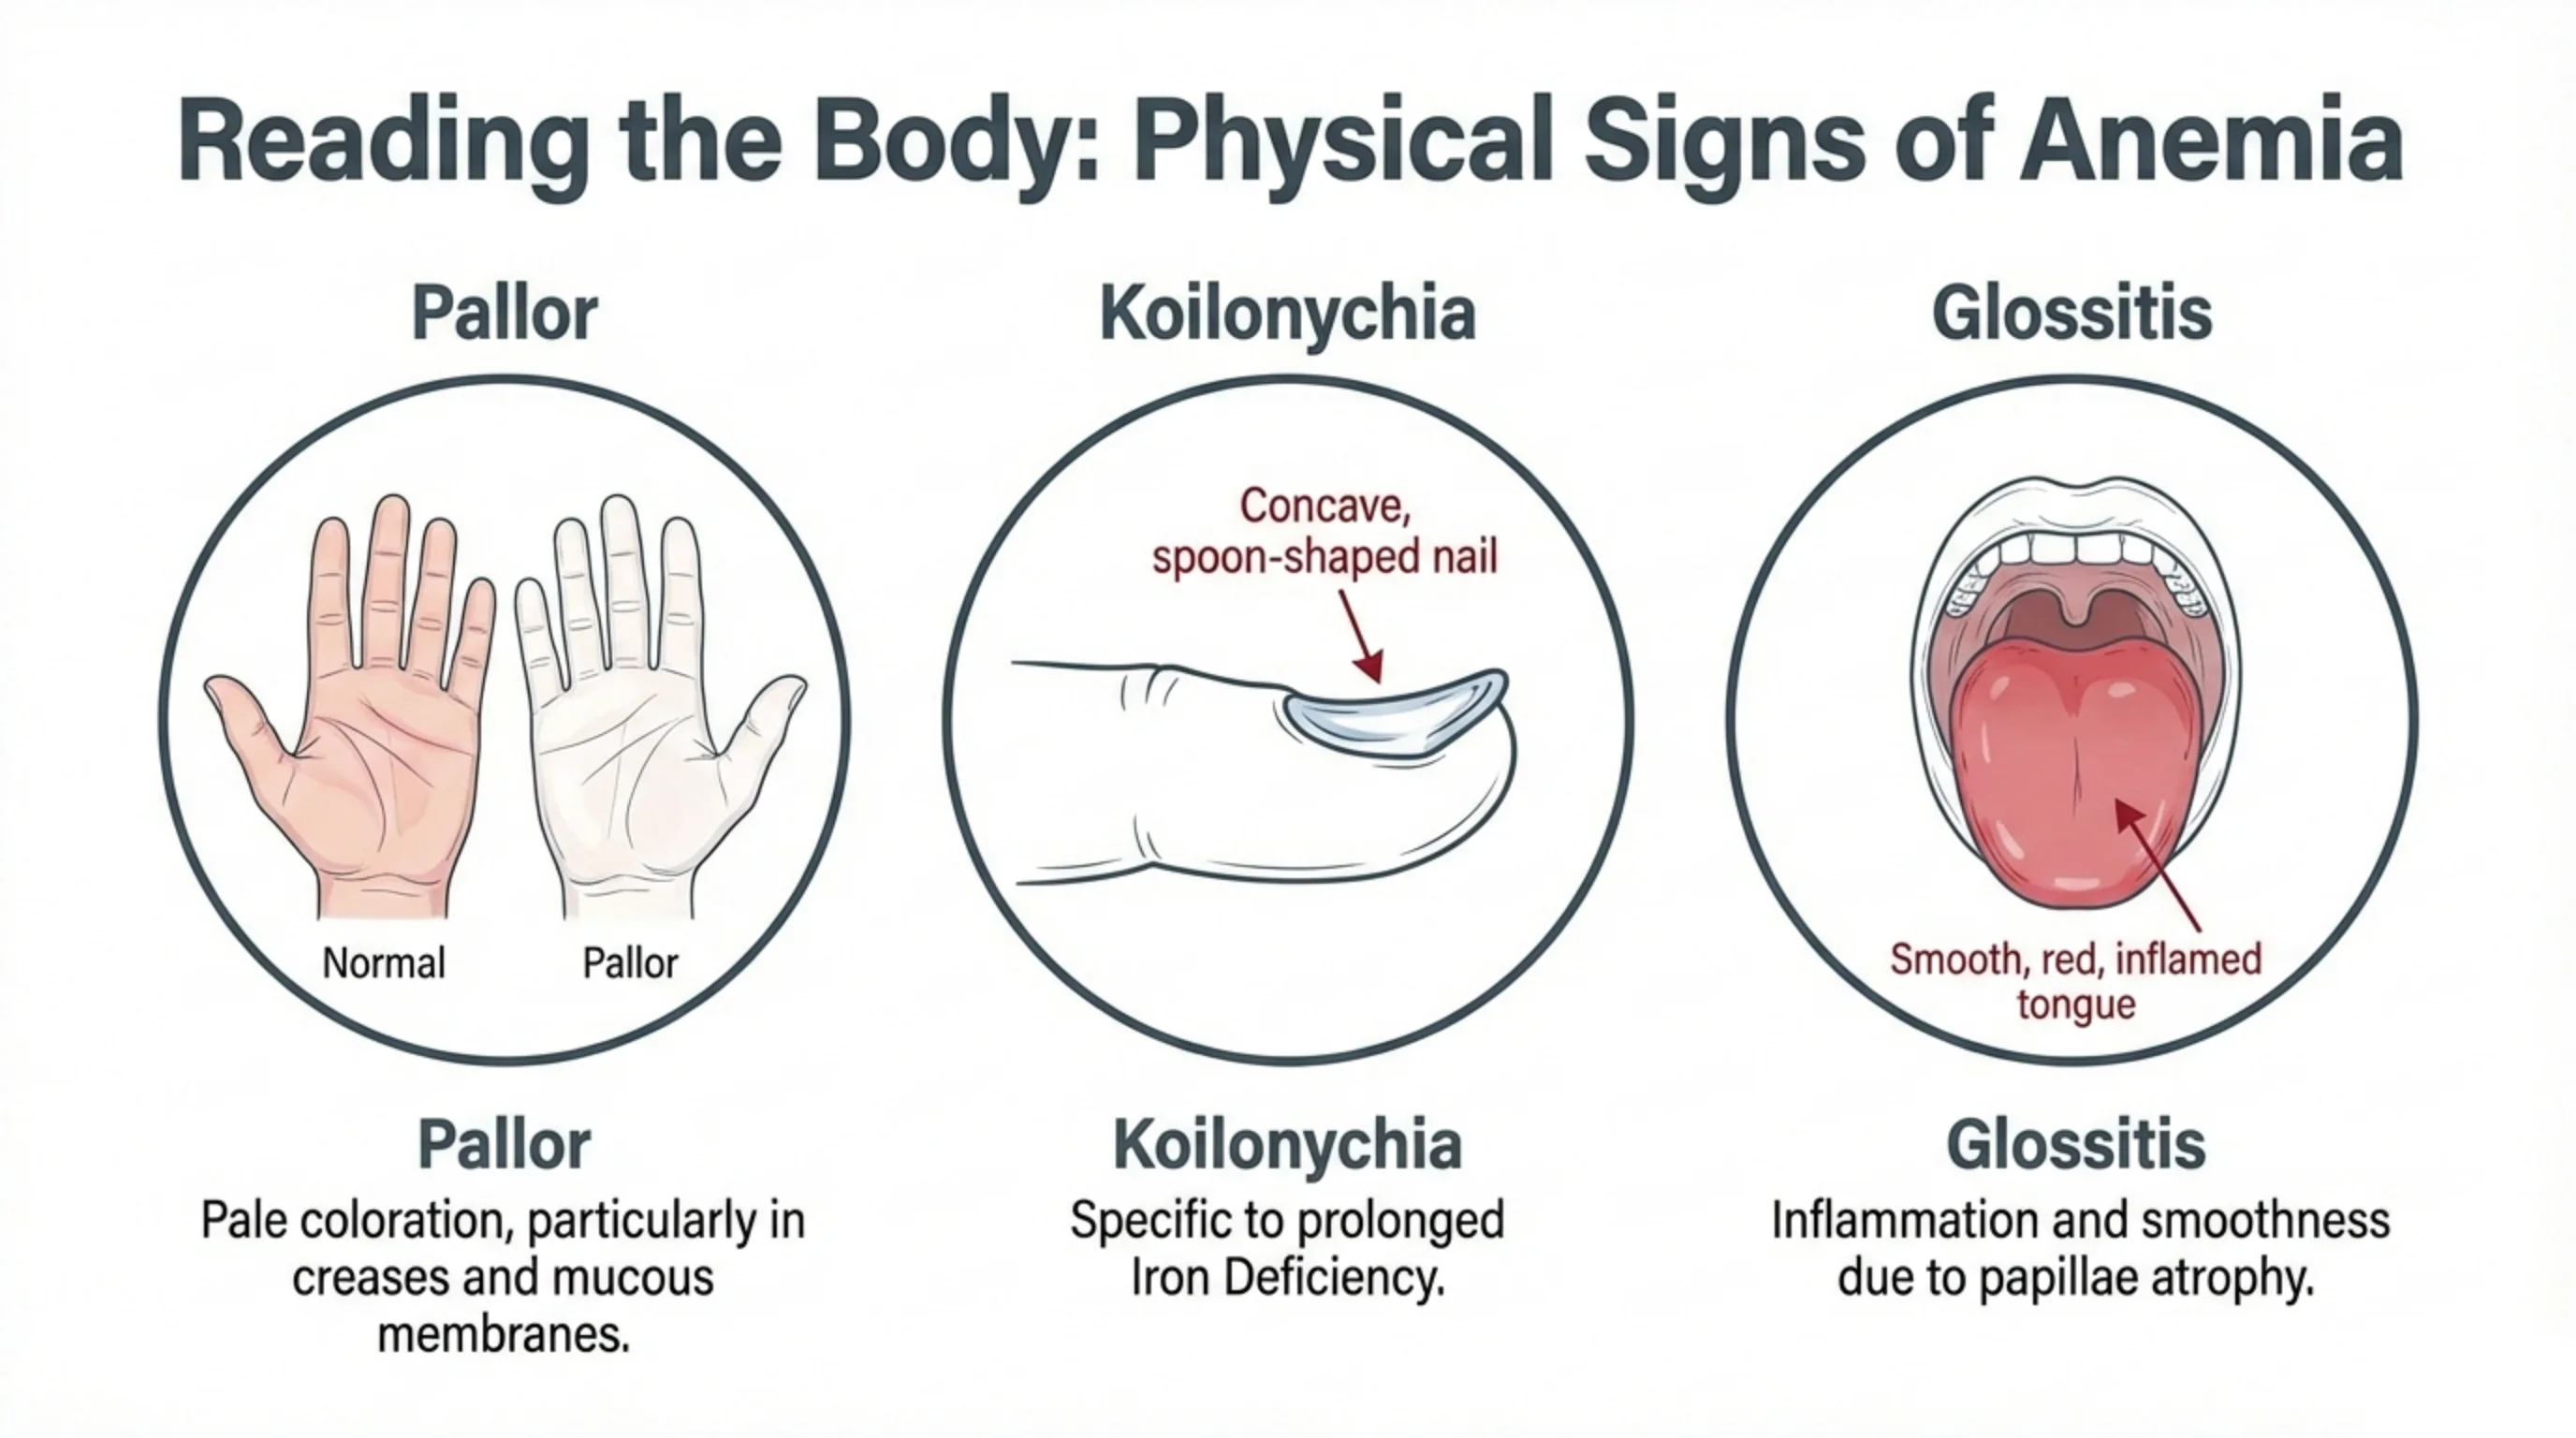
- Pallor: Pale coloration, particularly in creases and mucous membranes.
- Koilonychia: Concave, spoon-shaped nail. Specific to prolonged Iron Deficiency.
- Glossitis: Smooth, red, inflamed tongue. Inflammation and smoothness due to papillae atrophy.
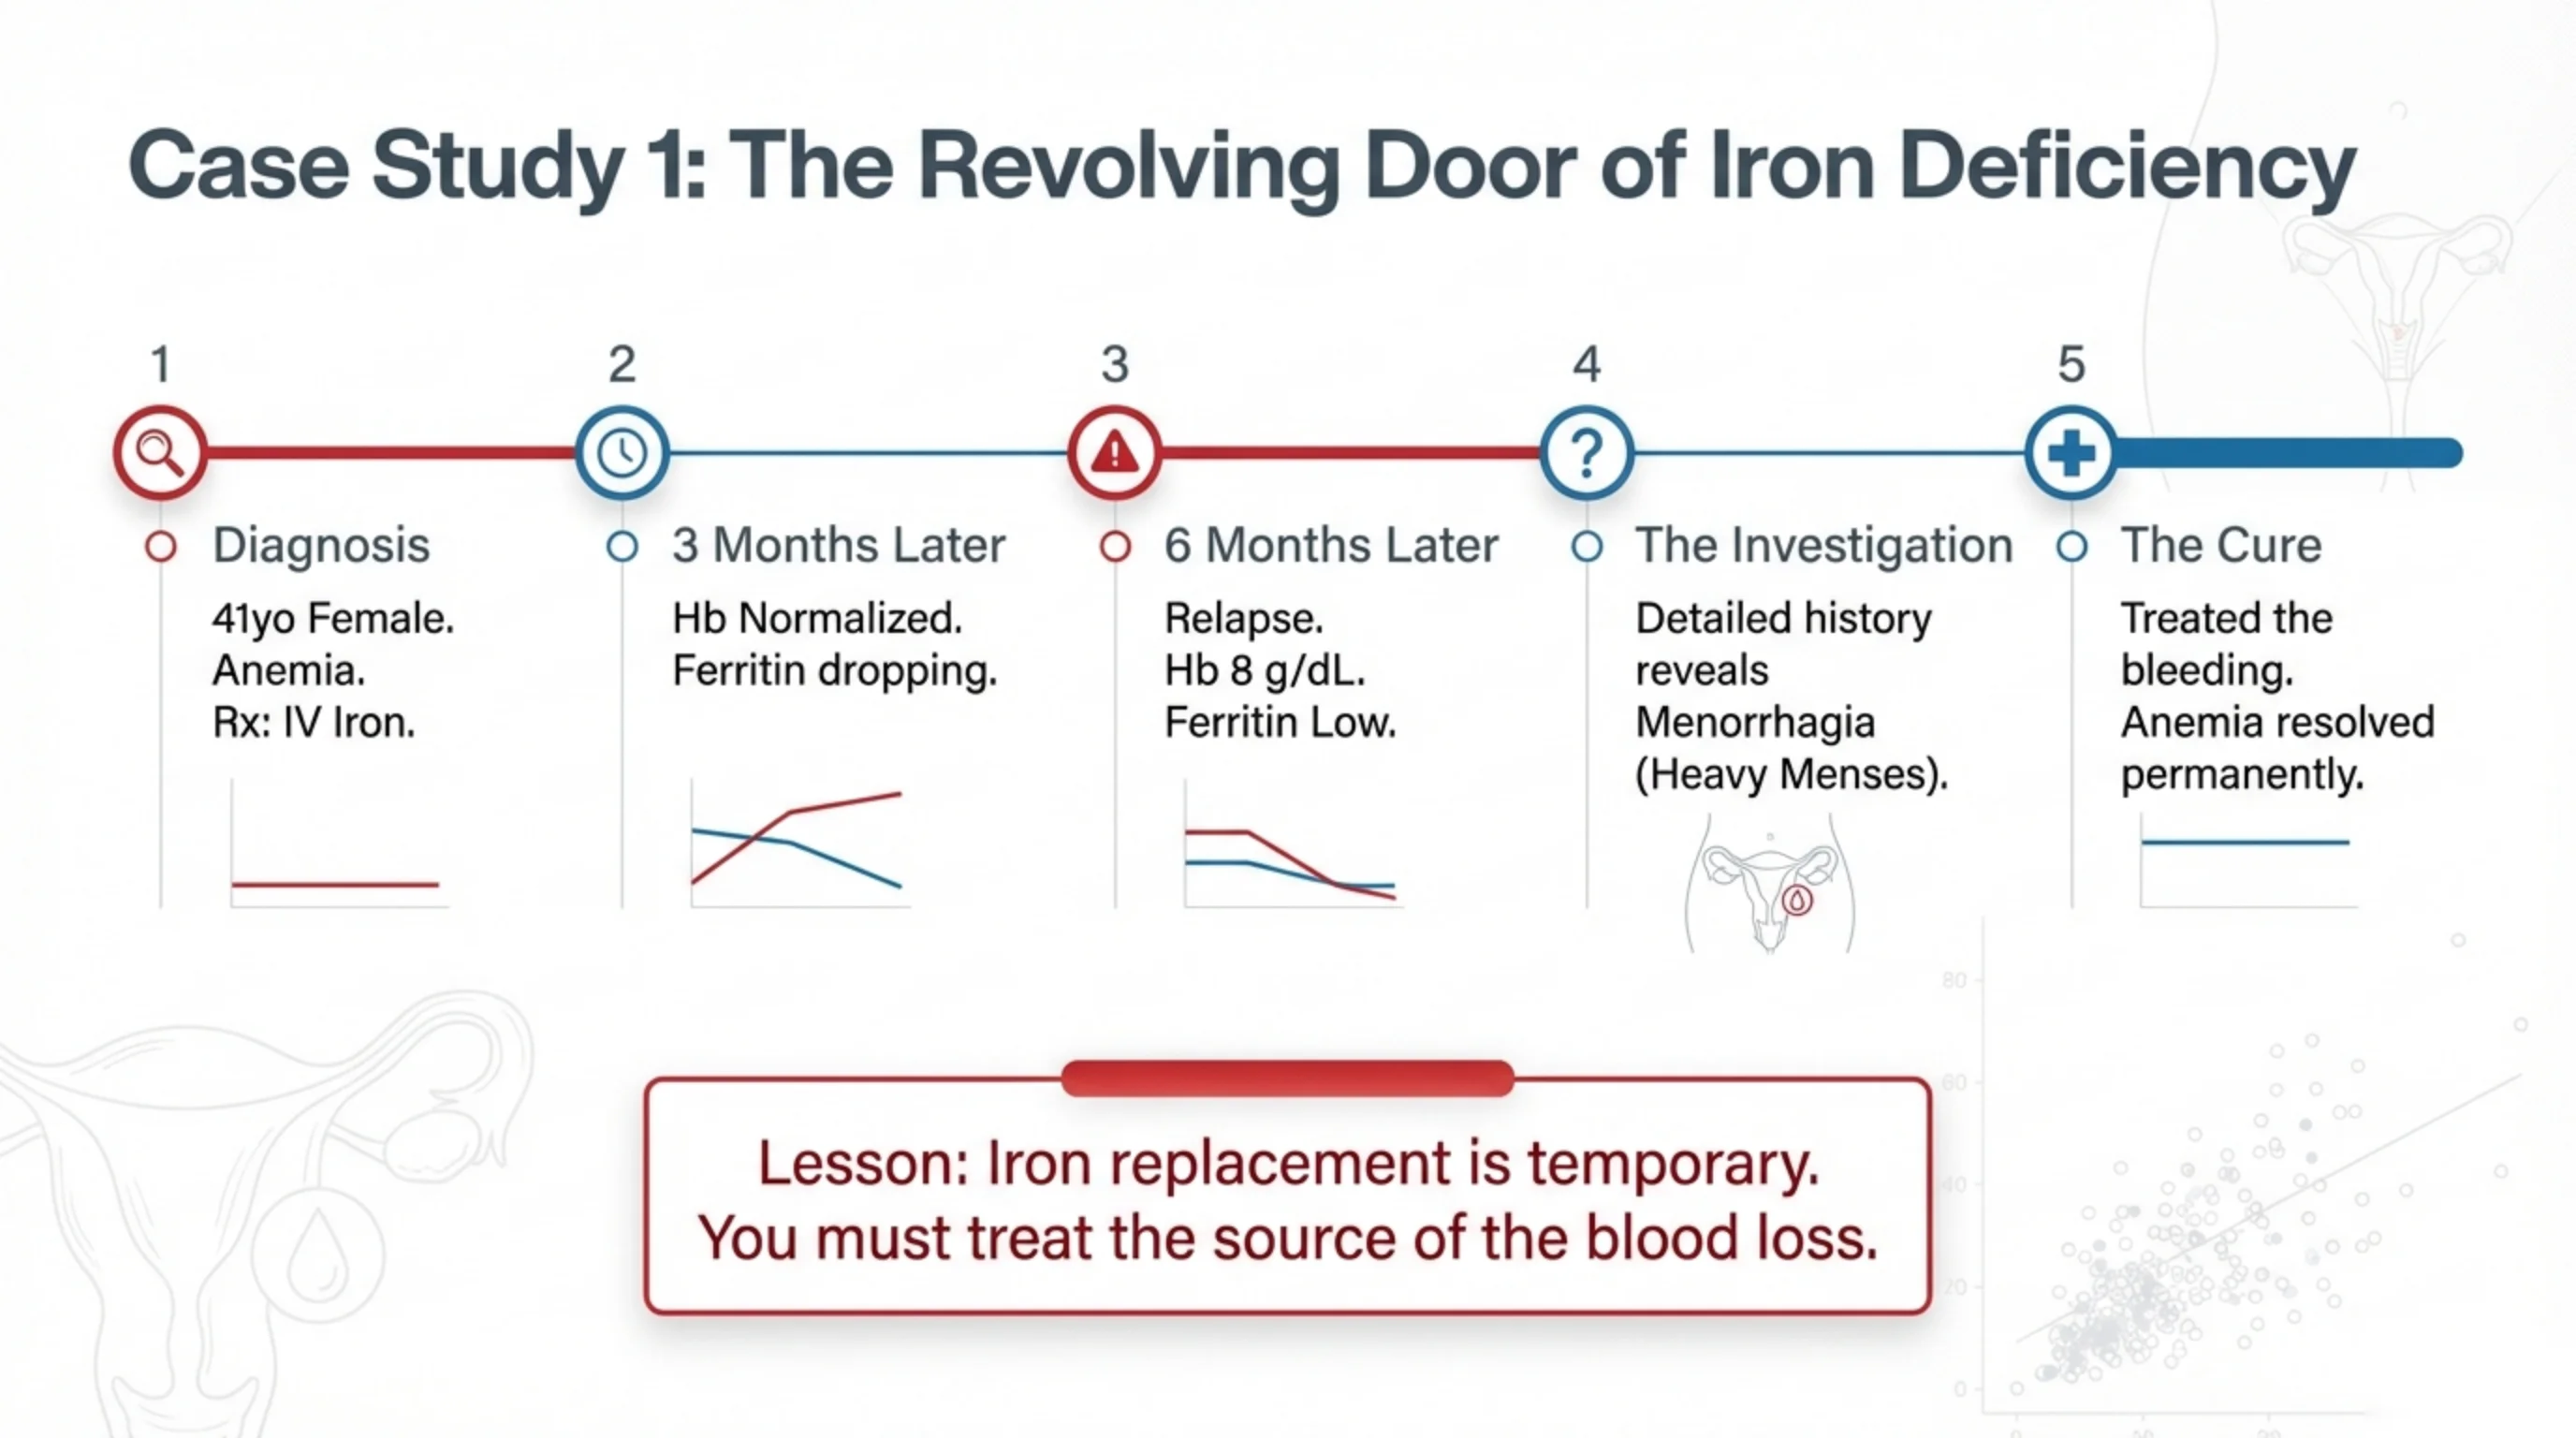
- Diagnosis: 41yo Female. Anemia. Rx: IV Iron.
- 3 Months Later: Hb Normalized. Ferritin dropping.
- 6 Months Later: Relapse. Hb 8 g/dL. Ferritin Low.
- The Investigation: Detailed history reveals Menorrhagia (Heavy Menses).
- The Cure: Treated the bleeding. Anemia resolved permanently.
Lesson: Iron replacement is temporary. You must treat the source of the blood loss.
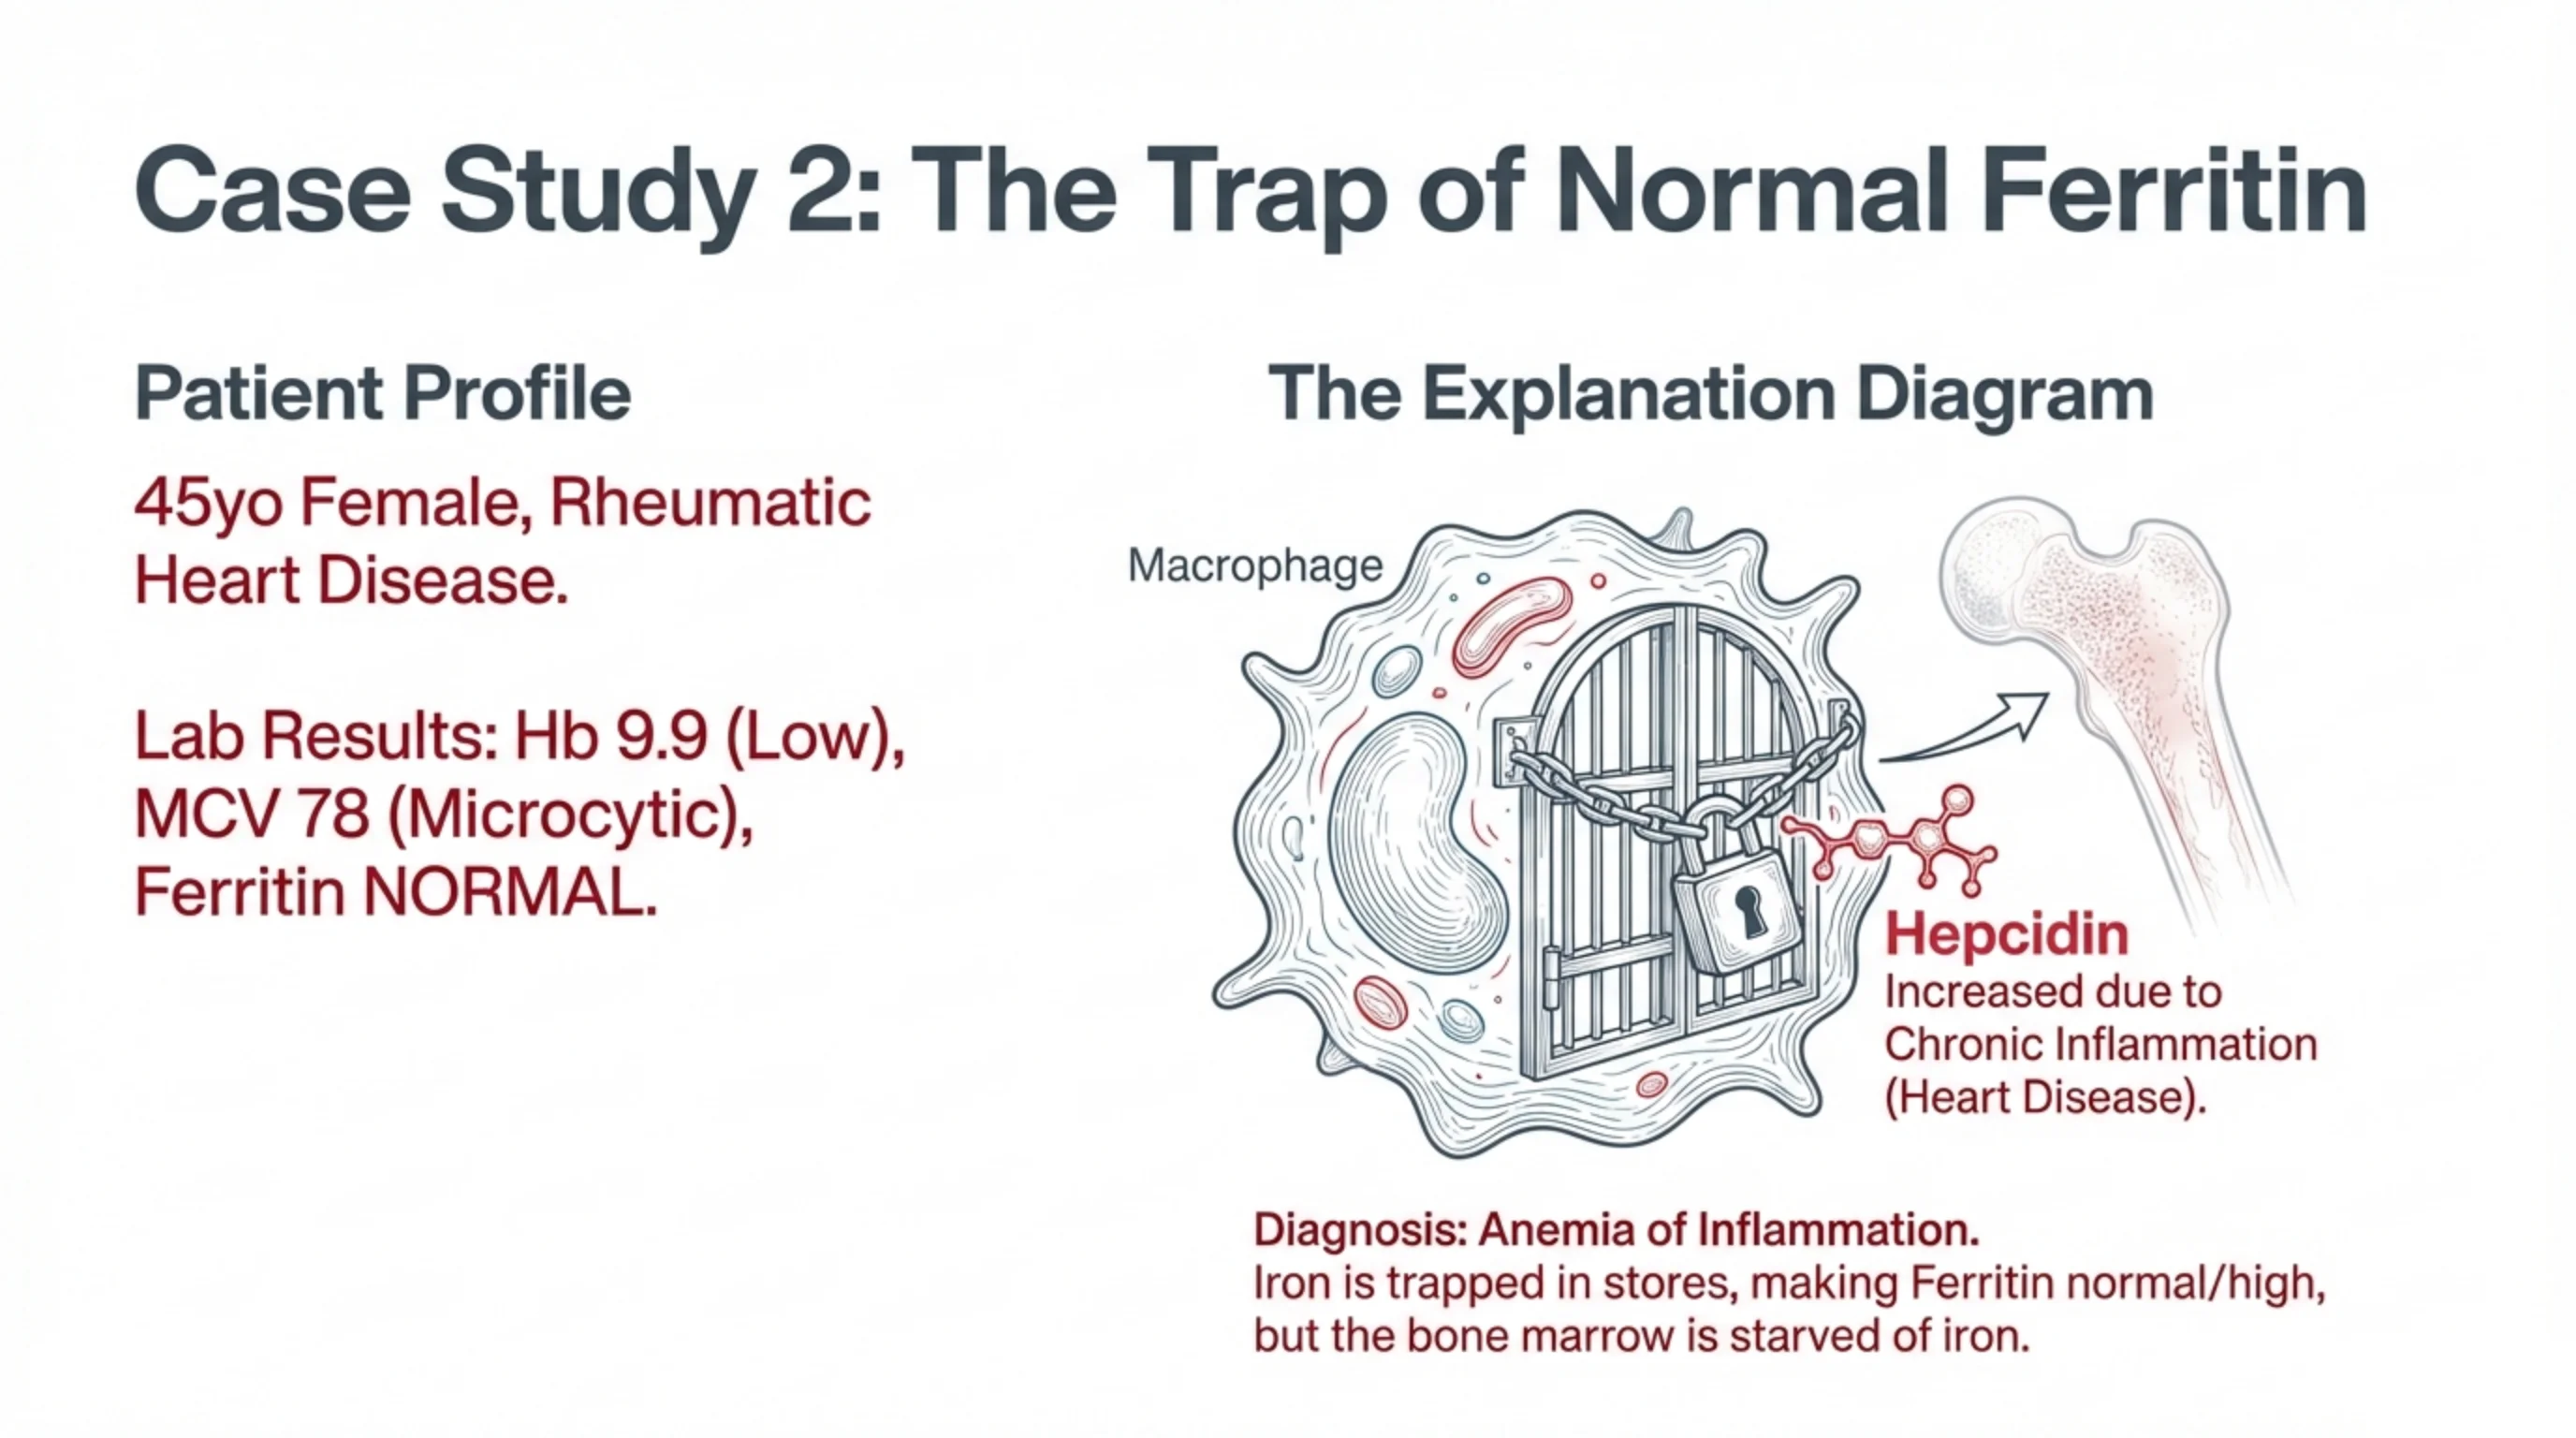
Patient Profile
45yo Female, Rheumatic Heart Disease.
Lab Results: Hb 9.9 (Low), MCV 78 (Microcytic), Ferritin NORMAL.
The Explanation Diagram
The Macrophage gate is locked by Hepcidin, which is Increased due to Chronic Inflammation (Heart Disease). Iron cannot reach the bone marrow.
Diagnosis: Anemia of Inflammation. Iron is trapped in stores, making Ferritin normal/high, but the bone marrow is starved of iron.
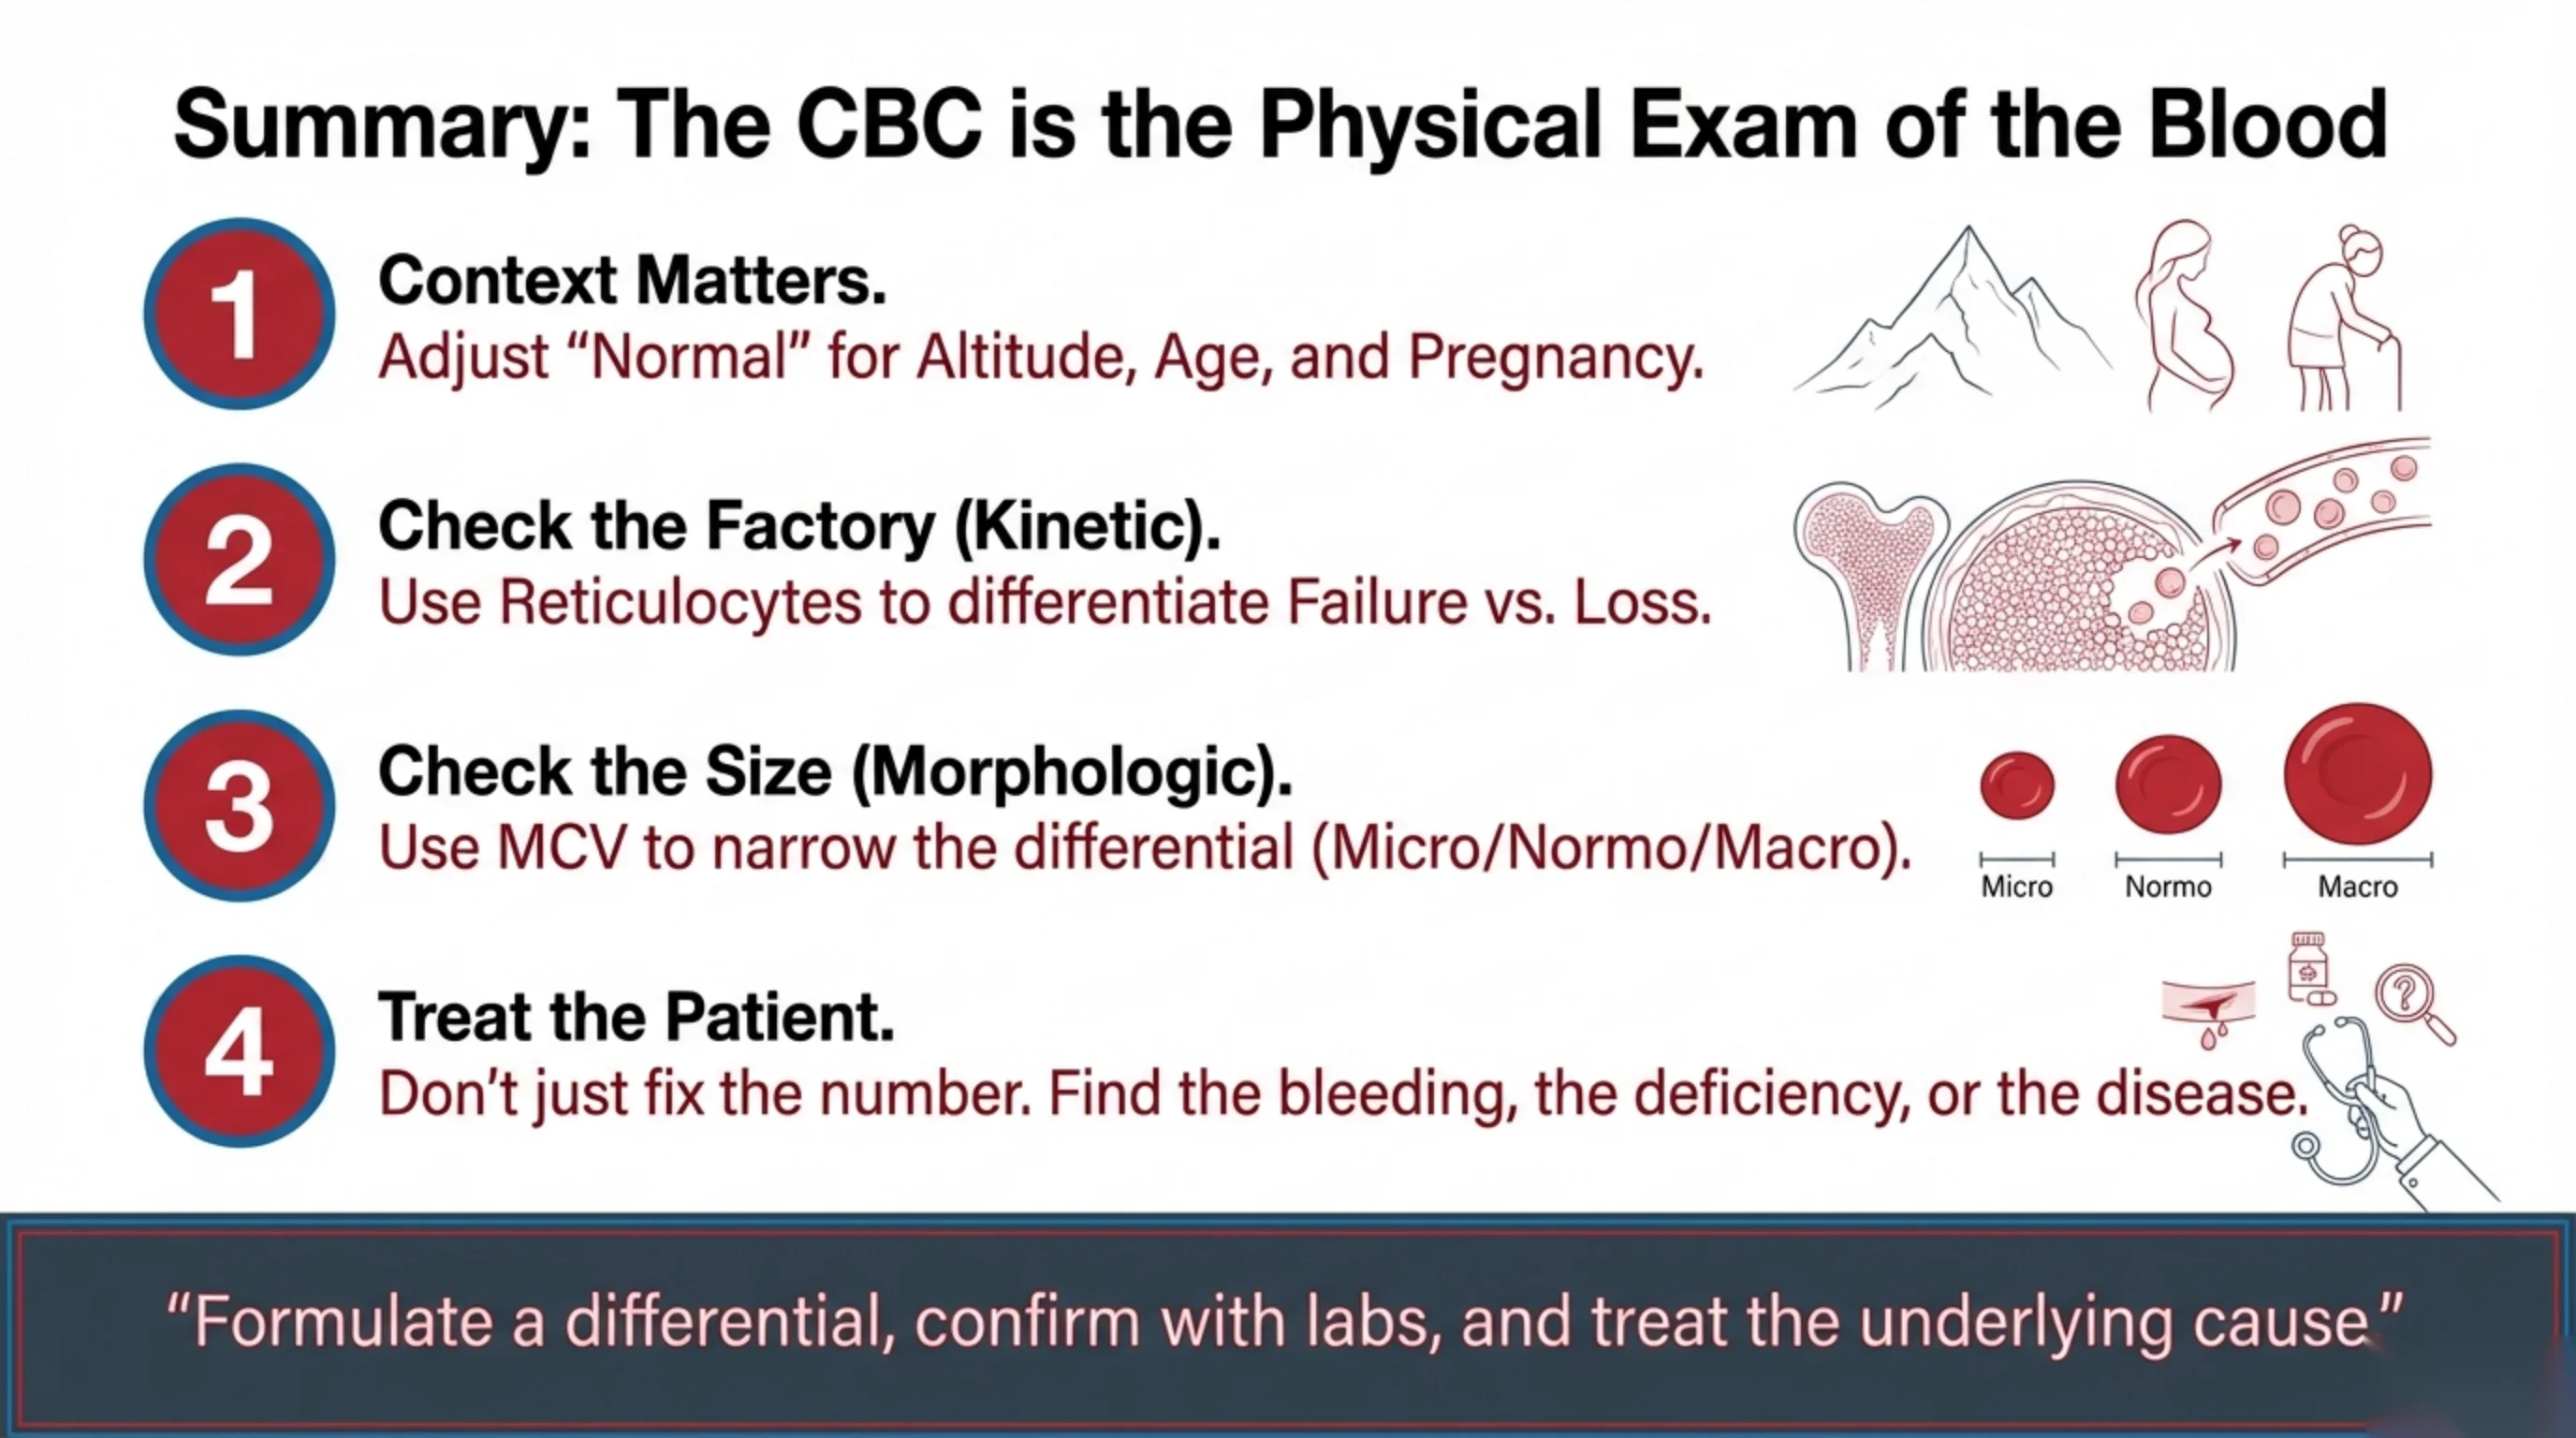
- Context Matters. Adjust “Normal” for Altitude, Age, and Pregnancy.
- Check the Factory (Kinetic). Use Reticulocytes to differentiate Failure vs. Loss.
- Check the Size (Morphologic). Use MCV to narrow the differential (Micro/Normo/Macro).
- Treat the Patient. Don’t just fix the number. Find the bleeding, the deficiency, or the disease.
“Formulate a differential, confirm with labs, and treat the underlying cause”
Acquired Hemolytic Anemia
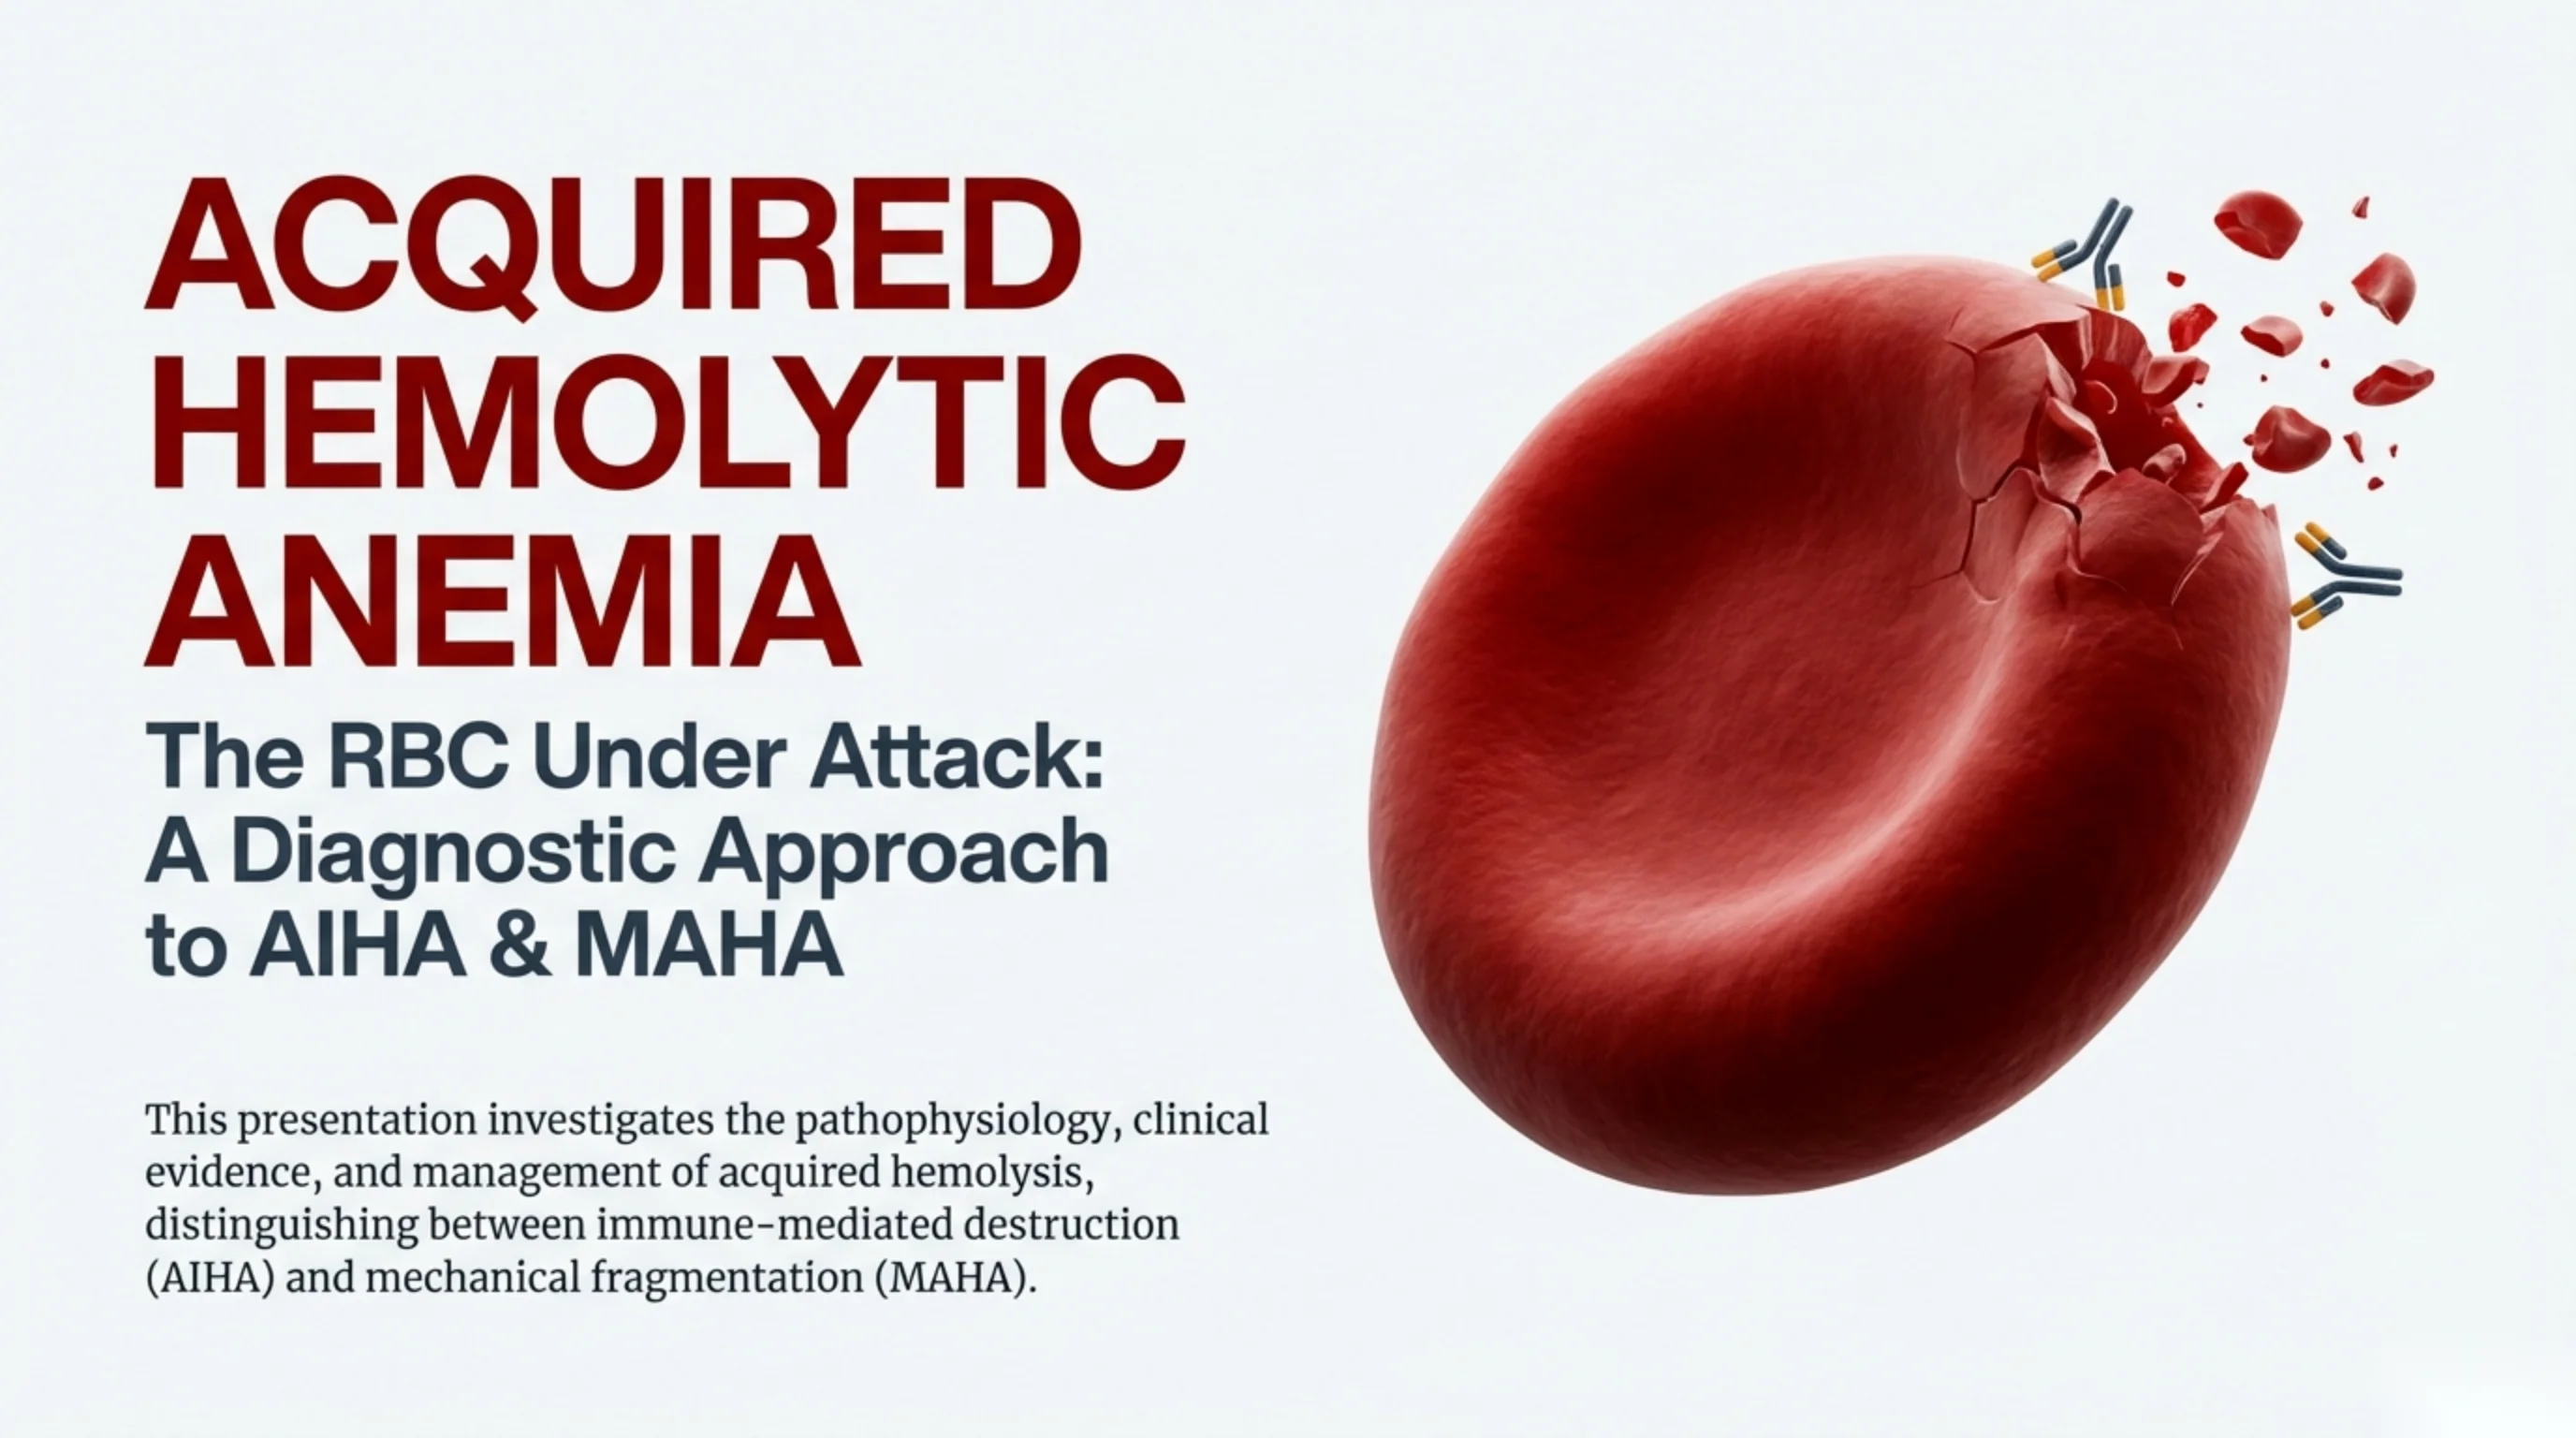
Acquired Hemolytic Anemia
The RBC Under Attack: A Diagnostic Approach to AIHA & MAHA
This presentation investigates the pathophysiology, clinical evidence, and management of acquired hemolysis, distinguishing between immune-mediated destruction (AIHA) and mechanical fragmentation (MAHA).
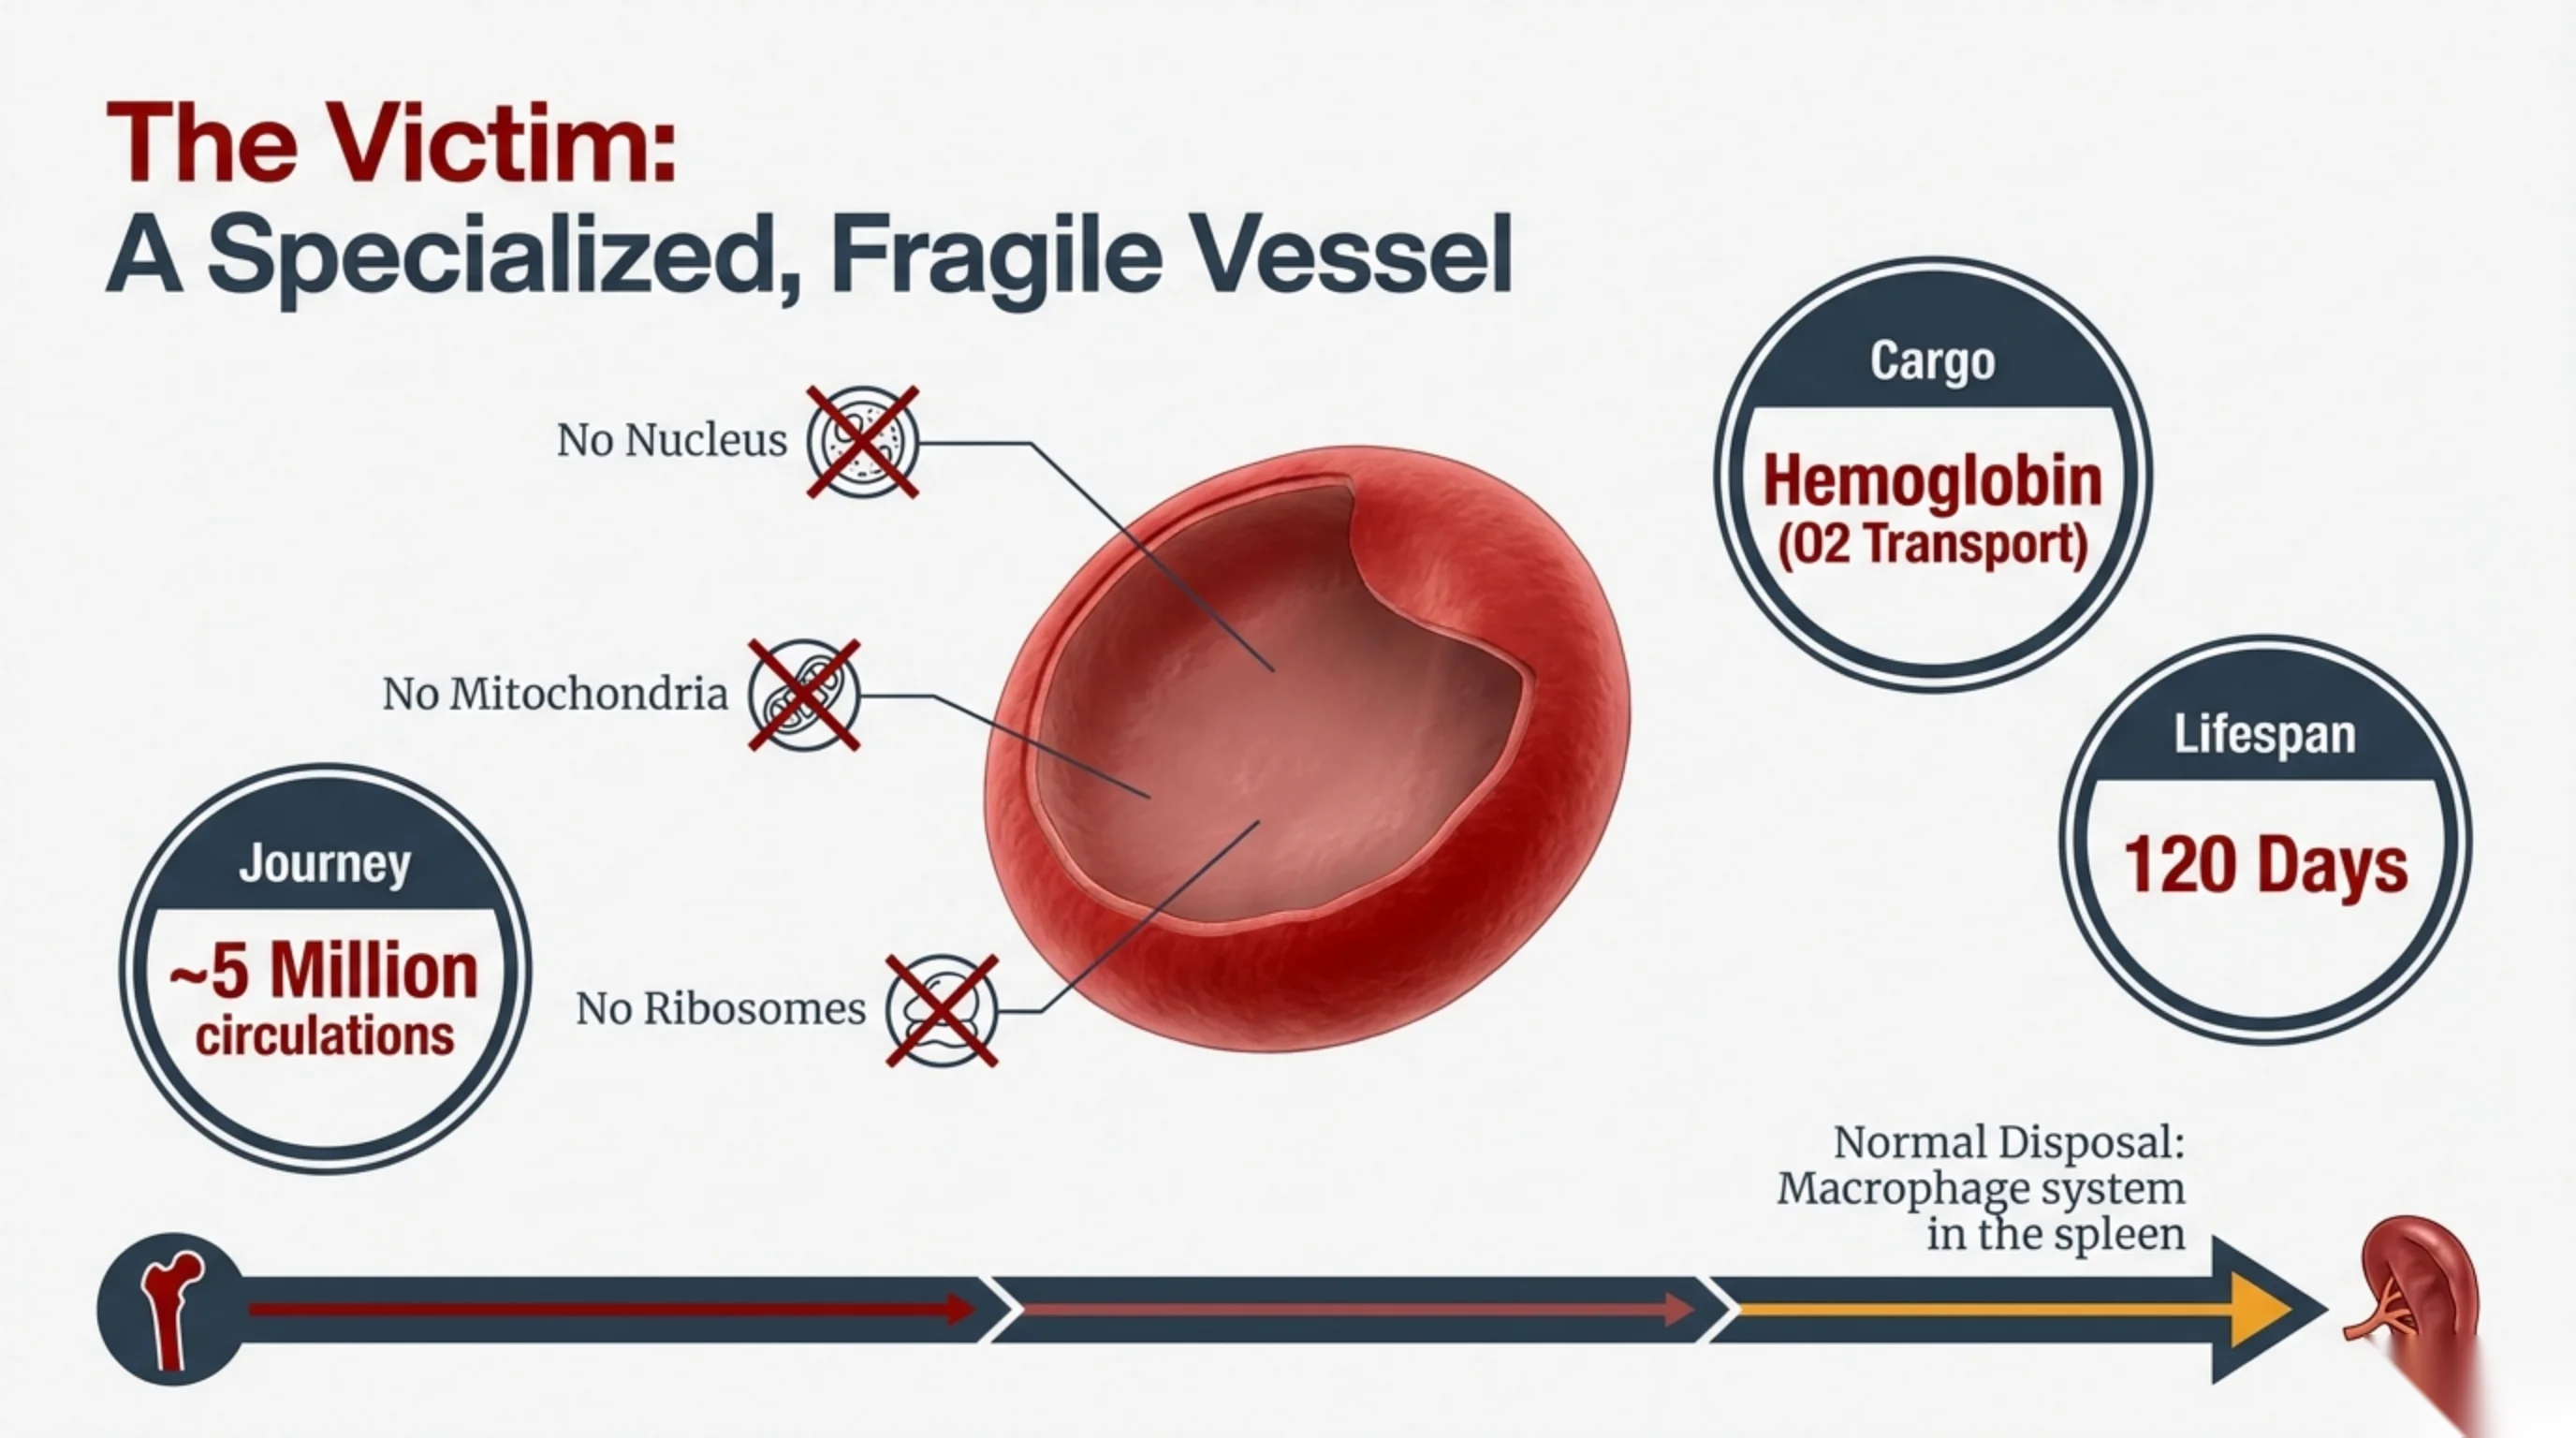
The Victim: A Specialized, Fragile Vessel
Features of the red blood cell:
- No Nucleus
- No Mitochondria
- No Ribosomes
- Journey: ~5 Million circulations
- Cargo: Hemoglobin (O2 Transport)
- Lifespan: 120 Days
Normal Disposal: Macrophage system in the spleen.
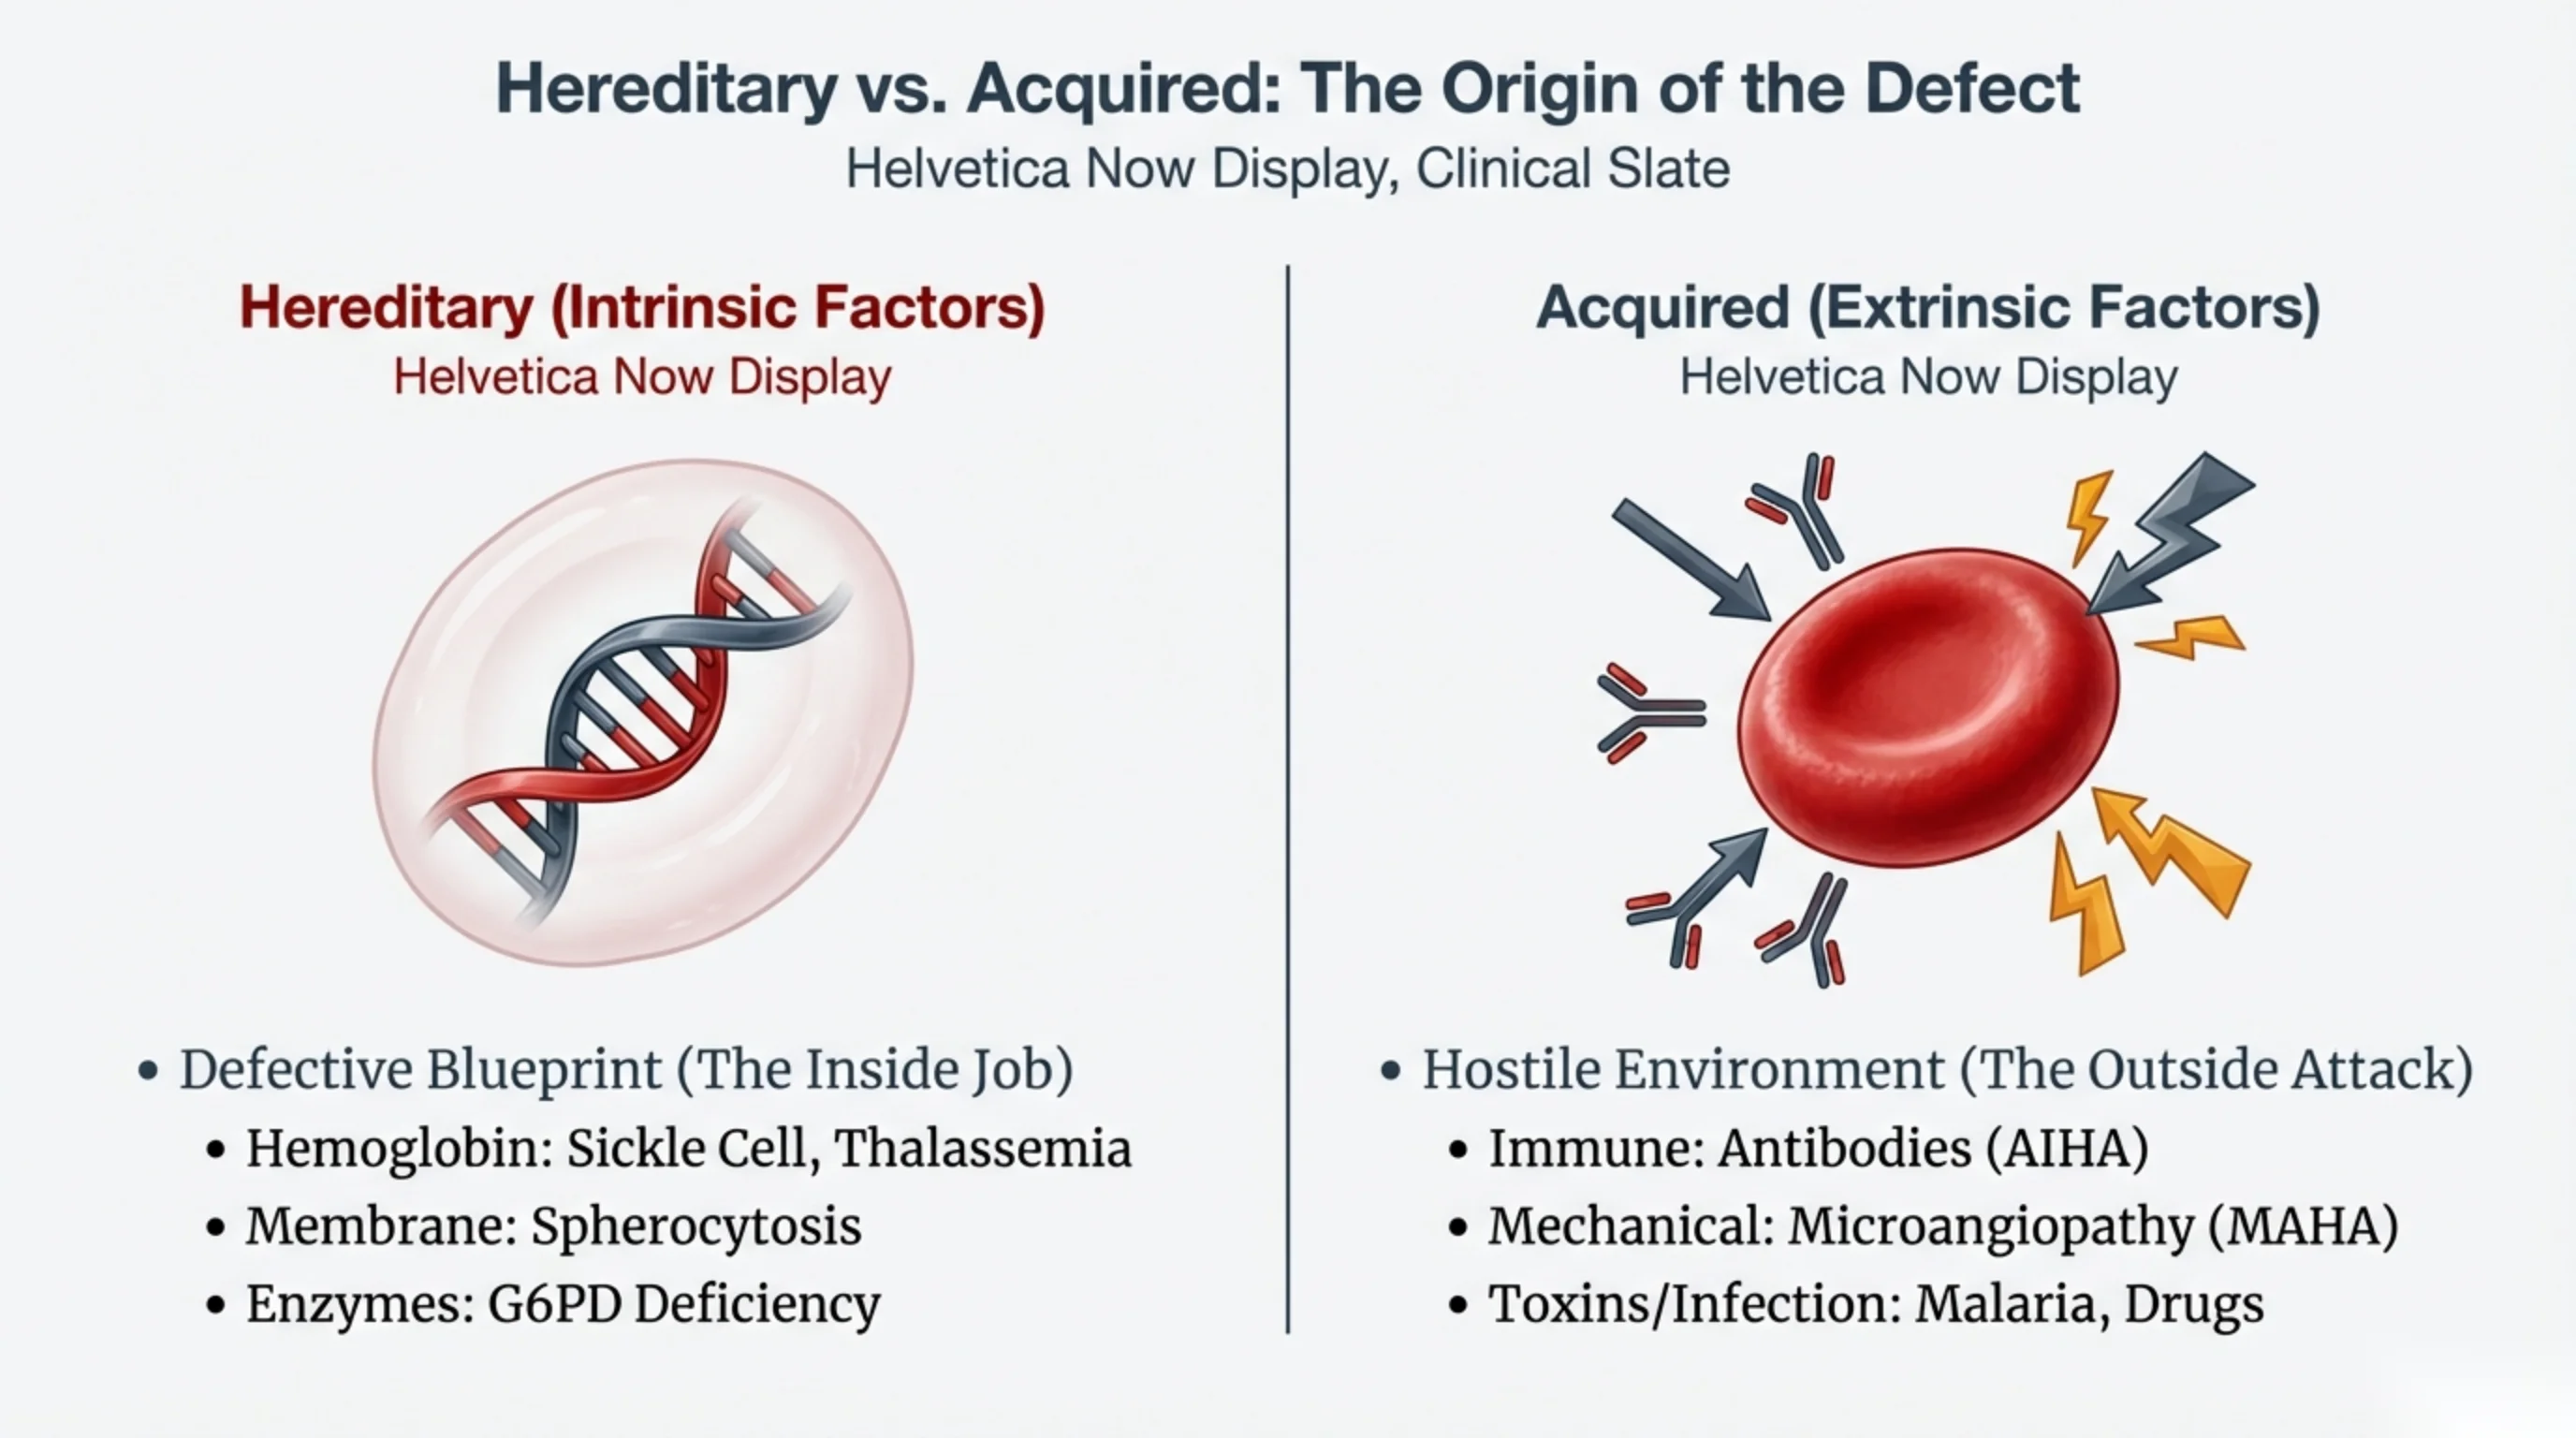
Hereditary vs. Acquired: The Origin of the Defect
| Hereditary (Intrinsic Factors) | Acquired (Extrinsic Factors) |
|---|---|
|
Defective Blueprint (The Inside Job)
|
Hostile Environment (The Outside Attack)
|
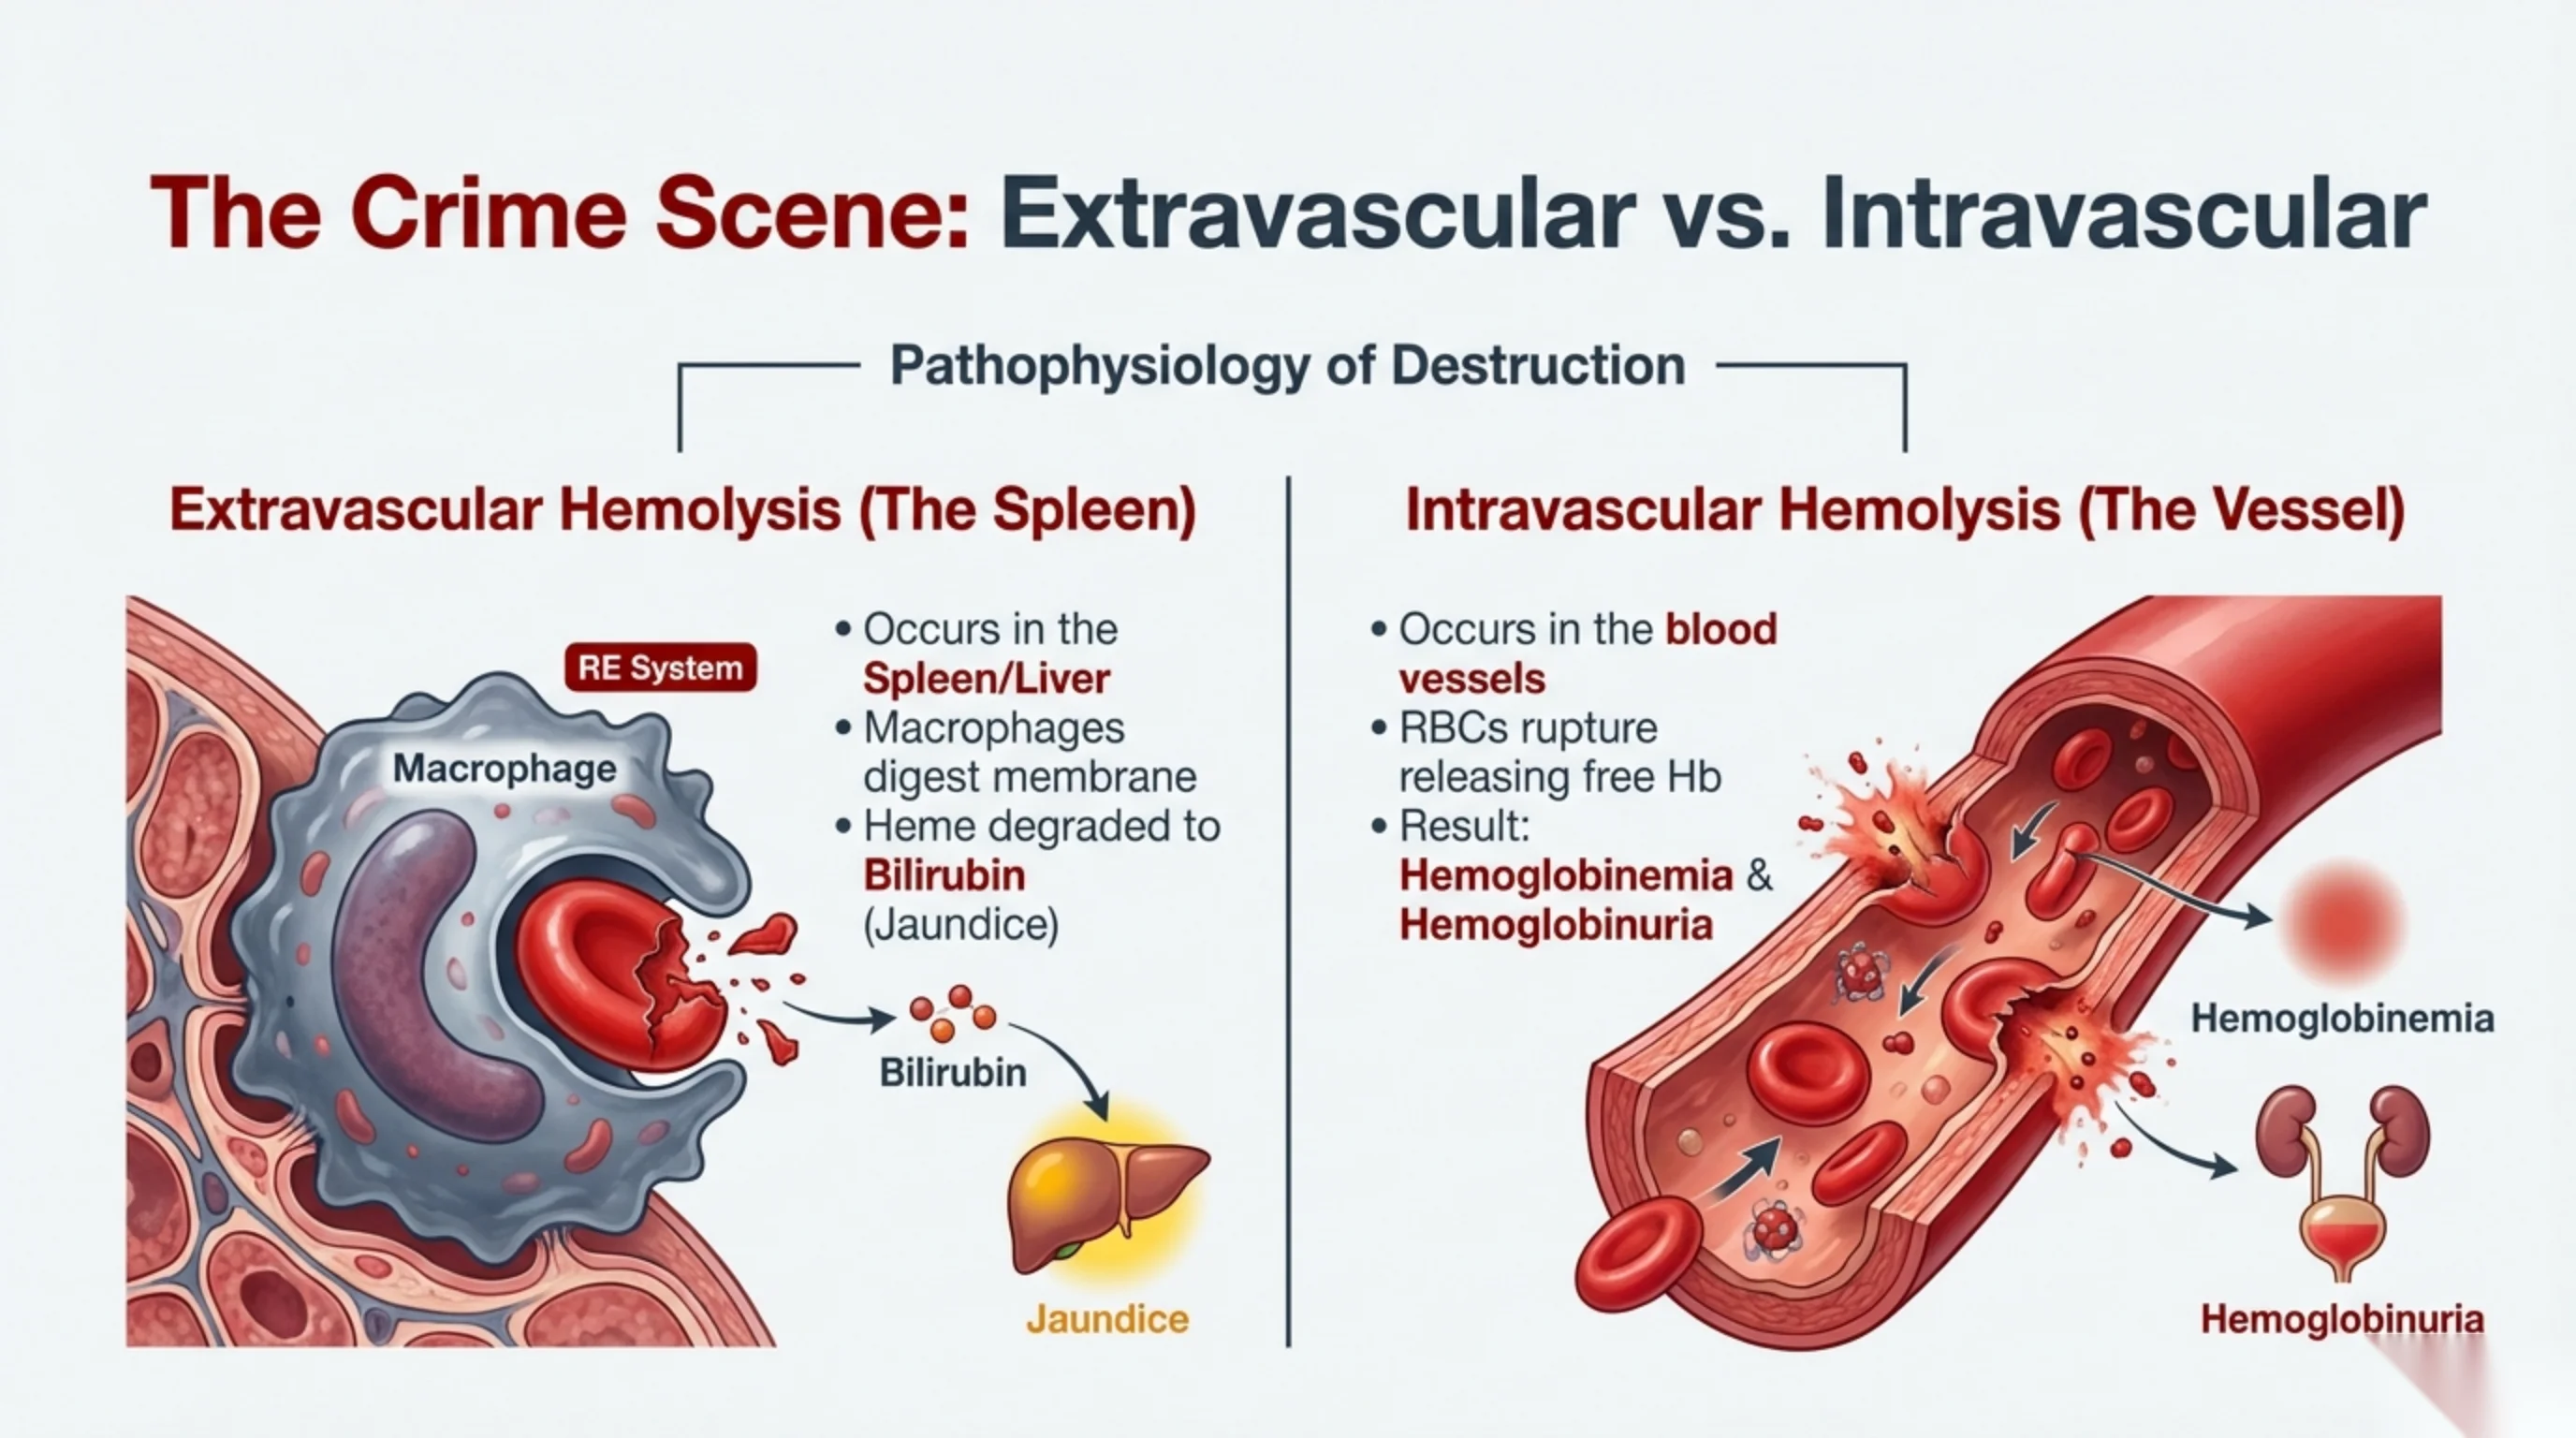
The Crime Scene: Extravascular vs. Intravascular
Pathophysiology of Destruction
Extravascular Hemolysis (The Spleen)
- Occurs in the Spleen/Liver (RE System, via Macrophage)
- Macrophages digest membrane
- Heme degraded to Bilirubin (Jaundice)
Intravascular Hemolysis (The Vessel)
- Occurs in the blood vessels
- RBCs rupture releasing free Hb
- Result: Hemoglobinemia & Hemoglobinuria
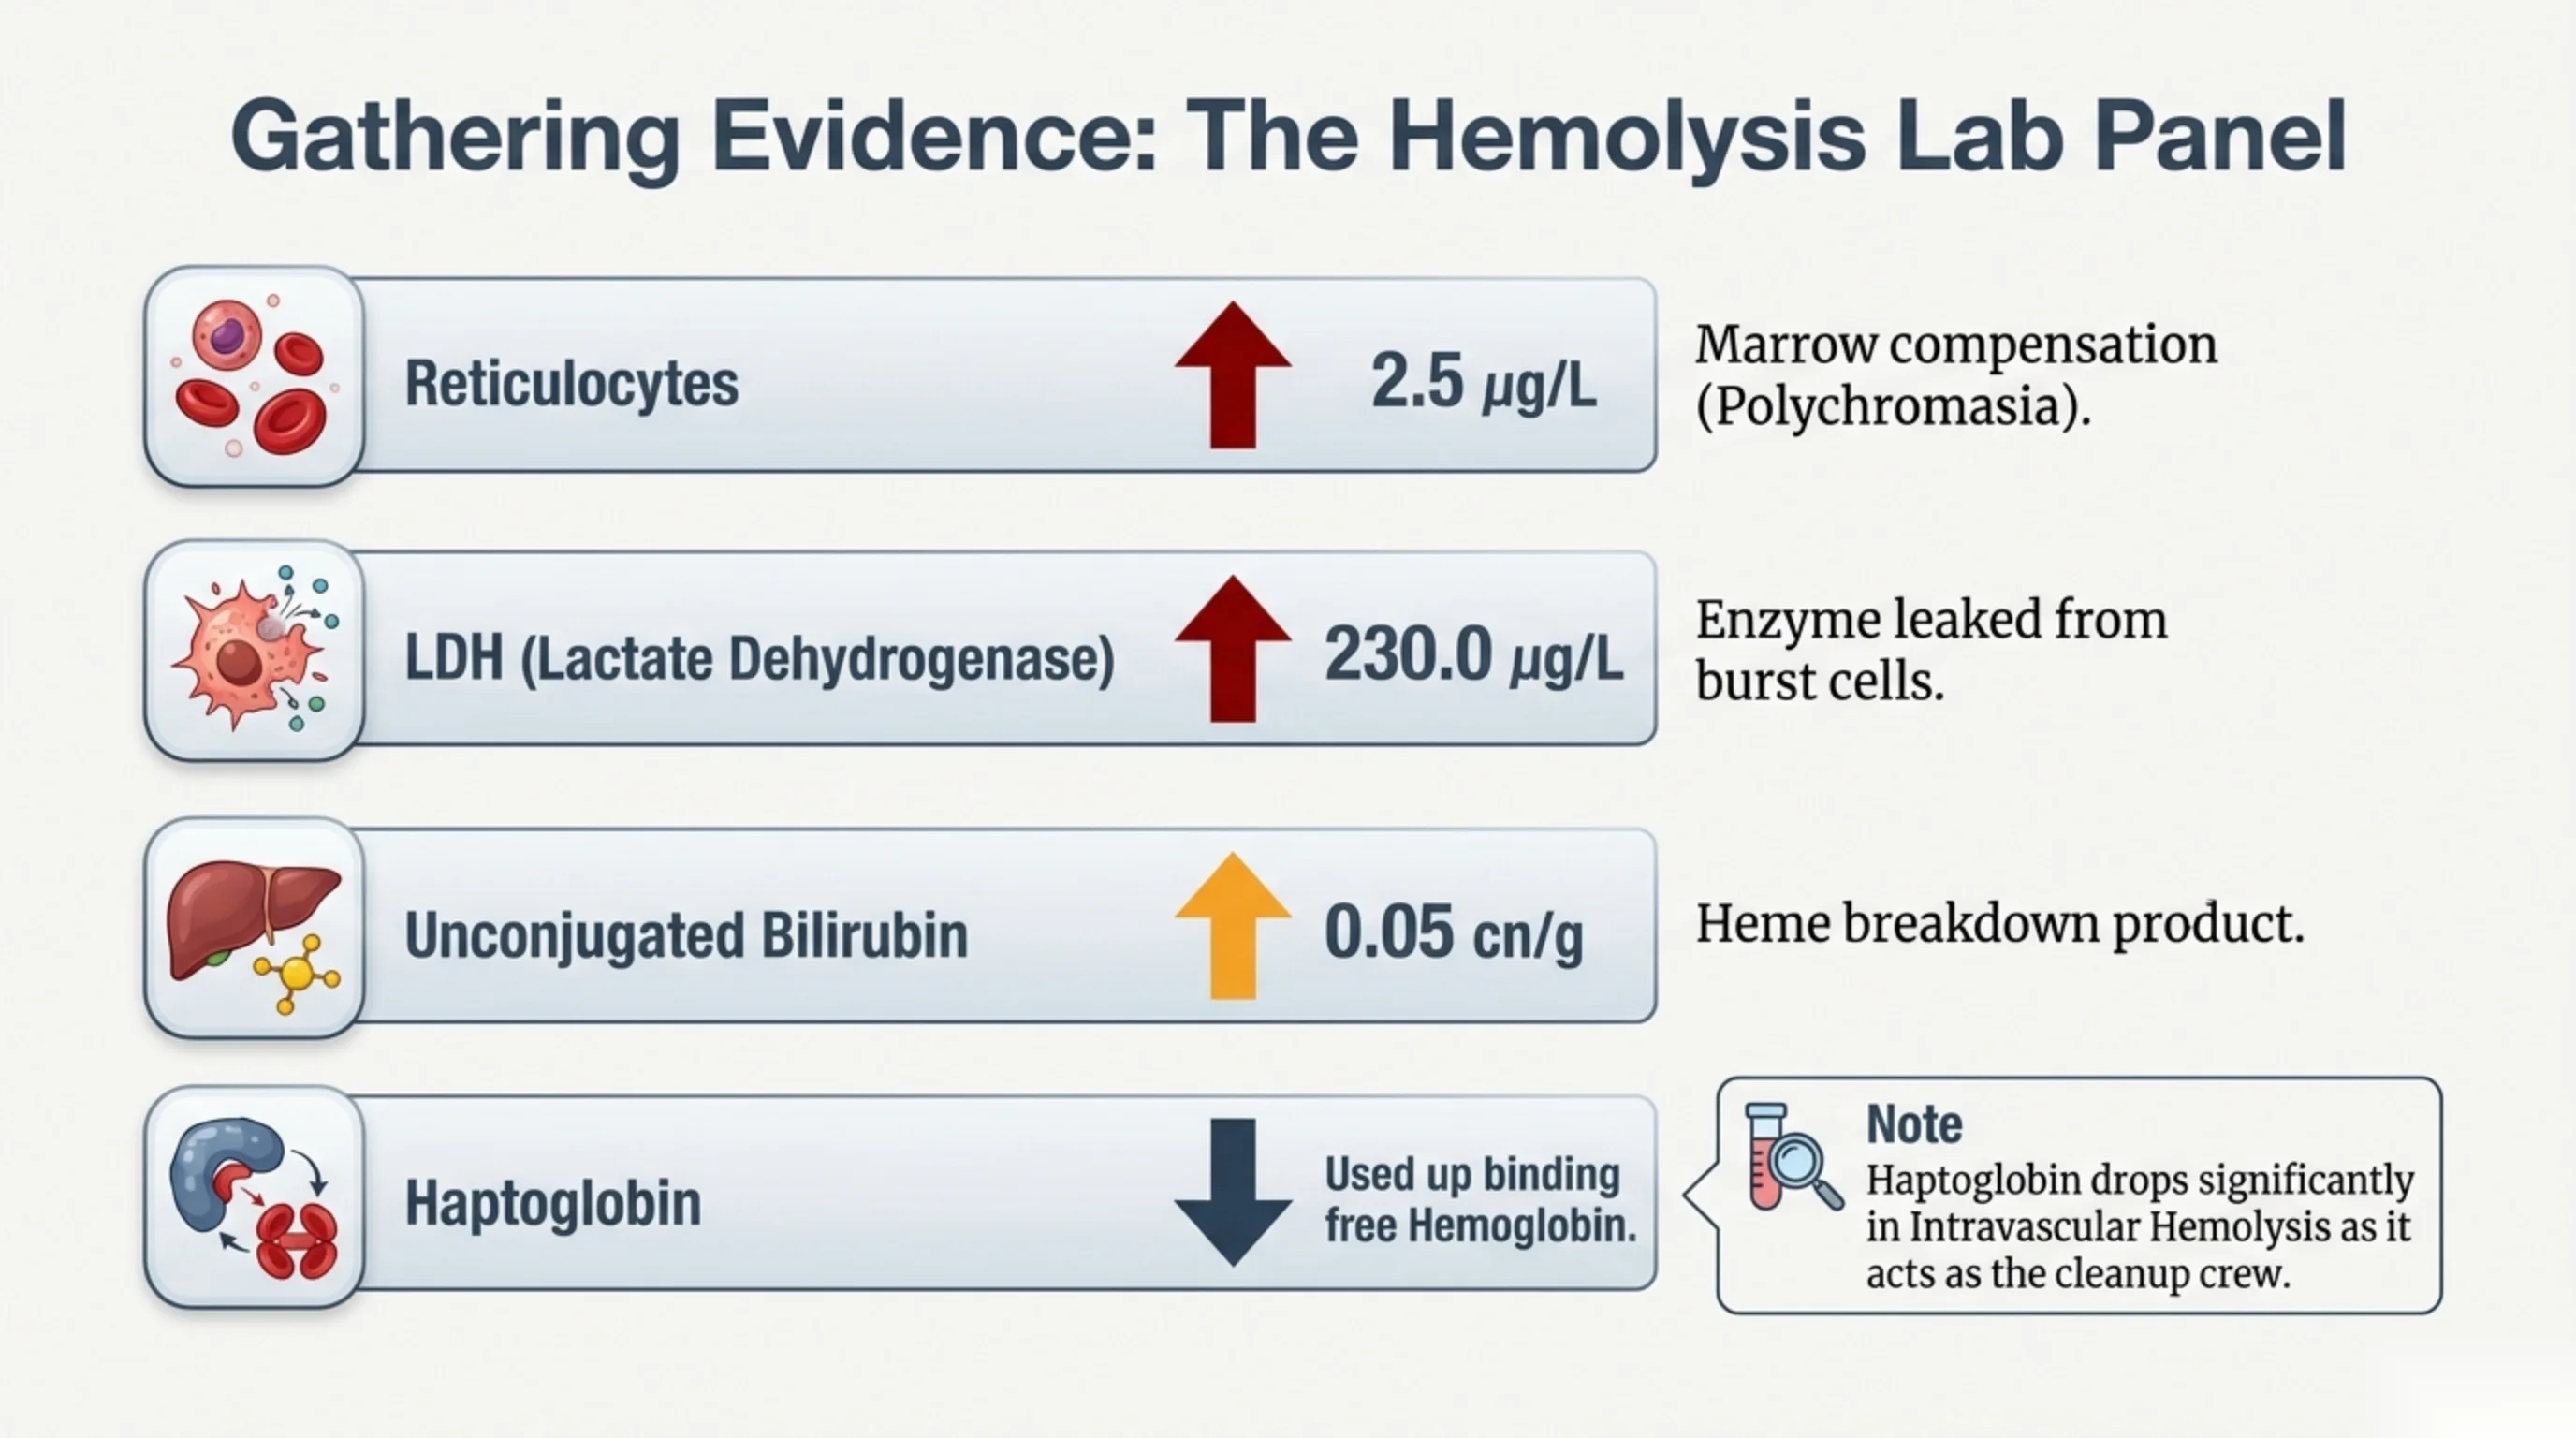
Gathering Evidence: The Hemolysis Lab Panel
| Marker | Change | Value | Meaning |
|---|---|---|---|
| Reticulocytes | Increased | 2.5 µg/L | Marrow compensation (Polychromasia). |
| LDH (Lactate Dehydrogenase) | Increased | 230.0 µg/L | Enzyme leaked from burst cells. |
| Unconjugated Bilirubin | Increased | 0.05 cn/g | Heme breakdown product. |
| Haptoglobin | Decreased | Used up binding free Hemoglobin. | — |
Note: Haptoglobin drops significantly in Intravascular Hemolysis as it acts as the cleanup crew.
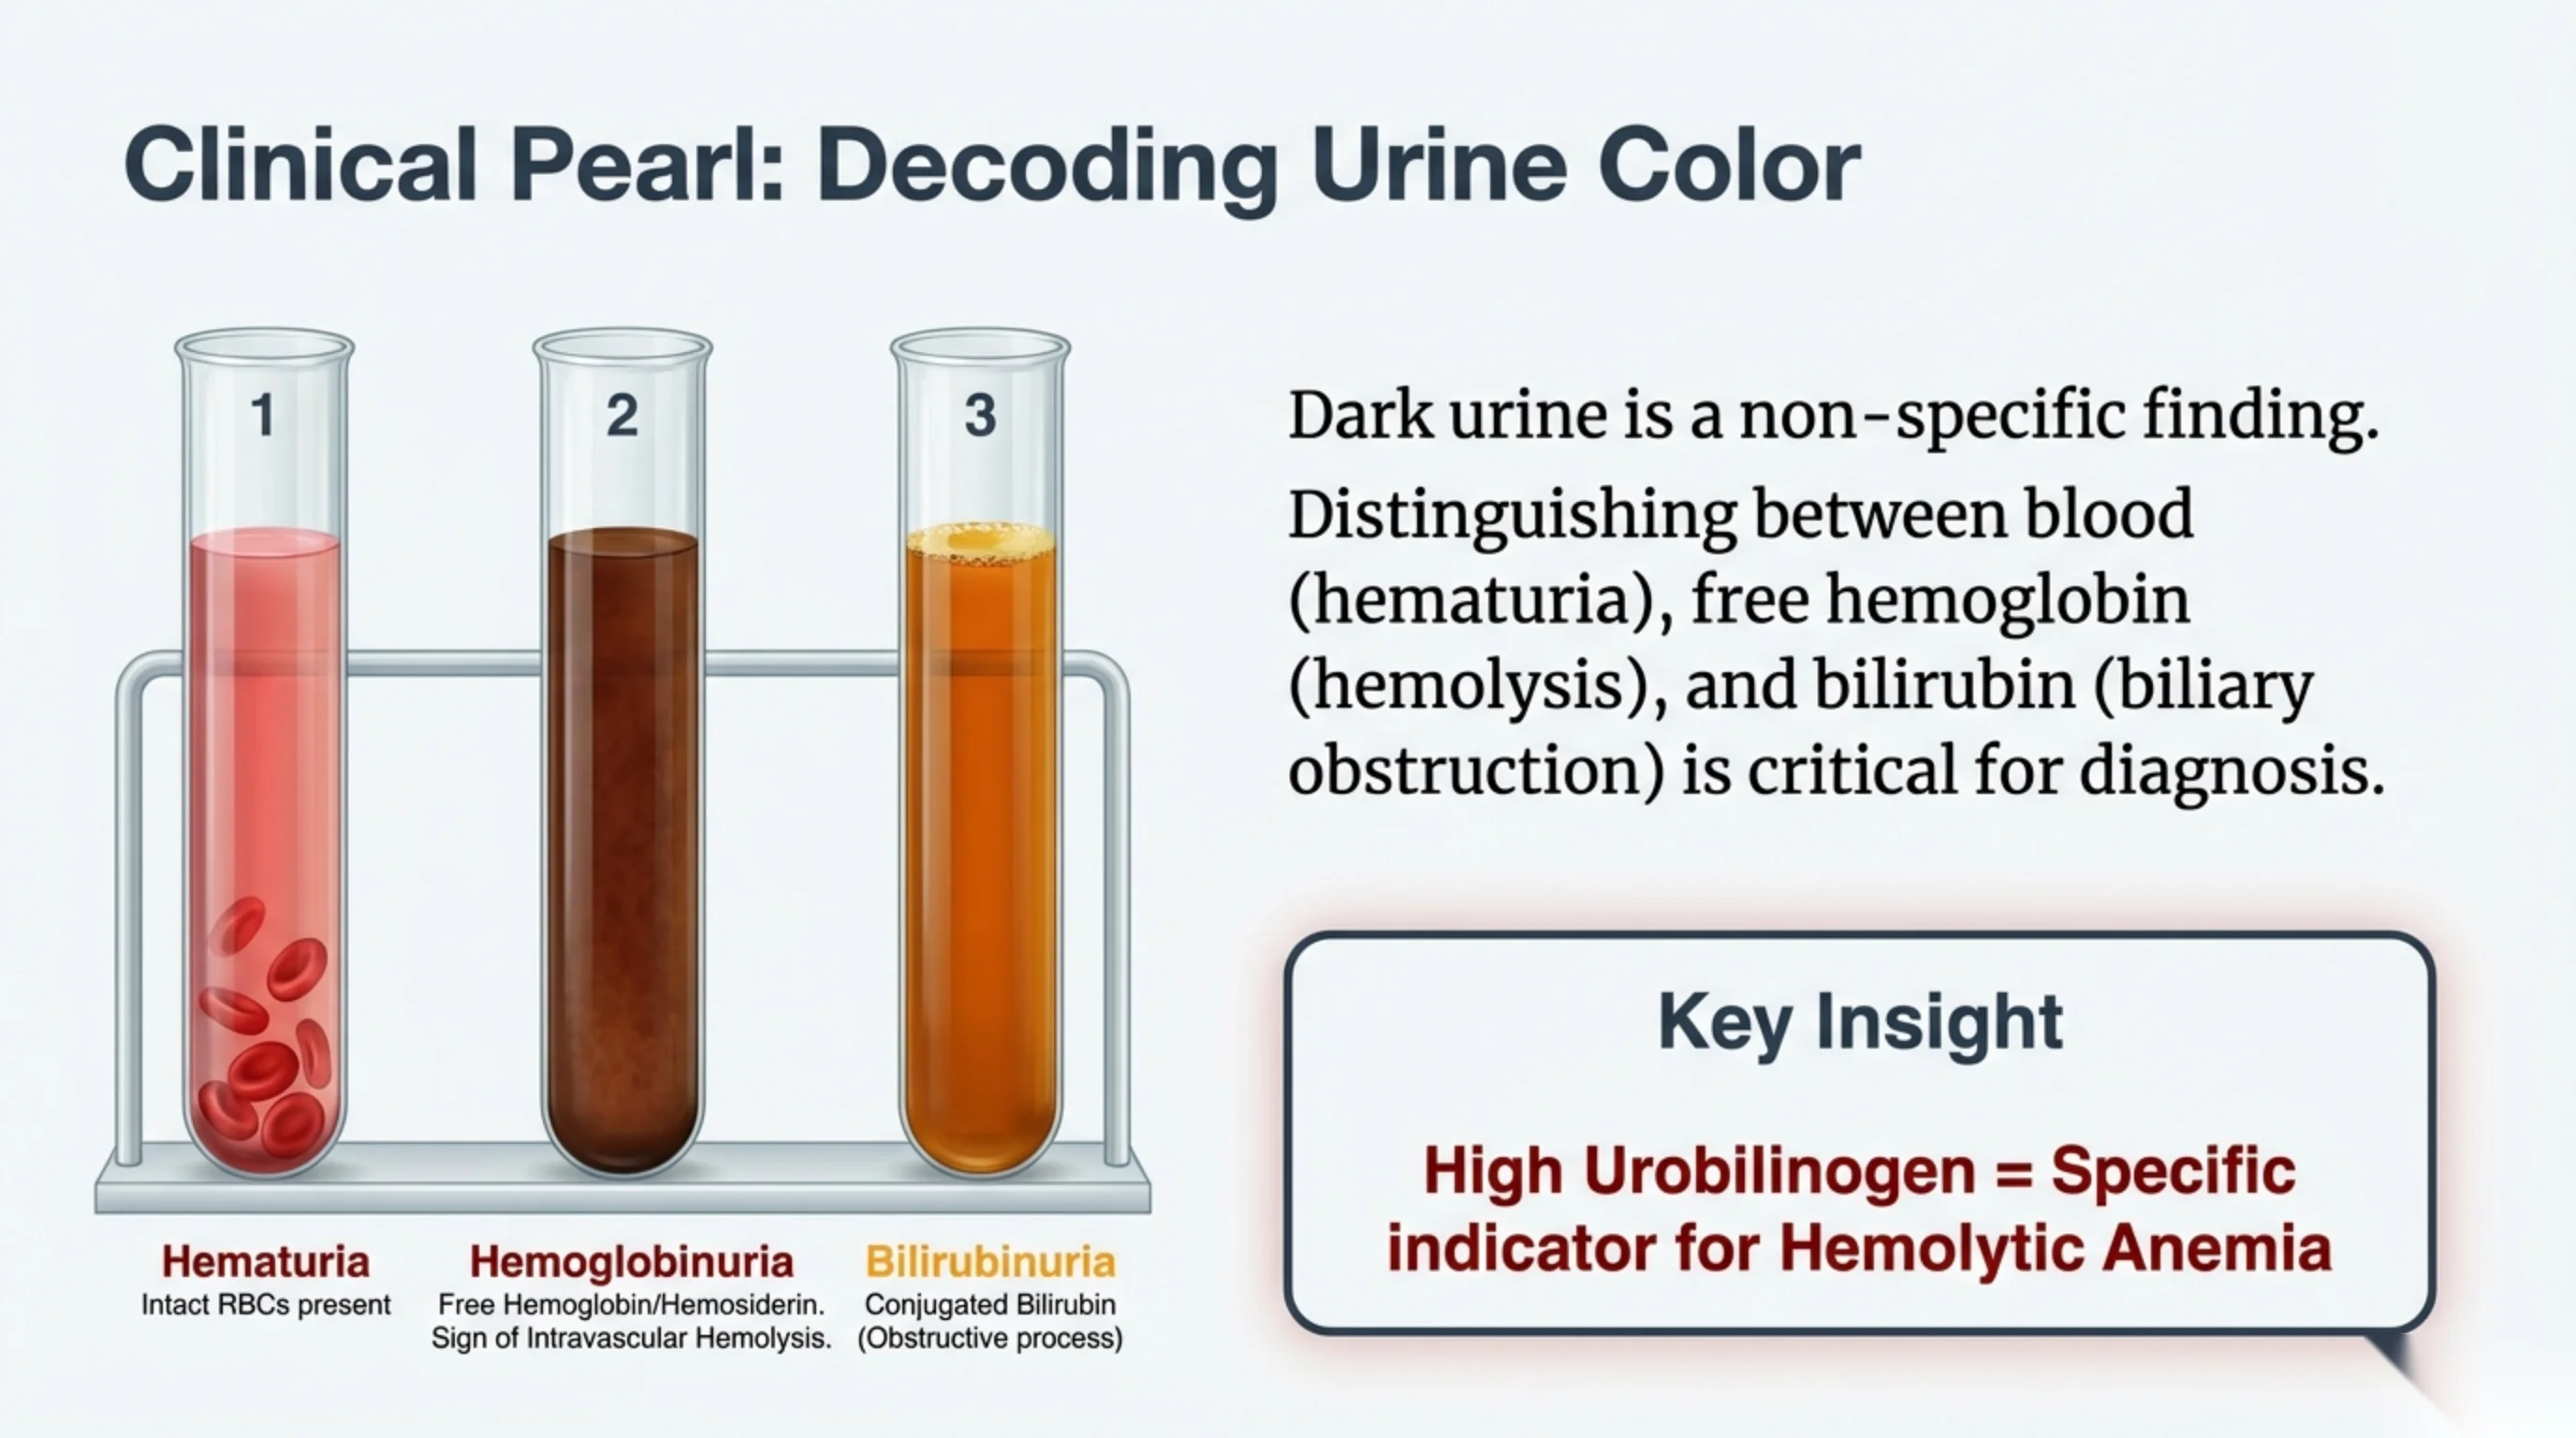
Clinical Pearl: Decoding Urine Color
Dark urine is a non-specific finding. Distinguishing between blood (hematuria), free hemoglobin (hemolysis), and bilirubin (biliary obstruction) is critical for diagnosis.
- 1. Hematuria: Intact RBCs present
- 2. Hemoglobinuria: Free Hemoglobin/Hemosiderin. Sign of Intravascular Hemolysis.
- 3. Bilirubinuria: Conjugated Bilirubin (Obstructive process)
Key Insight: High Urobilinogen = Specific indicator for Hemolytic Anemia
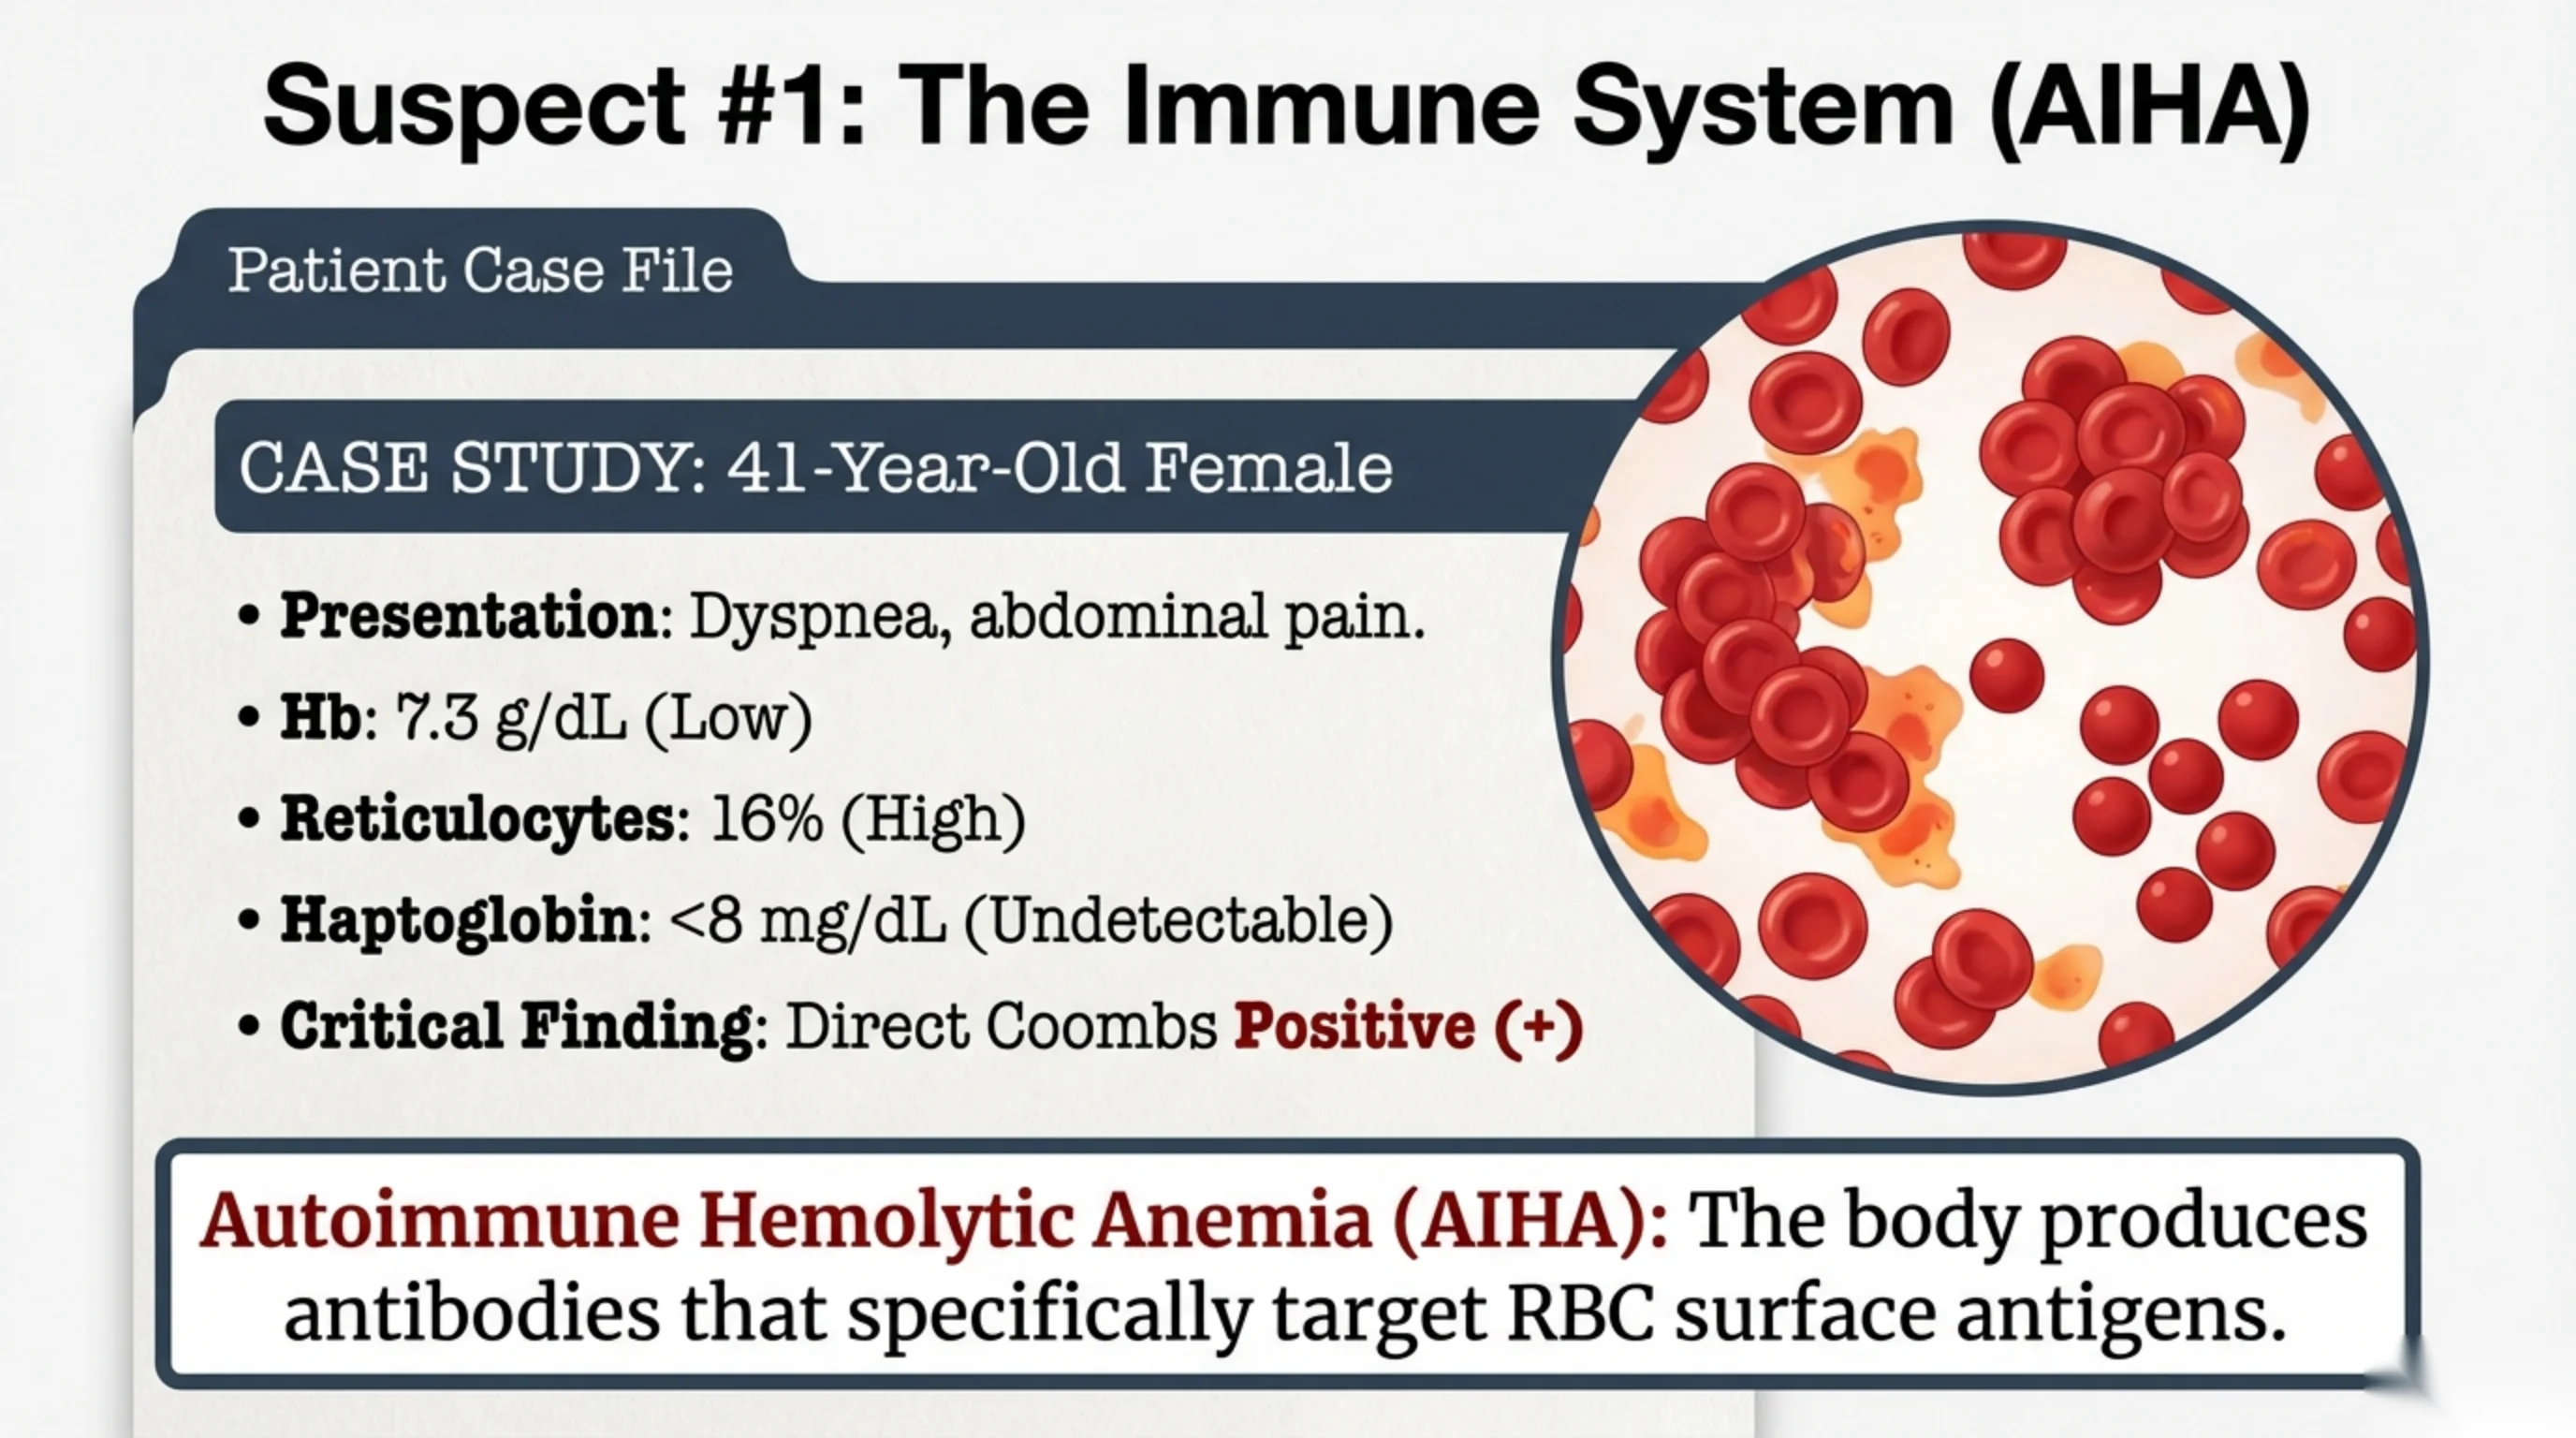
Suspect #1: The Immune System (AIHA)
Patient Case File
CASE STUDY: 41-Year-Old Female
- Presentation: Dyspnea, abdominal pain.
- Hb: 7.3 g/dL (Low)
- Reticulocytes: 16% (High)
- Haptoglobin: <8 mg/dL (Undetectable)
- Critical Finding: Direct Coombs Positive (+)
Autoimmune Hemolytic Anemia (AIHA): The body produces antibodies that specifically target RBC surface antigens.
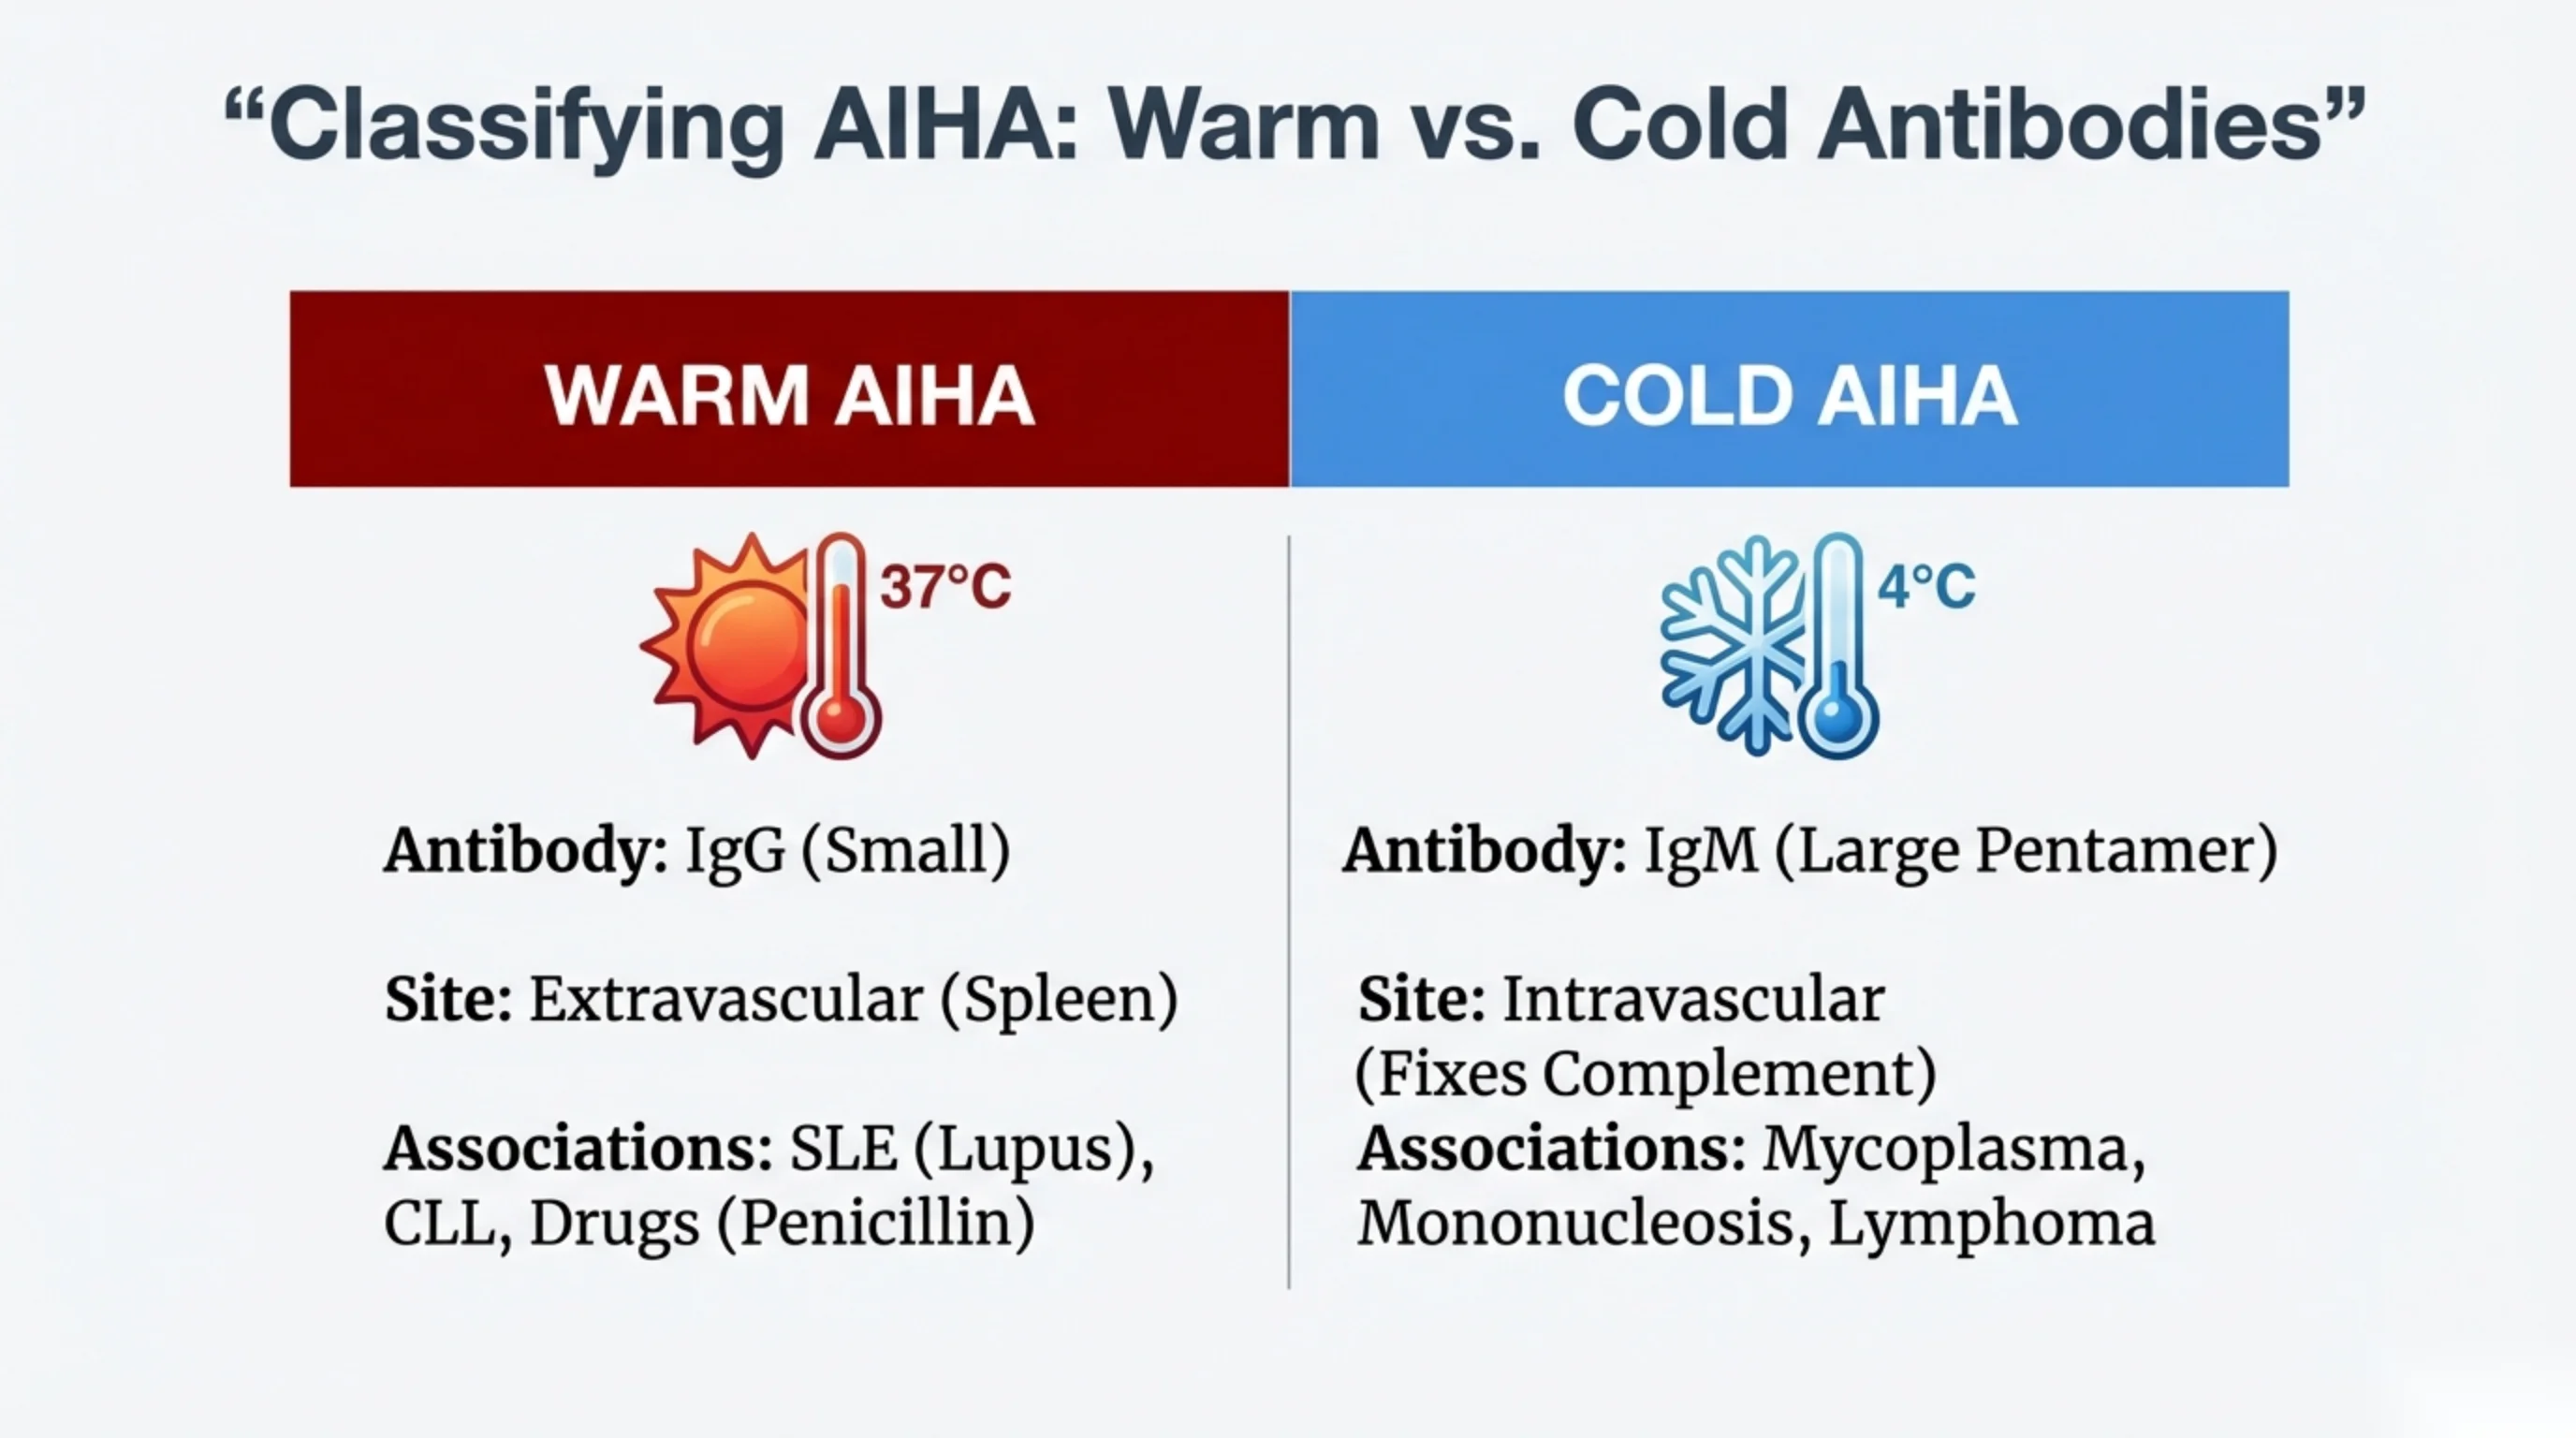
“Classifying AIHA: Warm vs. Cold Antibodies”
| WARM AIHA (37°C) | COLD AIHA (4°C) |
|---|---|
| Antibody: IgG (Small) | Antibody: IgM (Large Pentamer) |
| Site: Extravascular (Spleen) | Site: Intravascular (Fixes Complement) |
| Associations: SLE (Lupus), CLL, Drugs (Penicillin) | Associations: Mycoplasma, Mononucleosis, Lymphoma |
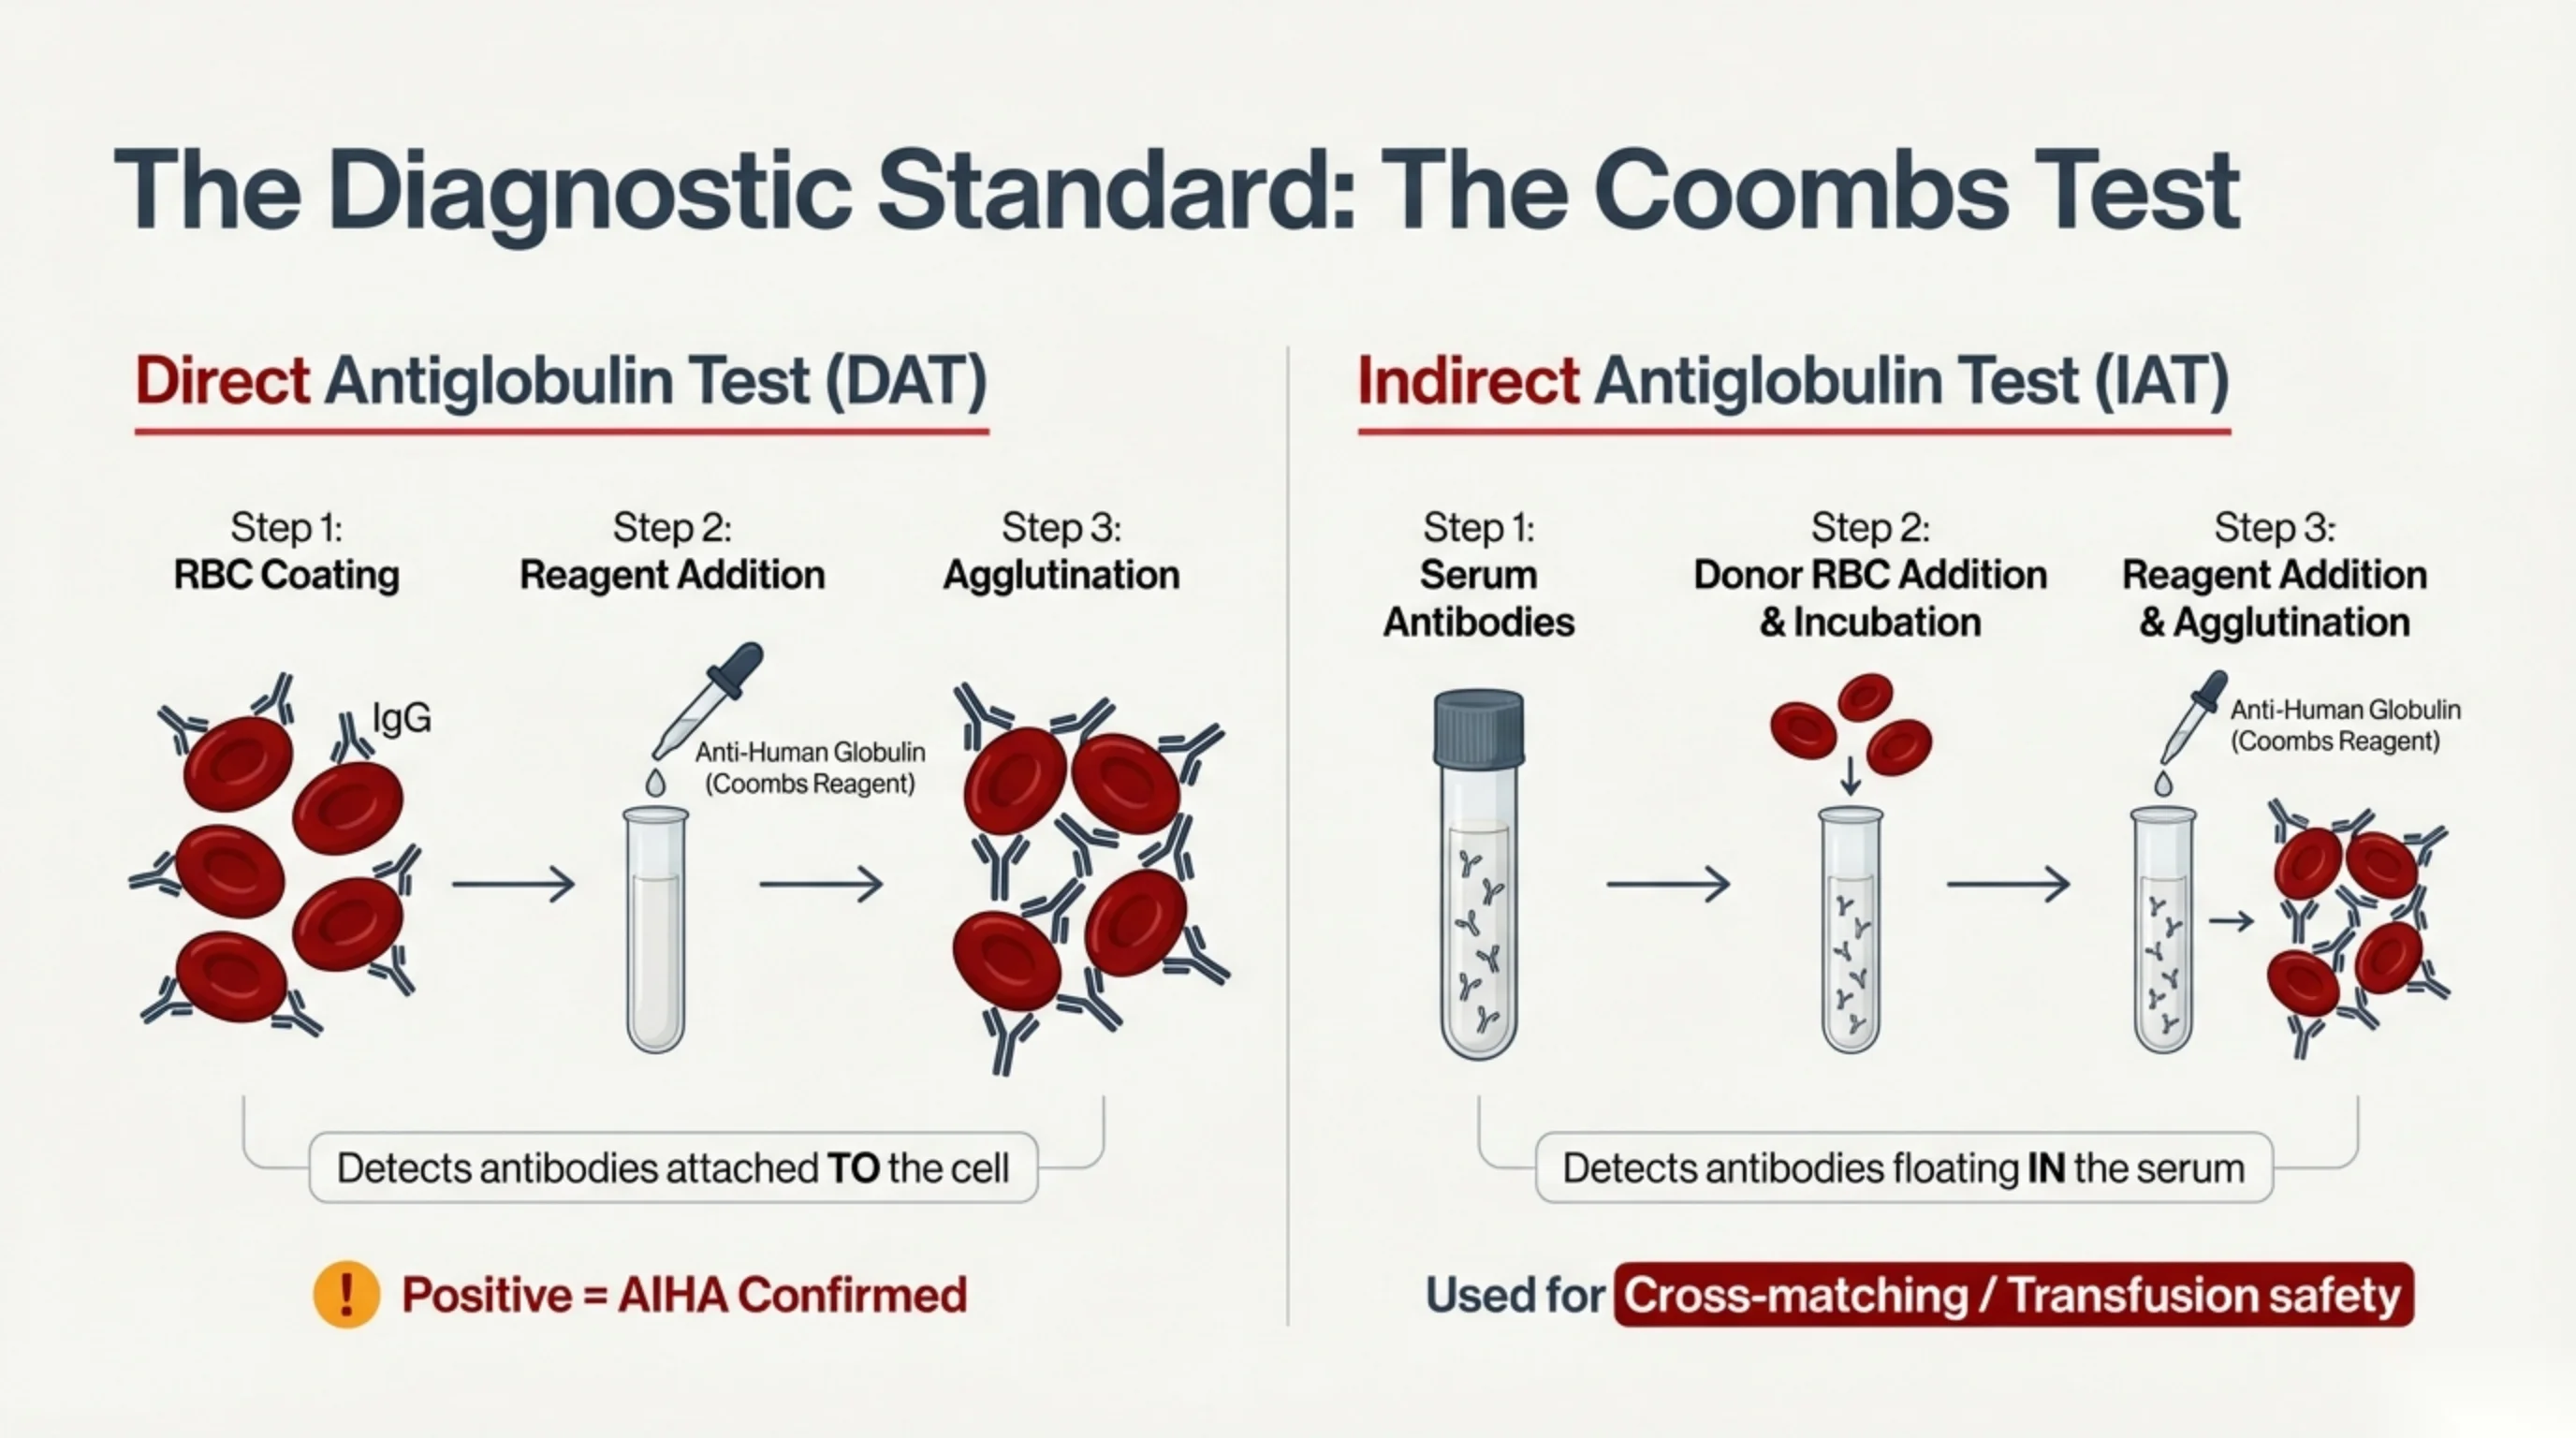
The Diagnostic Standard: The Coombs Test
Direct Antiglobulin Test (DAT)
- Step 1: RBC Coating (IgG)
- Step 2: Reagent Addition (Anti-Human Globulin / Coombs Reagent)
- Step 3: Agglutination
Detects antibodies attached TO the cell.
Positive = AIHA Confirmed
Indirect Antiglobulin Test (IAT)
- Step 1: Serum Antibodies
- Step 2: Donor RBC Addition & Incubation
- Step 3: Reagent Addition & Agglutination (Anti-Human Globulin / Coombs Reagent)
Detects antibodies floating IN the serum.
Used for Cross-matching / Transfusion safety
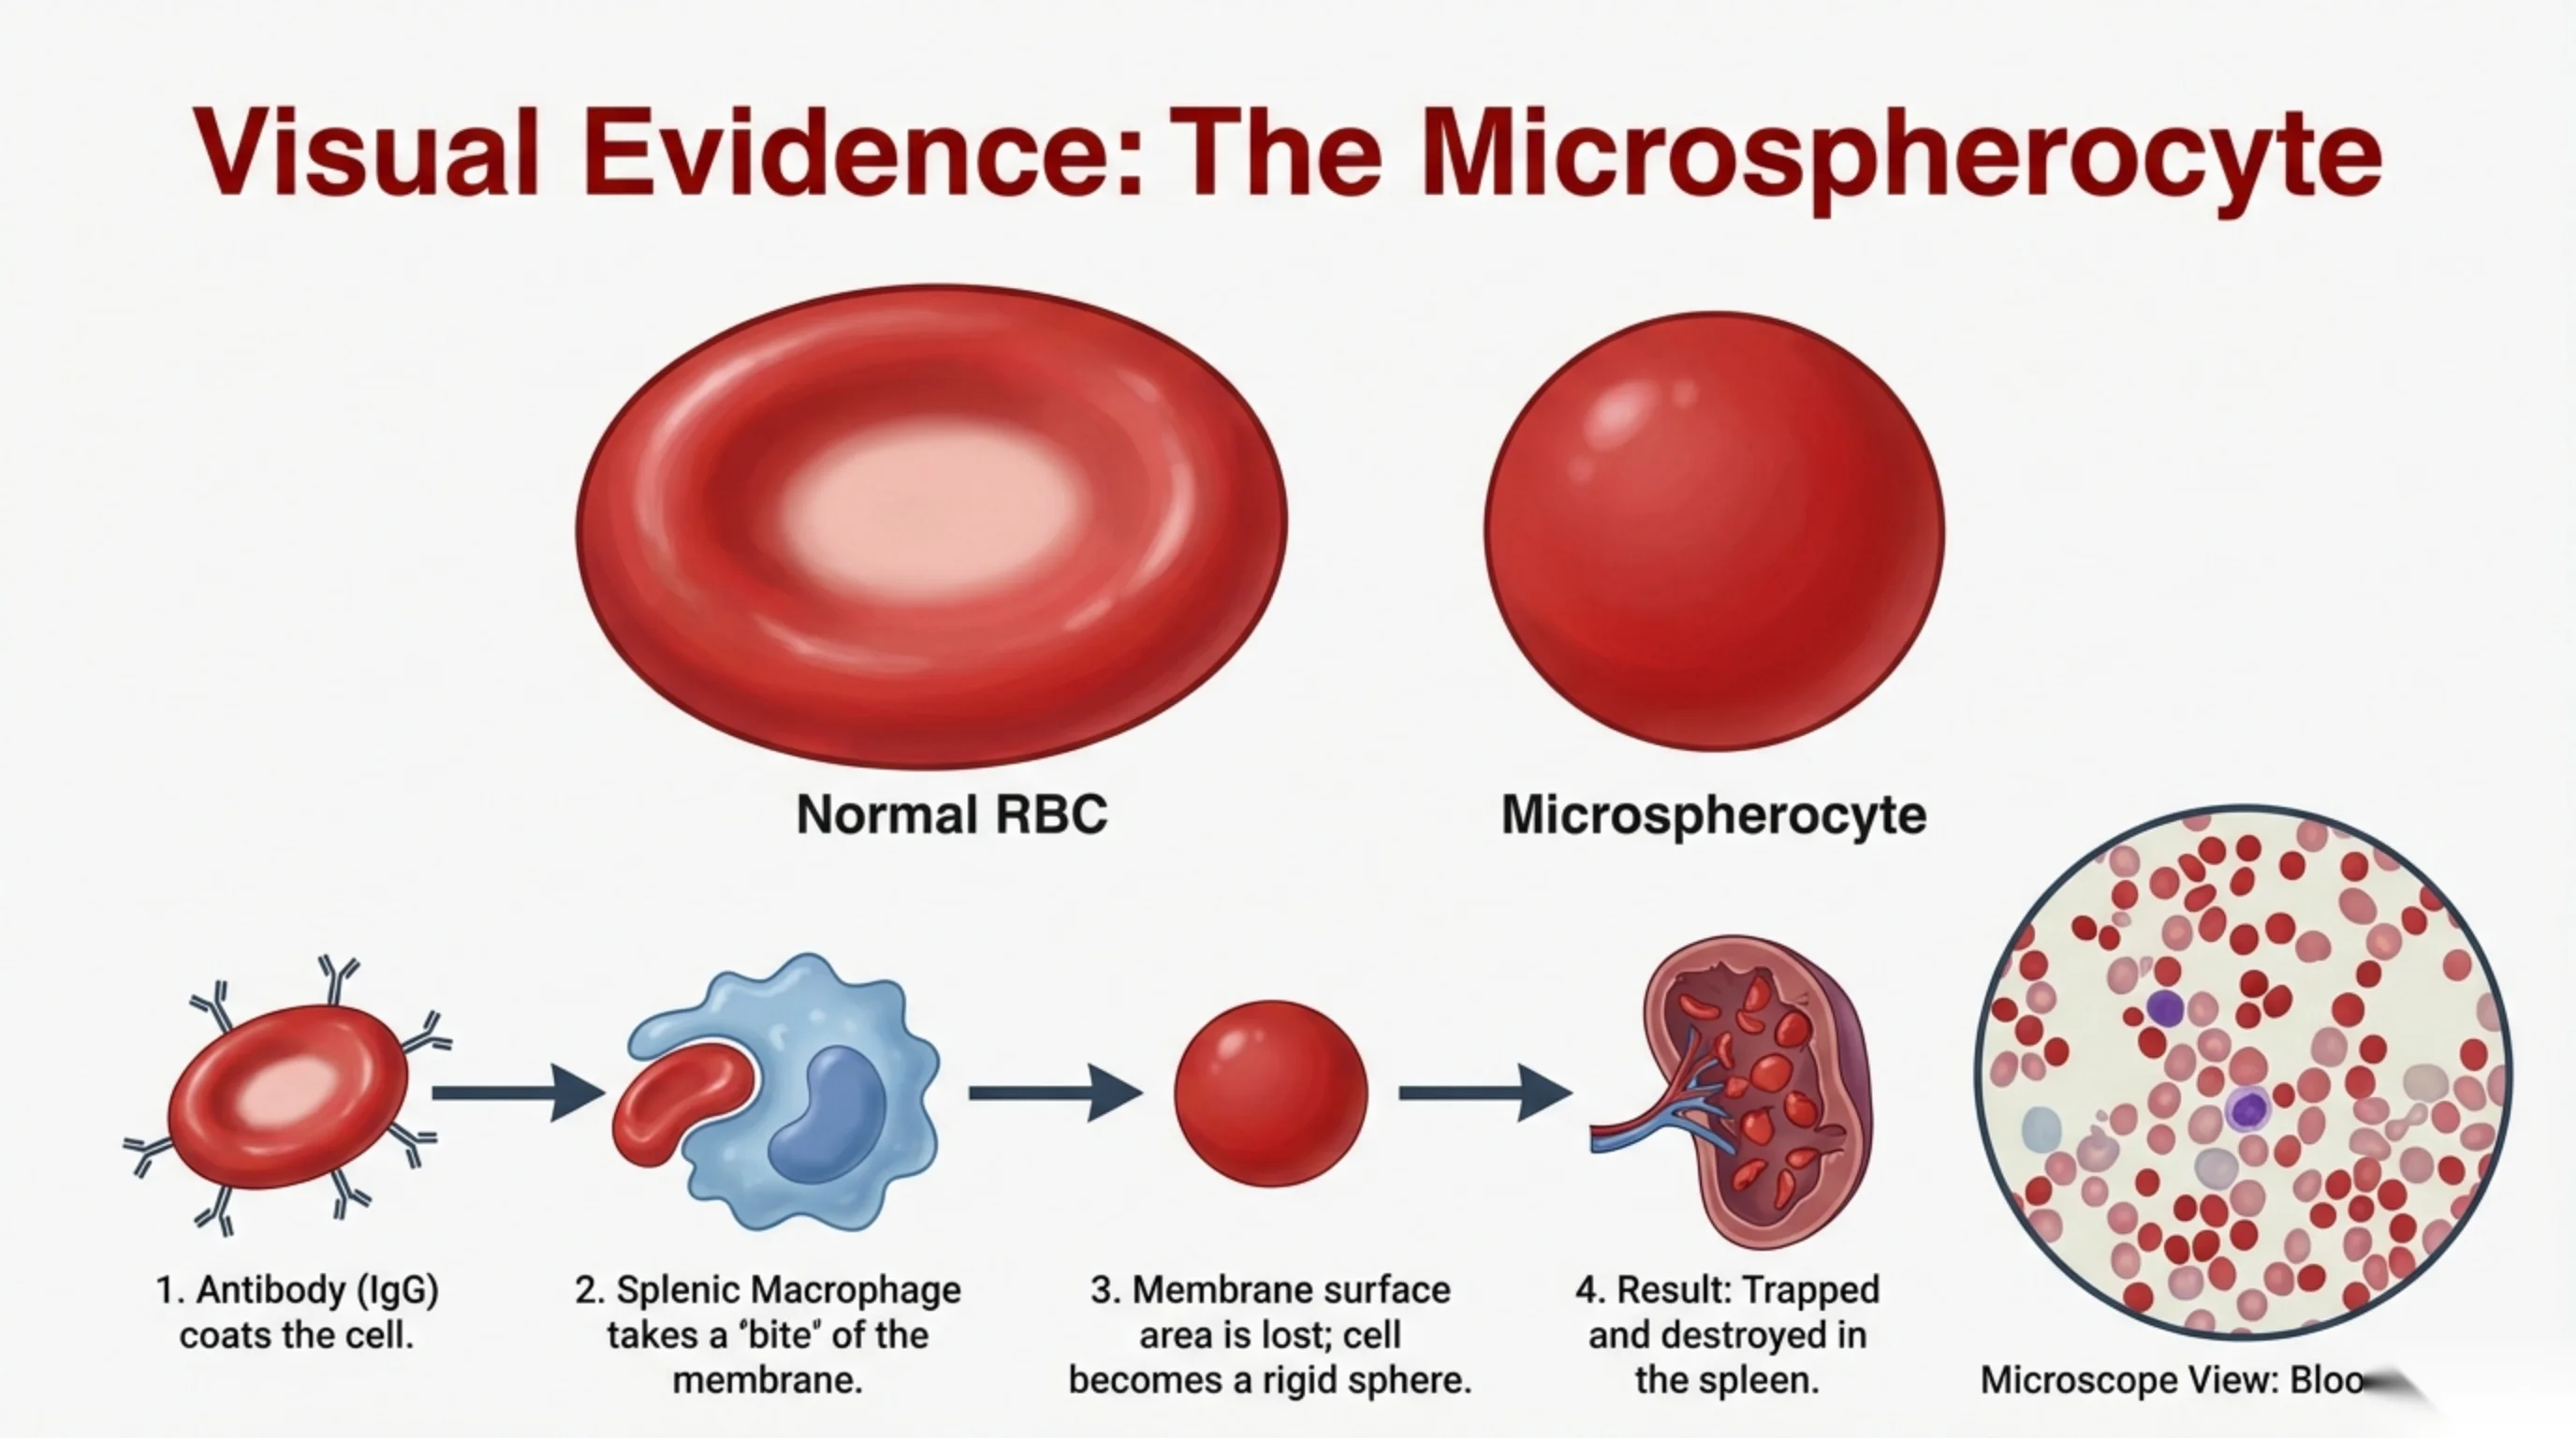
Visual Evidence: The Microspherocyte
Comparison: Normal RBC versus Microspherocyte.
Mechanism sequence:
- 1. Antibody (IgG) coats the cell.
- 2. Splenic Macrophage takes a “bite” of the membrane.
- 3. Membrane surface area is lost; cell becomes a rigid sphere.
- 4. Result: Trapped and destroyed in the spleen.
Microscope View: Blood [smear] (label partially cut off).
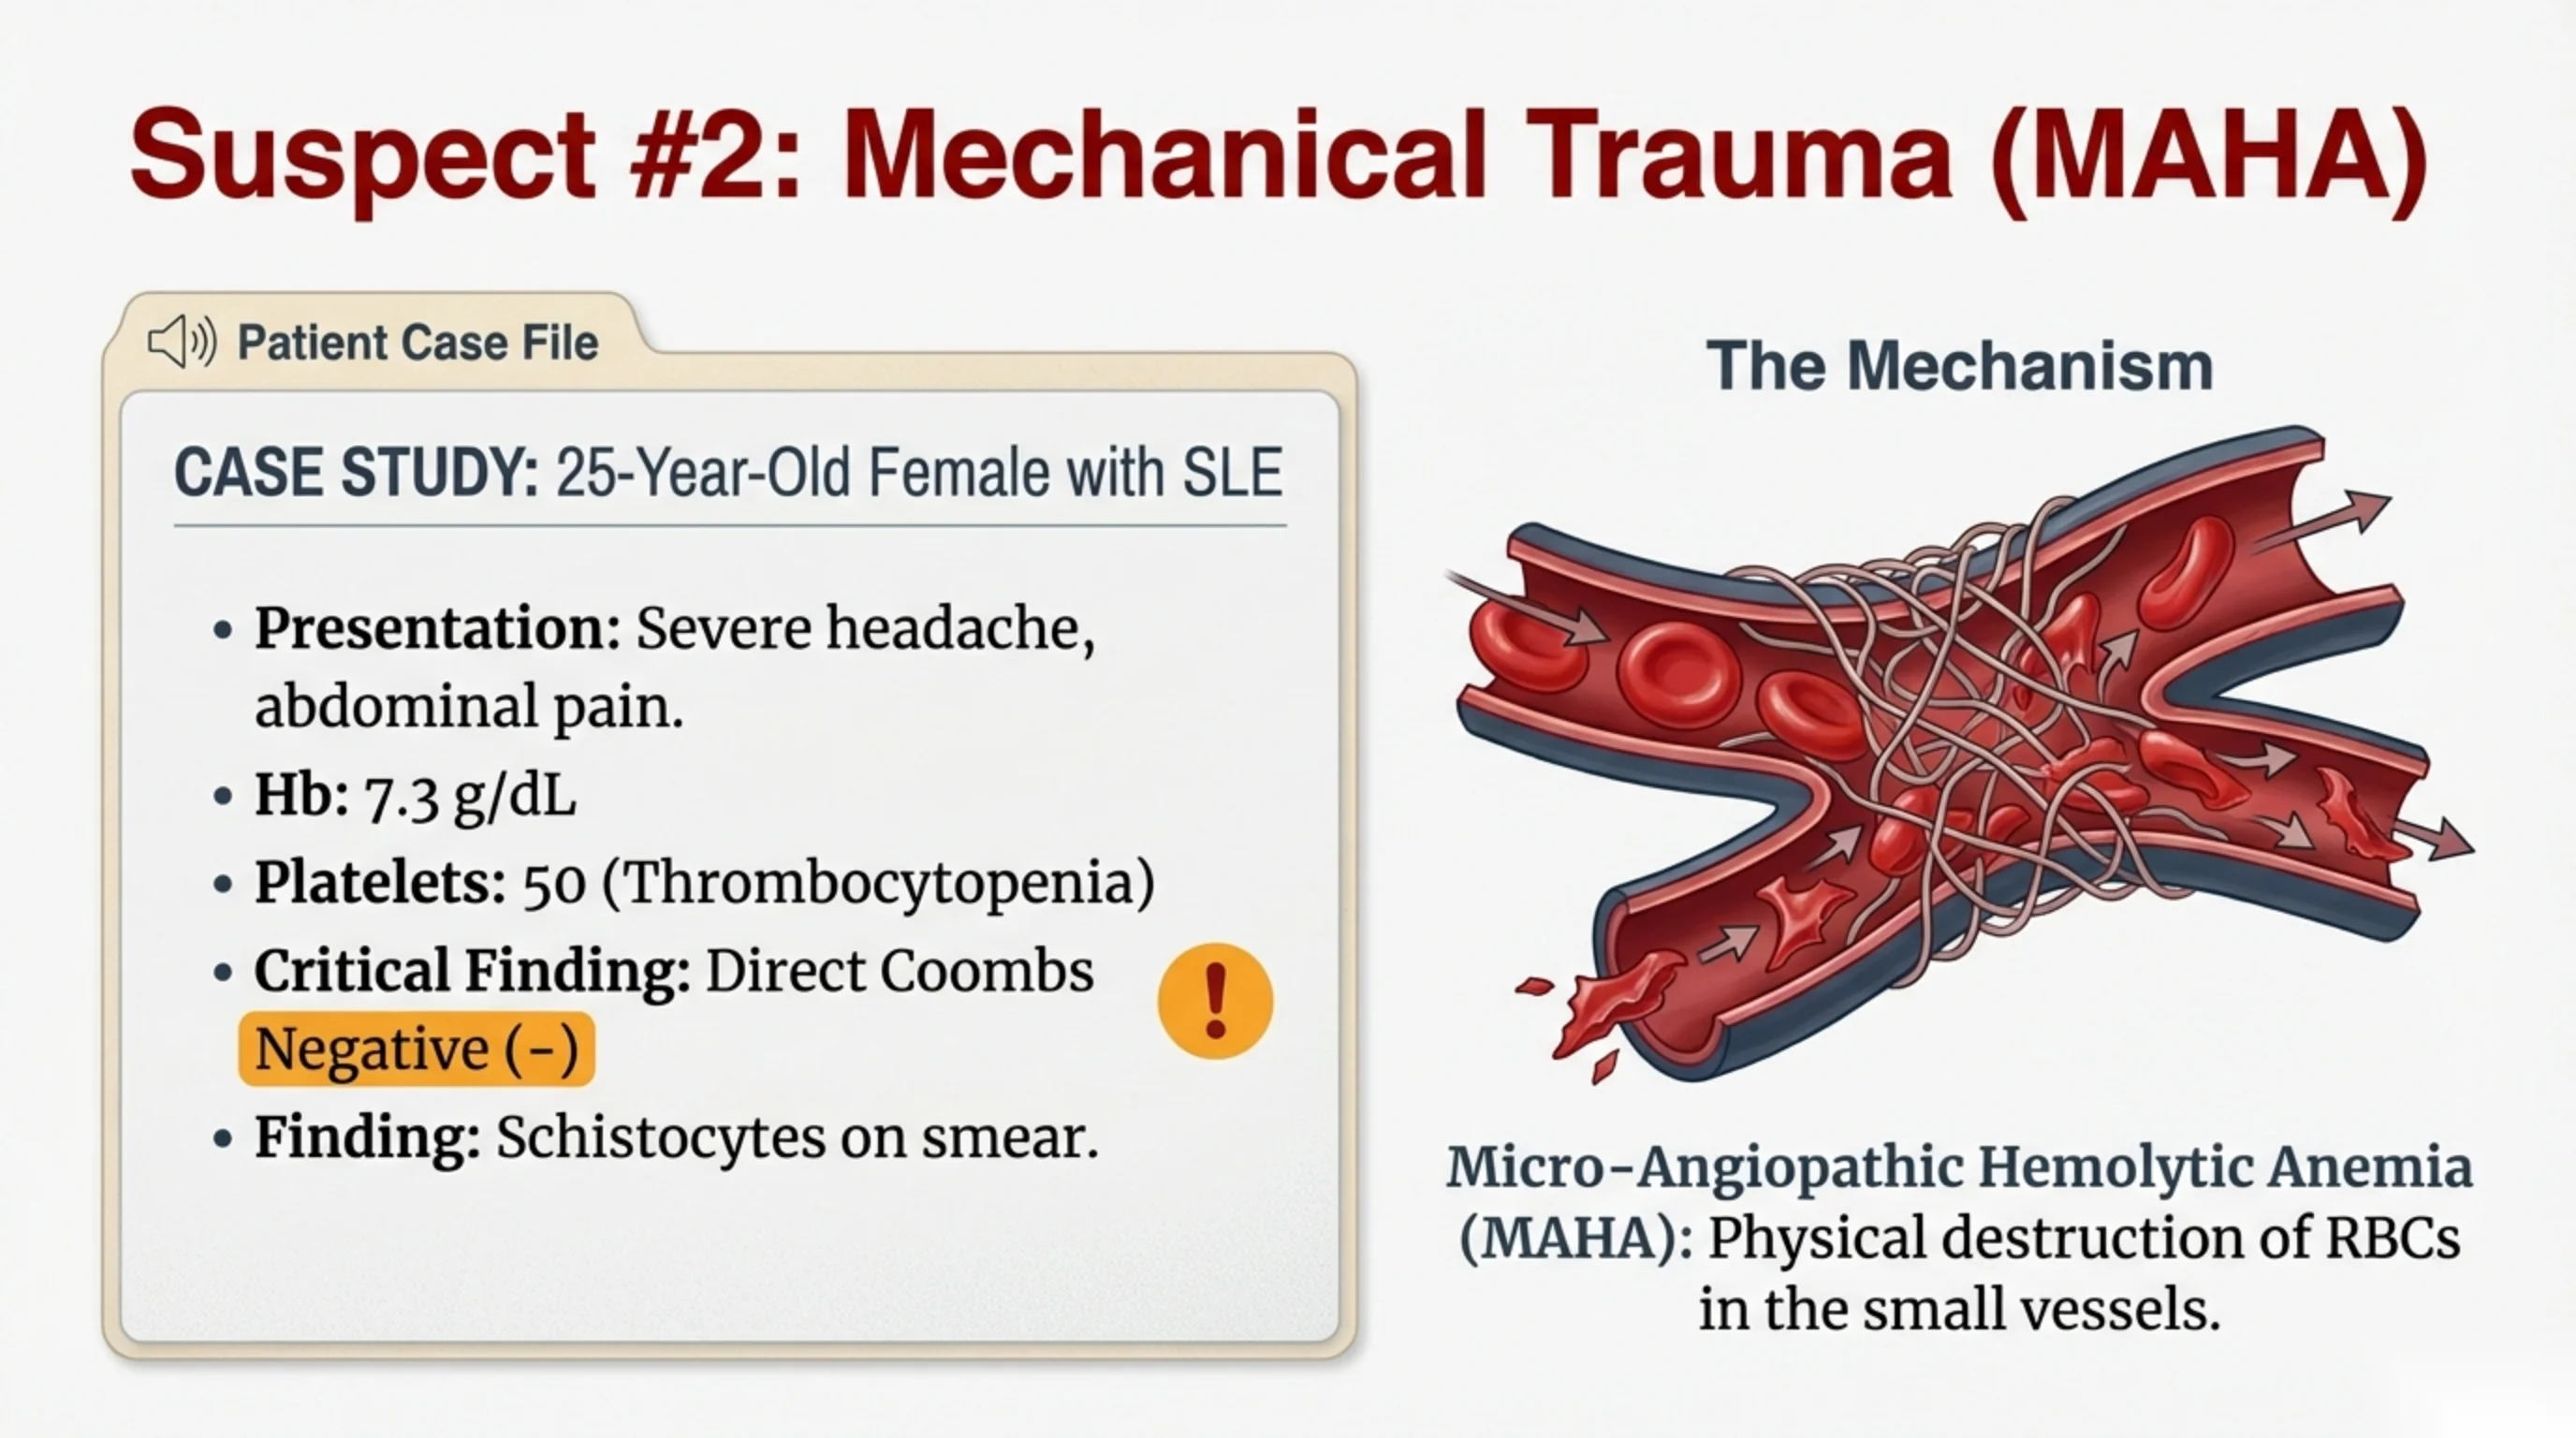
Suspect #2: Mechanical Trauma (MAHA)
Patient Case File
CASE STUDY: 25-Year-Old Female with SLE
- Presentation: Severe headache, abdominal pain.
- Hb: 7.3 g/dL
- Platelets: 50 (Thrombocytopenia)
- Critical Finding: Direct Coombs Negative (−)
- Finding: Schistocytes on smear.
The Mechanism
Micro-Angiopathic Hemolytic Anemia (MAHA): Physical destruction of RBCs in the small vessels.
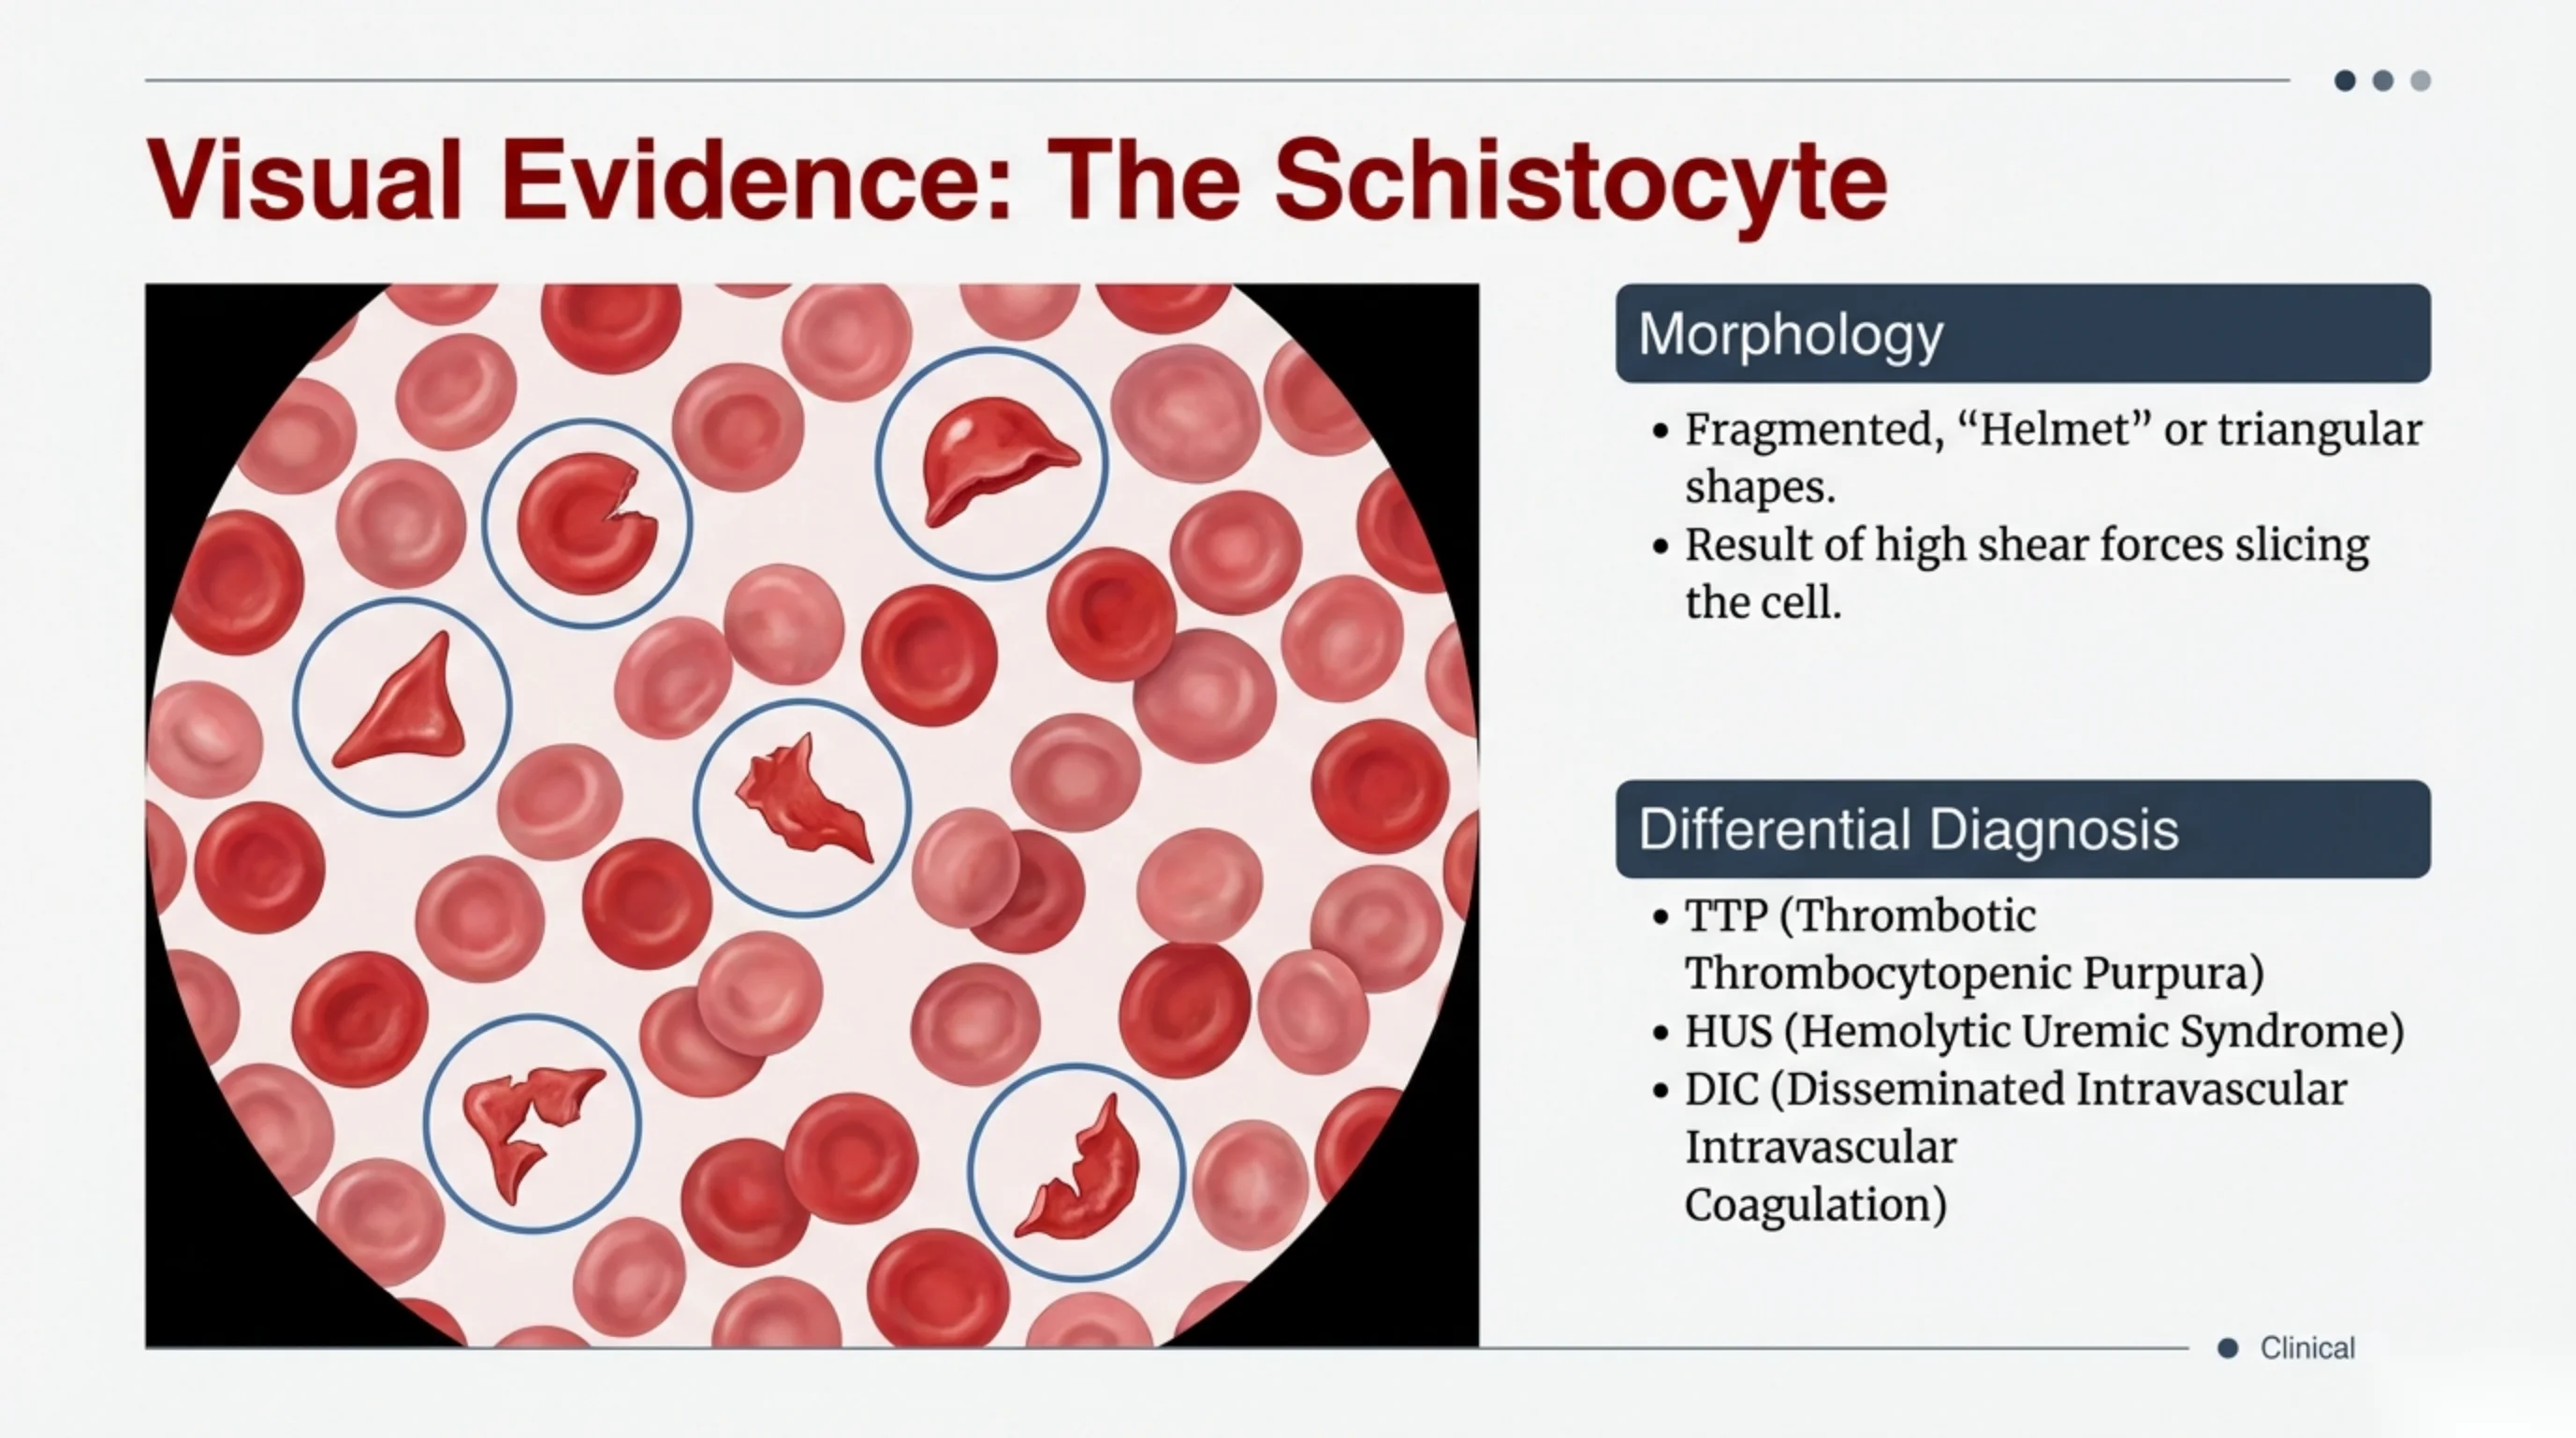
Visual Evidence: The Schistocyte
Morphology
- Fragmented, “Helmet” or triangular shapes.
- Result of high shear forces slicing the cell.
Differential Diagnosis
- TTP (Thrombotic Thrombocytopenic Purpura)
- HUS (Hemolytic Uremic Syndrome)
- DIC (Disseminated Intravascular Coagulation)
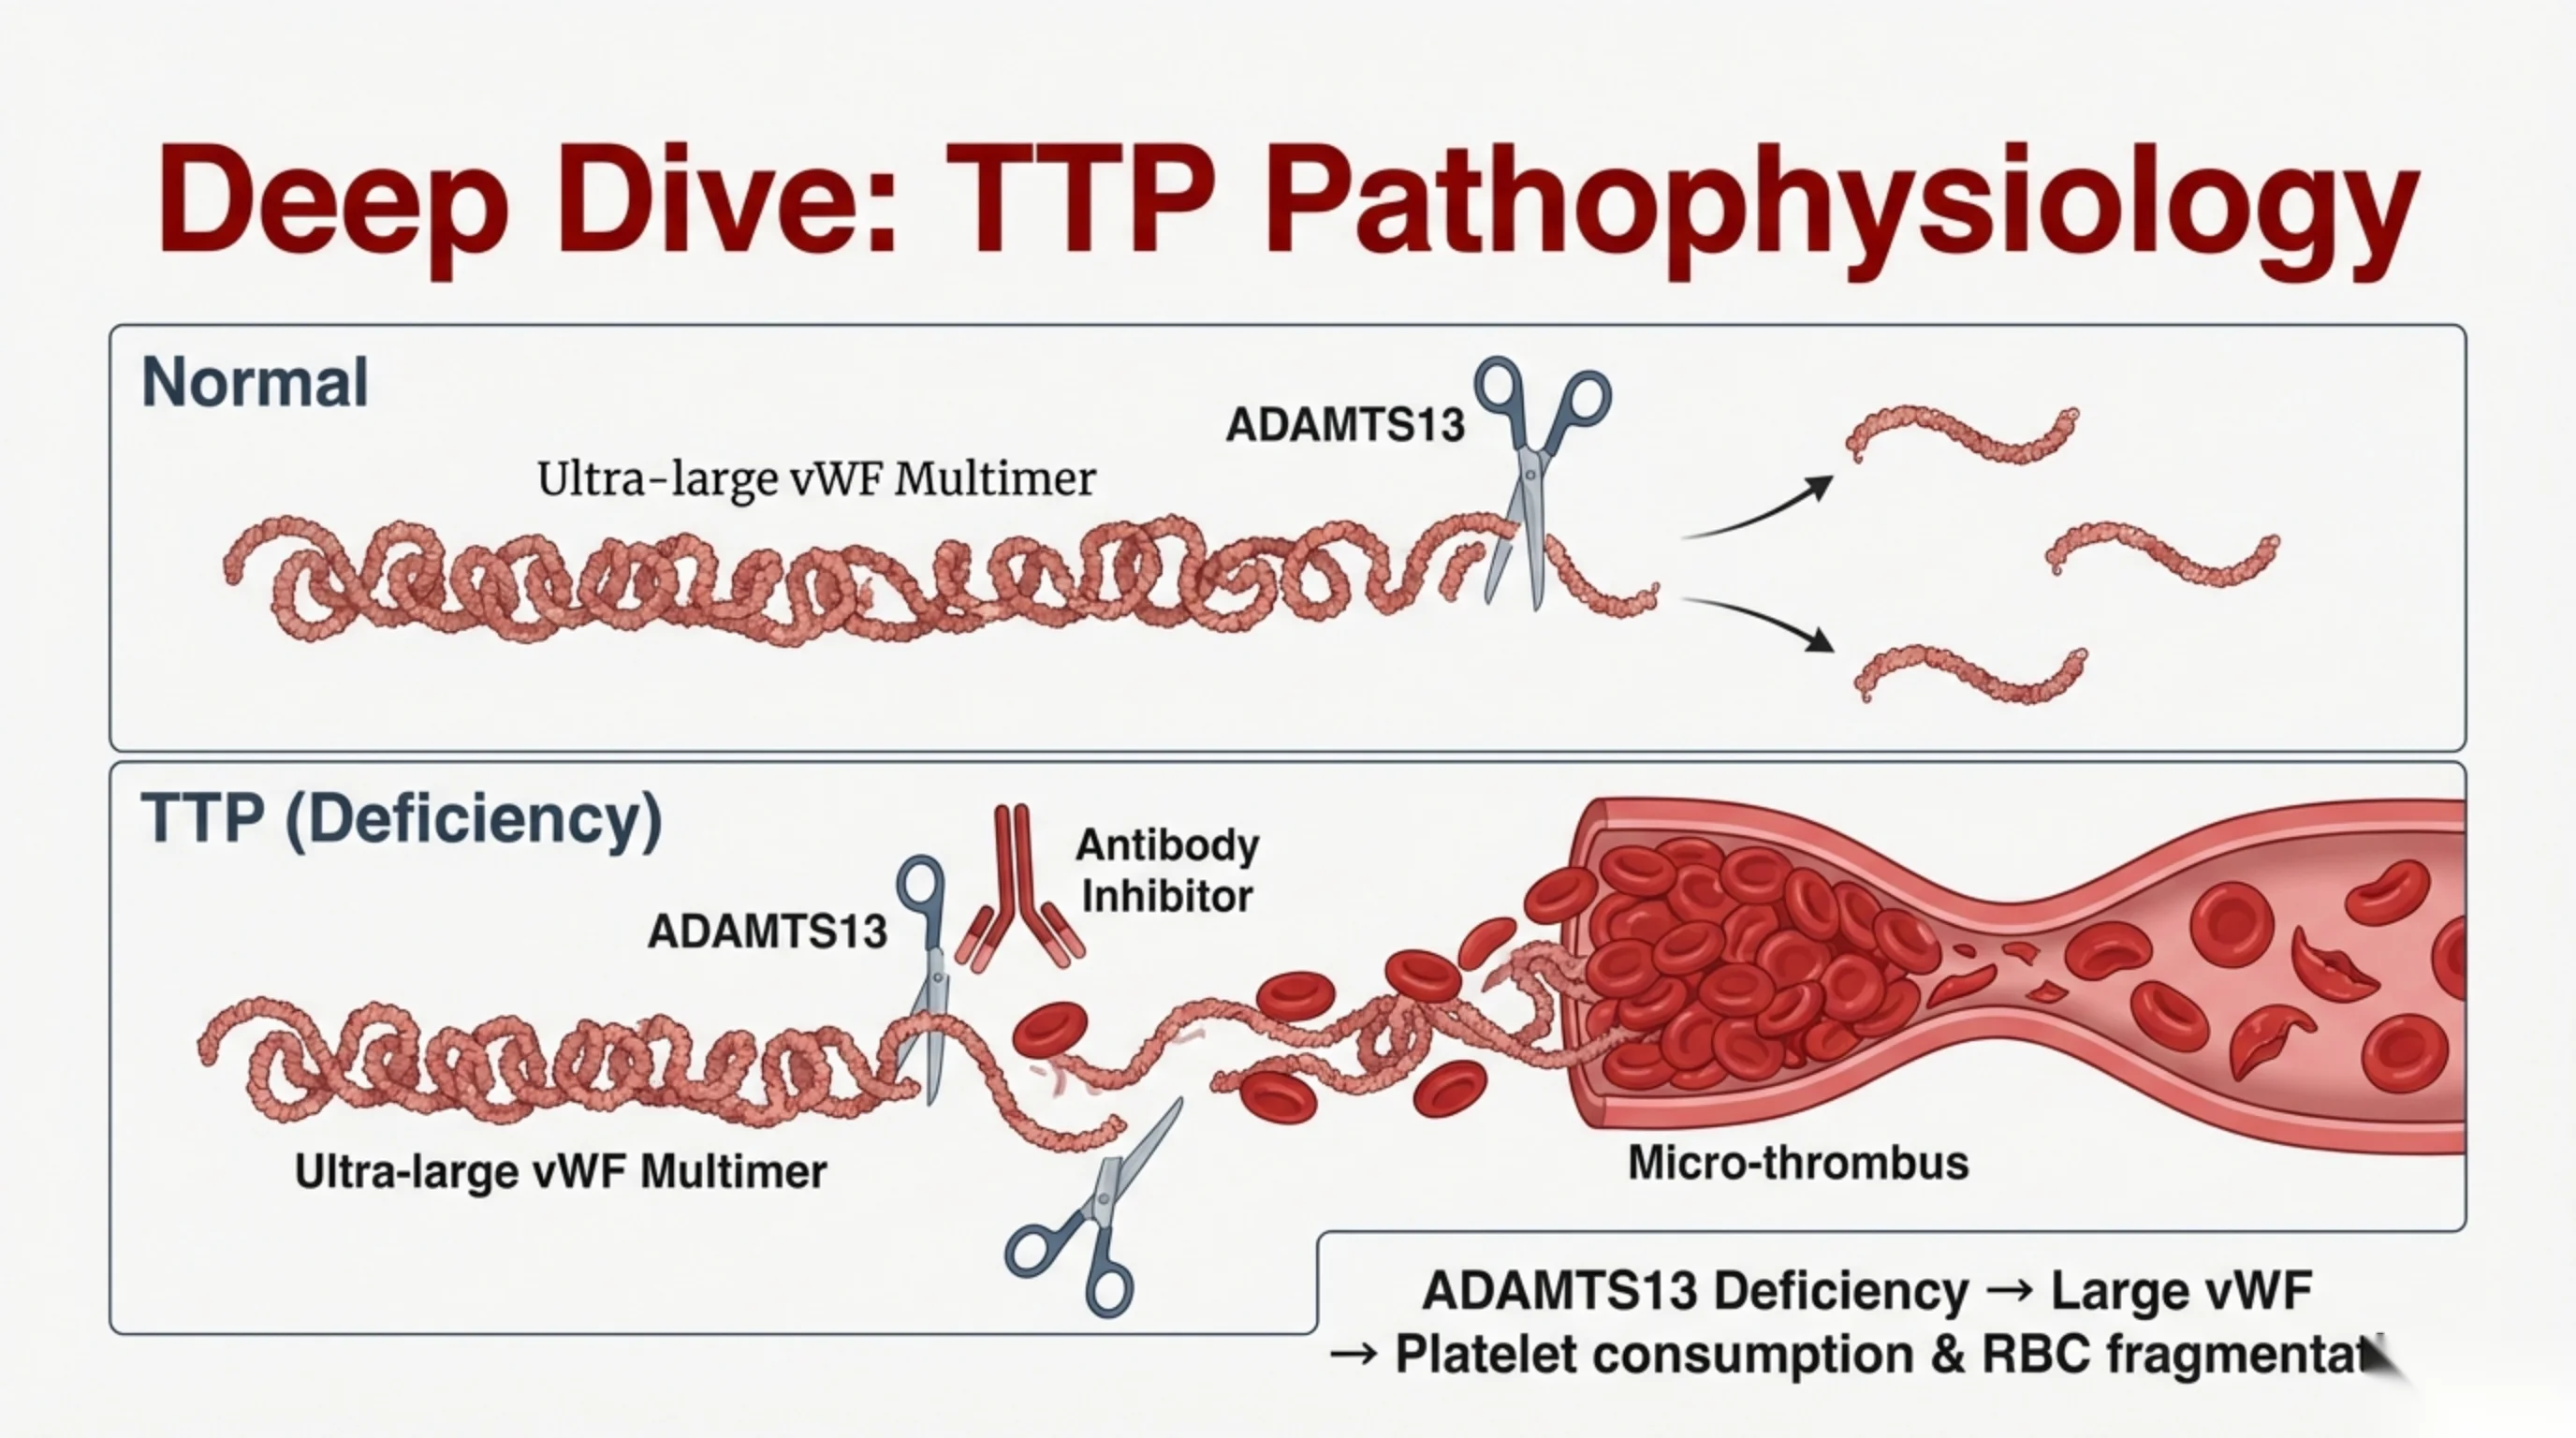
Deep Dive: TTP Pathophysiology
Normal
ADAMTS13 (acting like scissors) cleaves the Ultra-large vWF Multimer into smaller fragments.
TTP (Deficiency)
An Antibody Inhibitor blocks ADAMTS13, so the Ultra-large vWF Multimer is not cleaved, leading to platelet trapping and a Micro-thrombus.
ADAMTS13 Deficiency → Large vWF → Platelet consumption & RBC fragmenta[tion] (text partially cut off).
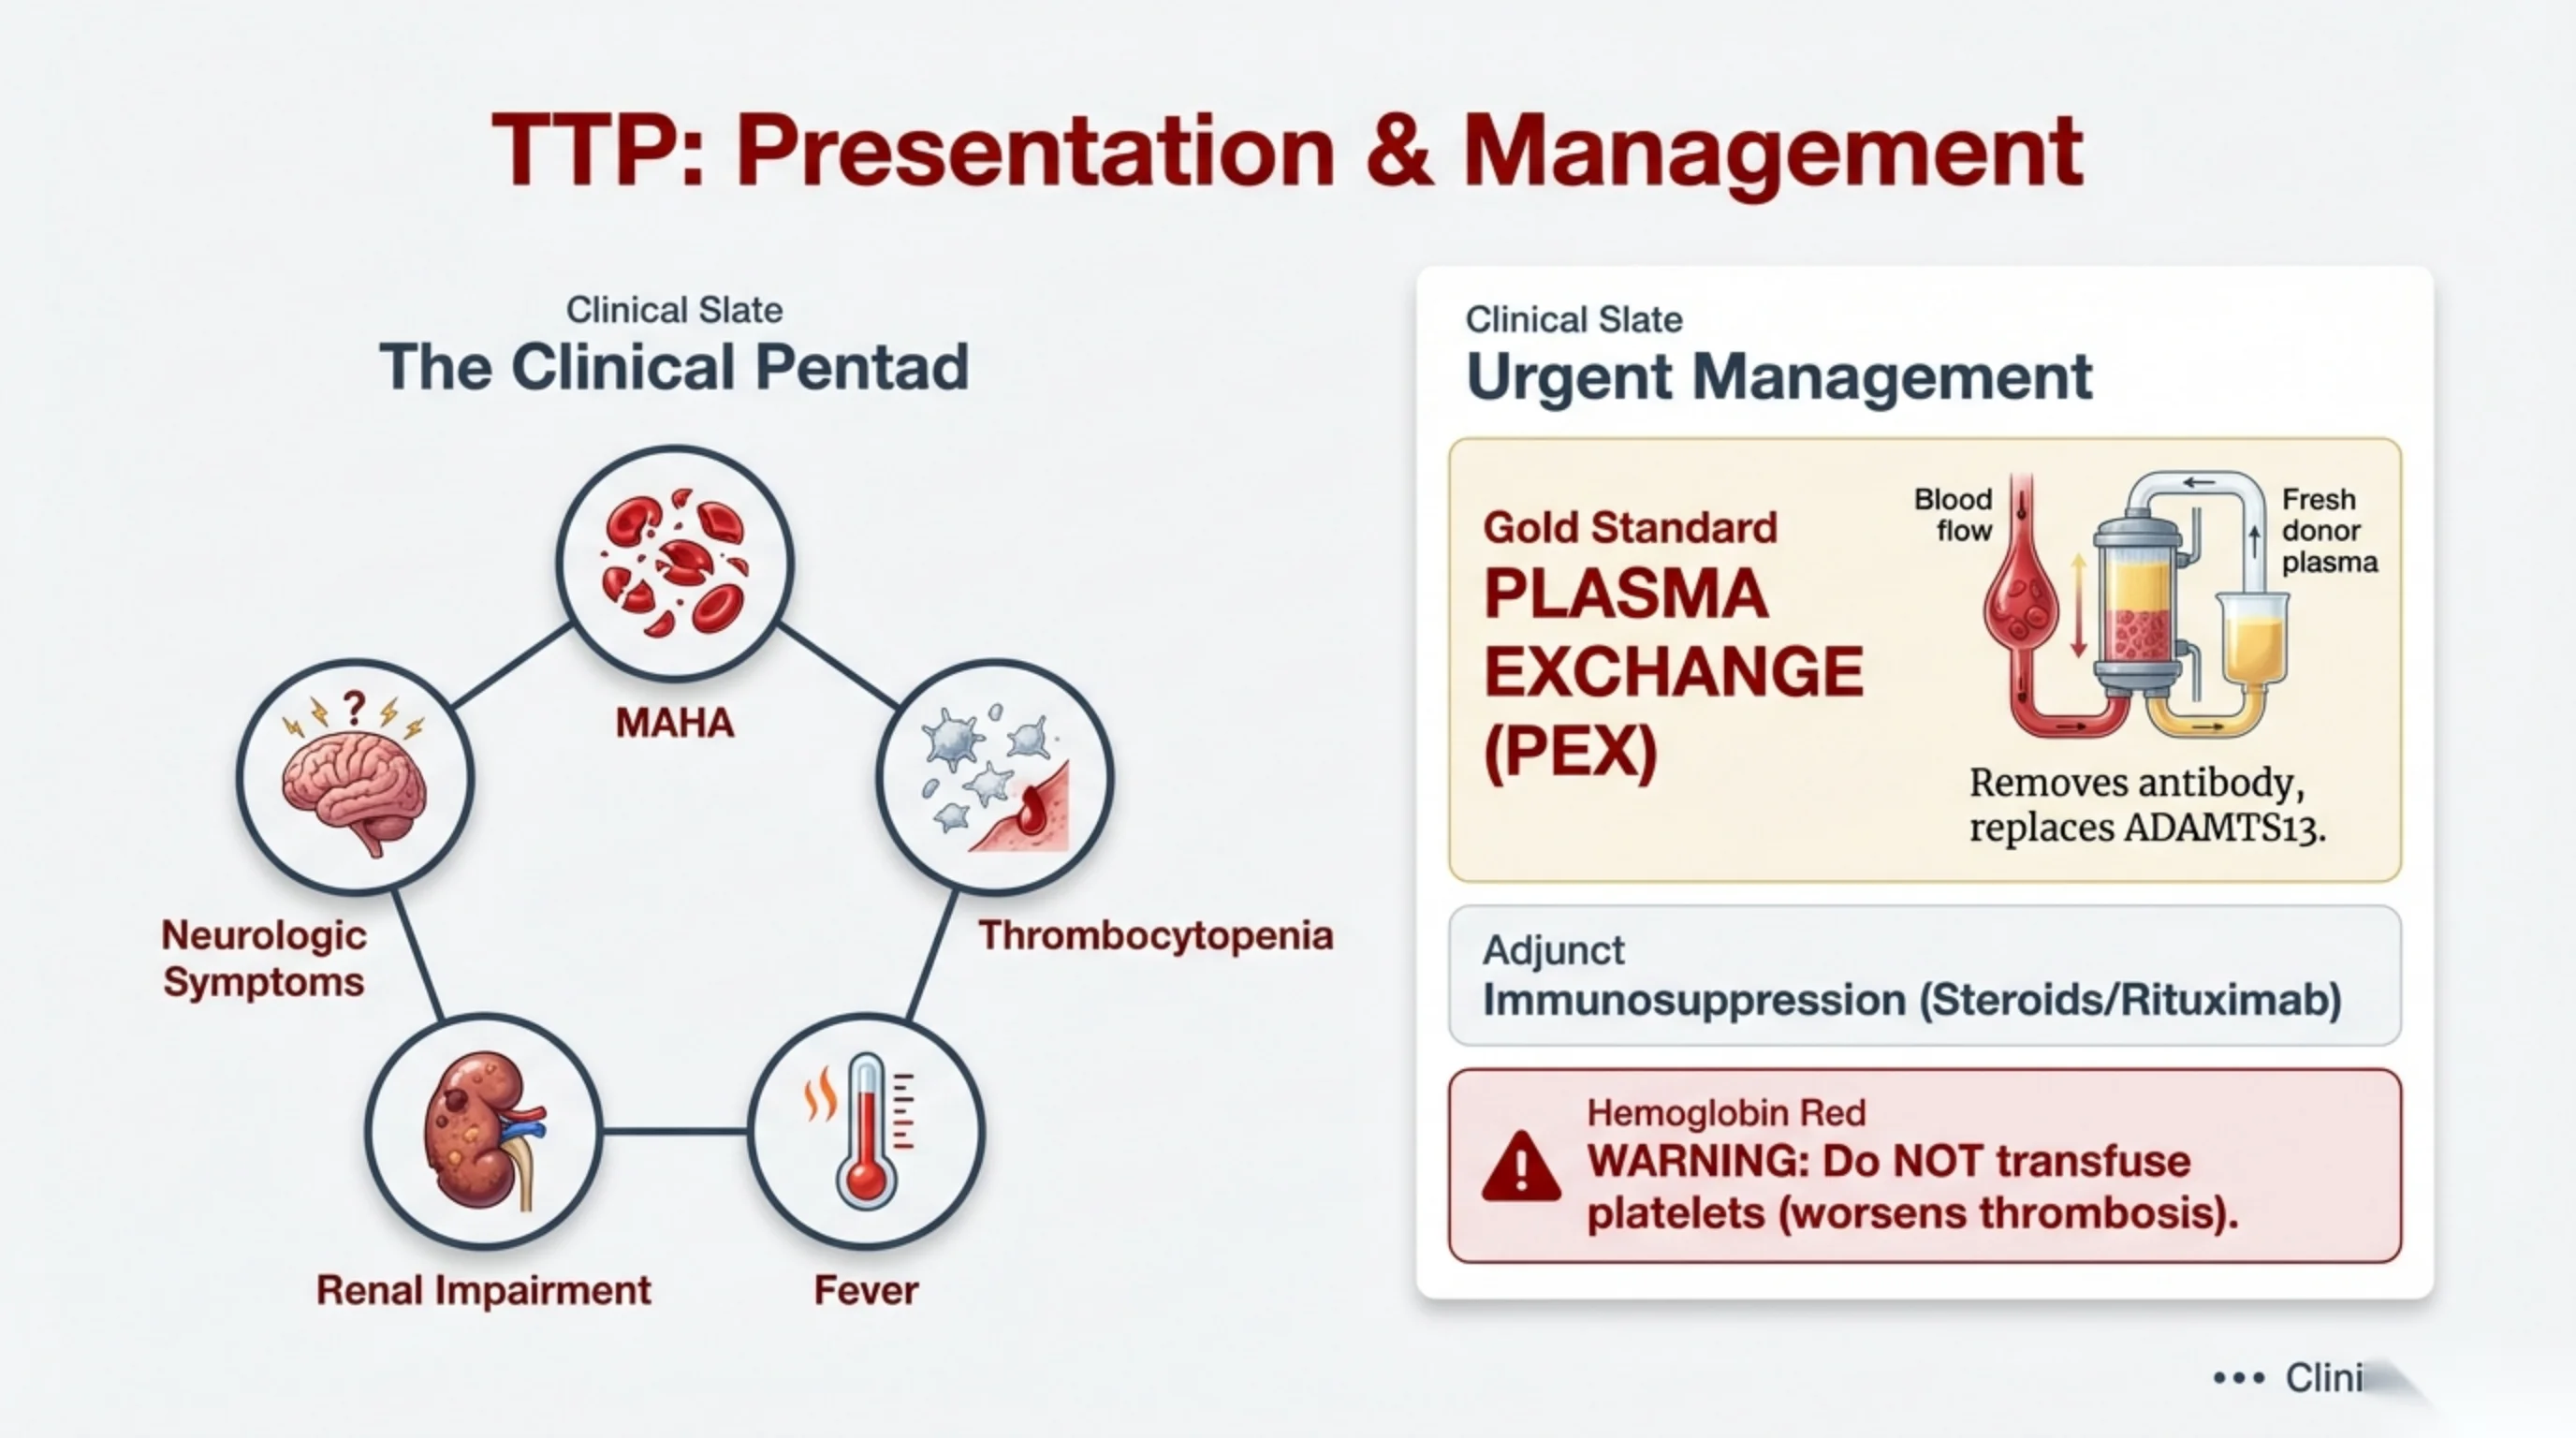
TTP: Presentation & Management
The Clinical Pentad
- MAHA
- Thrombocytopenia
- Fever
- Renal Impairment
- Neurologic Symptoms
Urgent Management
- Gold Standard: PLASMA EXCHANGE (PEX) — Removes antibody, replaces ADAMTS13.
- Adjunct: Immunosuppression (Steroids/Rituximab)
WARNING: Do NOT transfuse platelets (worsens thrombosis).
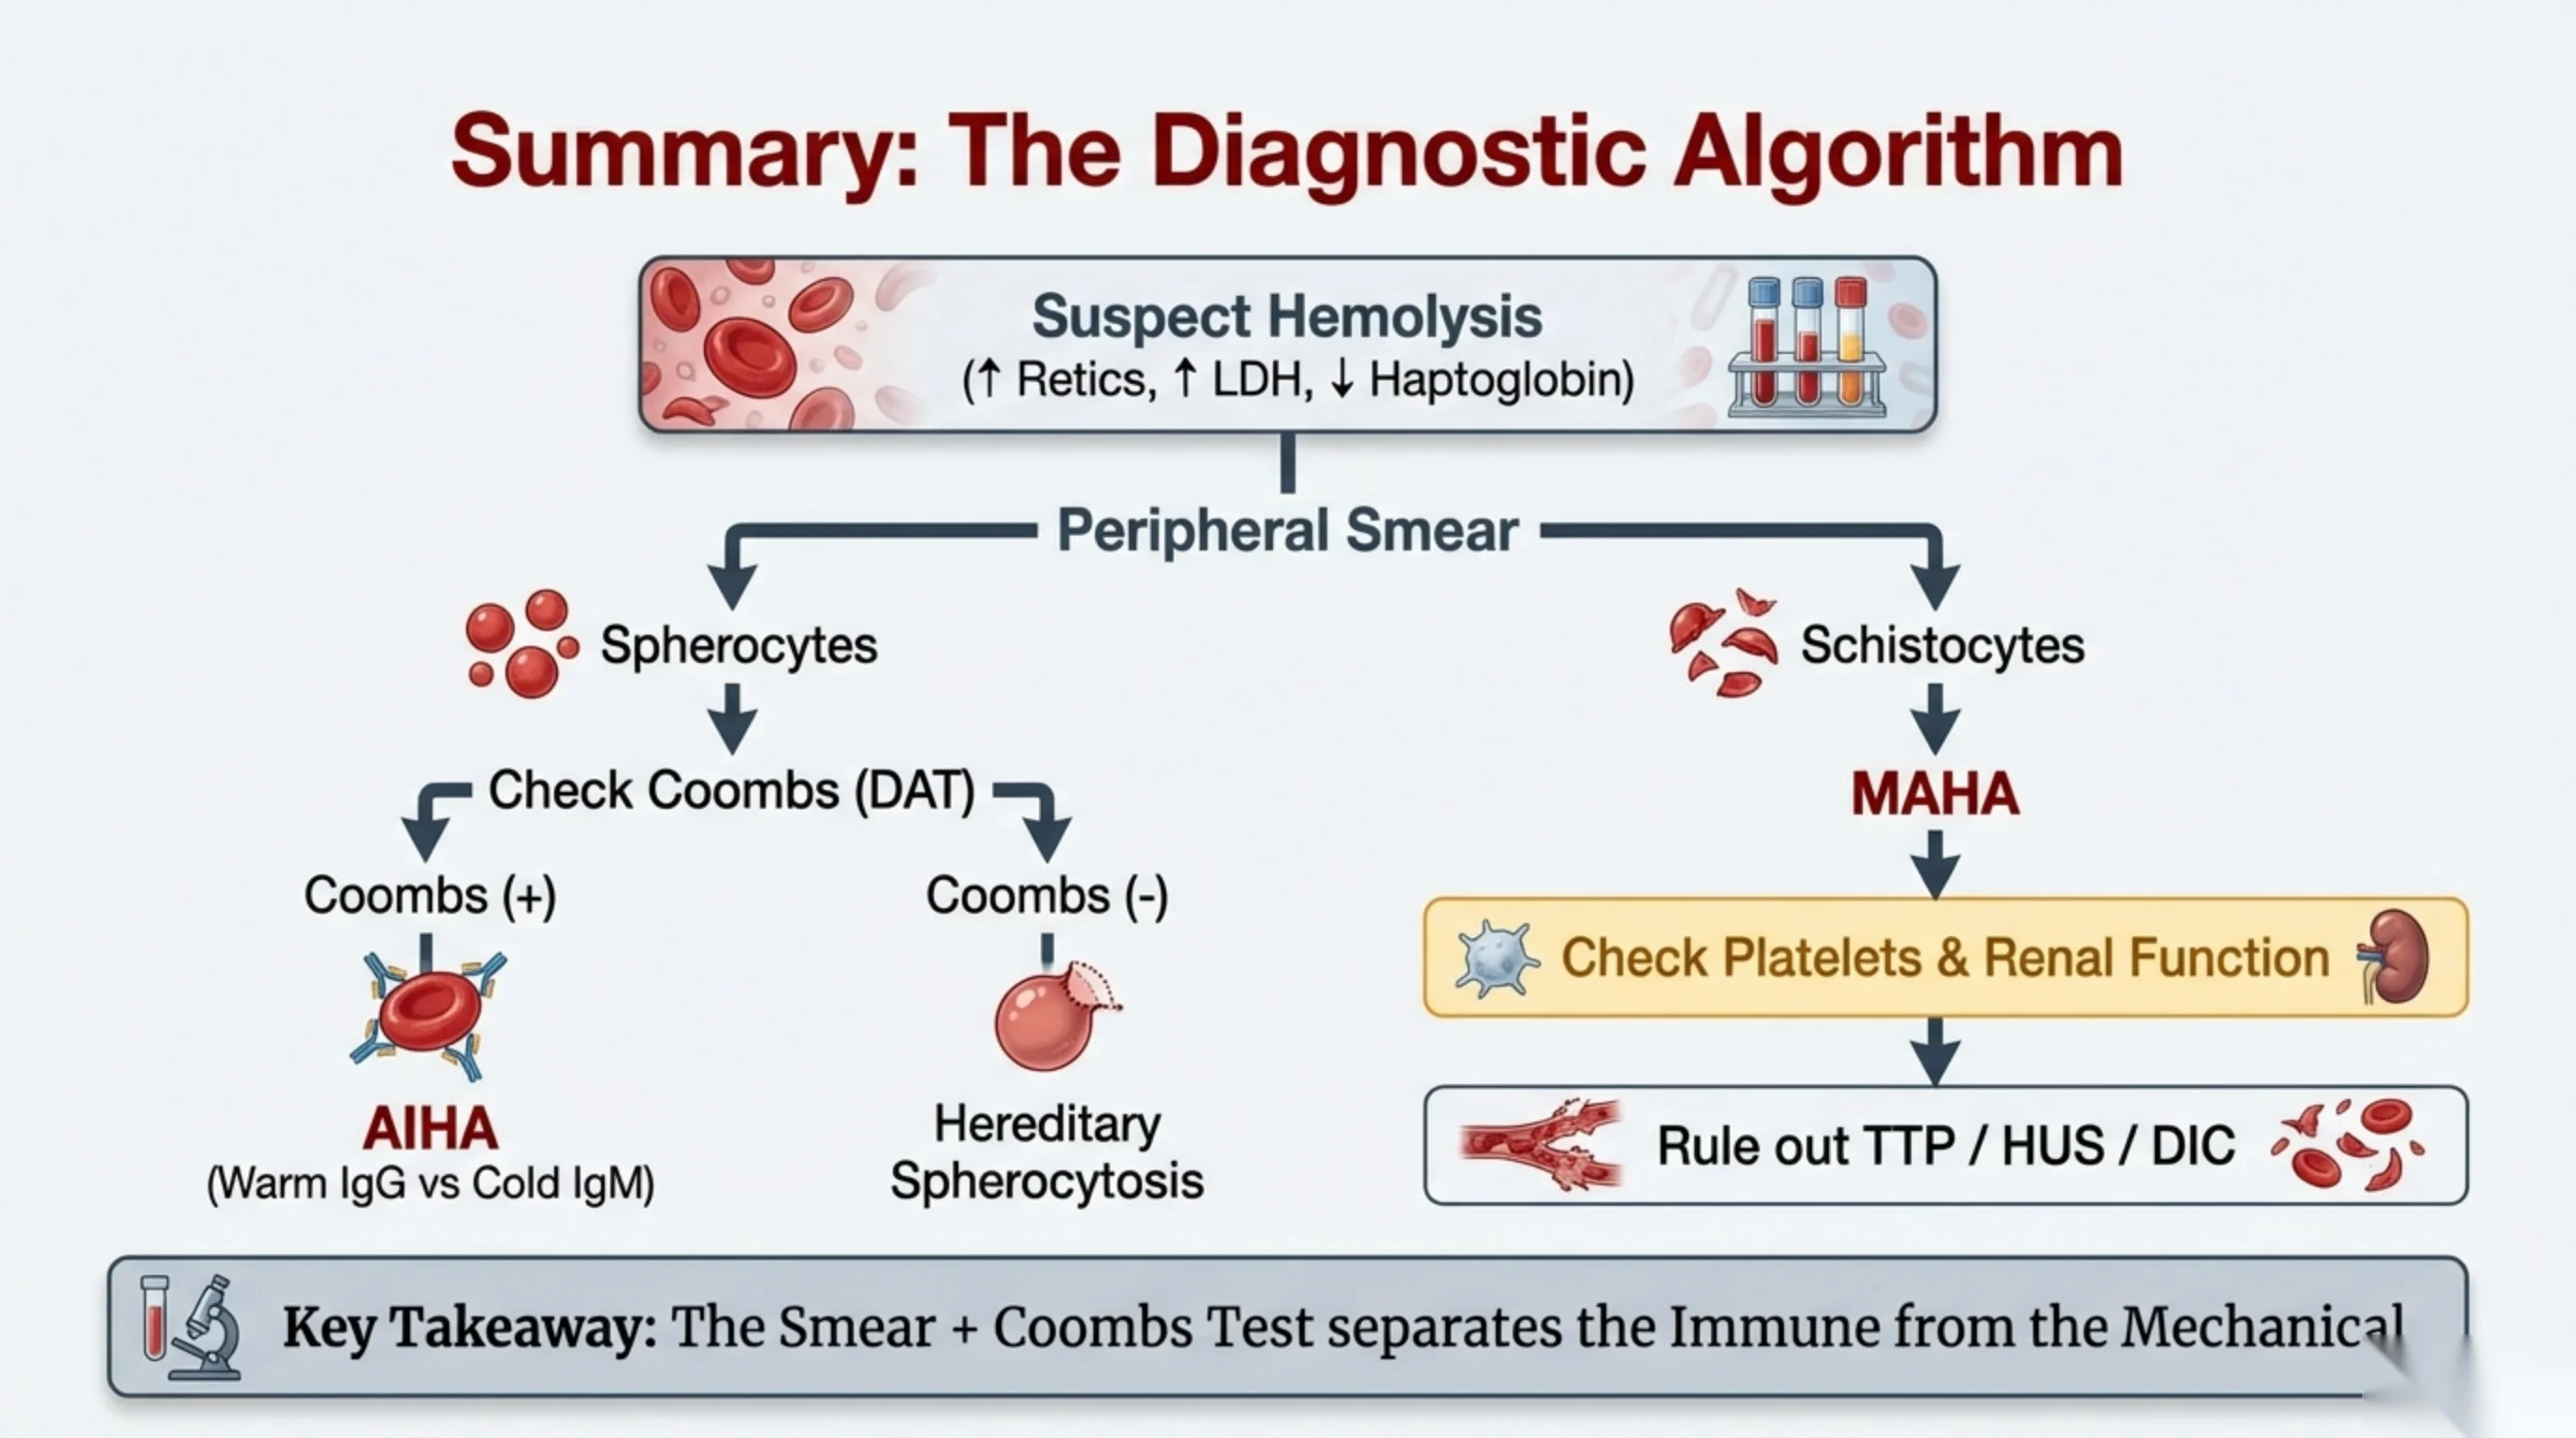
Summary: The Diagnostic Algorithm
Suspect Hemolysis (↑ Retics, ↑ LDH, ↓ Haptoglobin) → Peripheral Smear, which branches two ways:
Left branch — Spherocytes:
- Check Coombs (DAT)
- Coombs (+) → AIHA (Warm IgG vs Cold IgM)
- Coombs (−) → Hereditary Spherocytosis
Right branch — Schistocytes:
- MAHA
- Check Platelets & Renal Function
- Rule out TTP / HUS / DIC
Key Takeaway: The Smear + Coombs Test separates the Immune from the Mechanical.
Hereditary Hemolytic Anemia
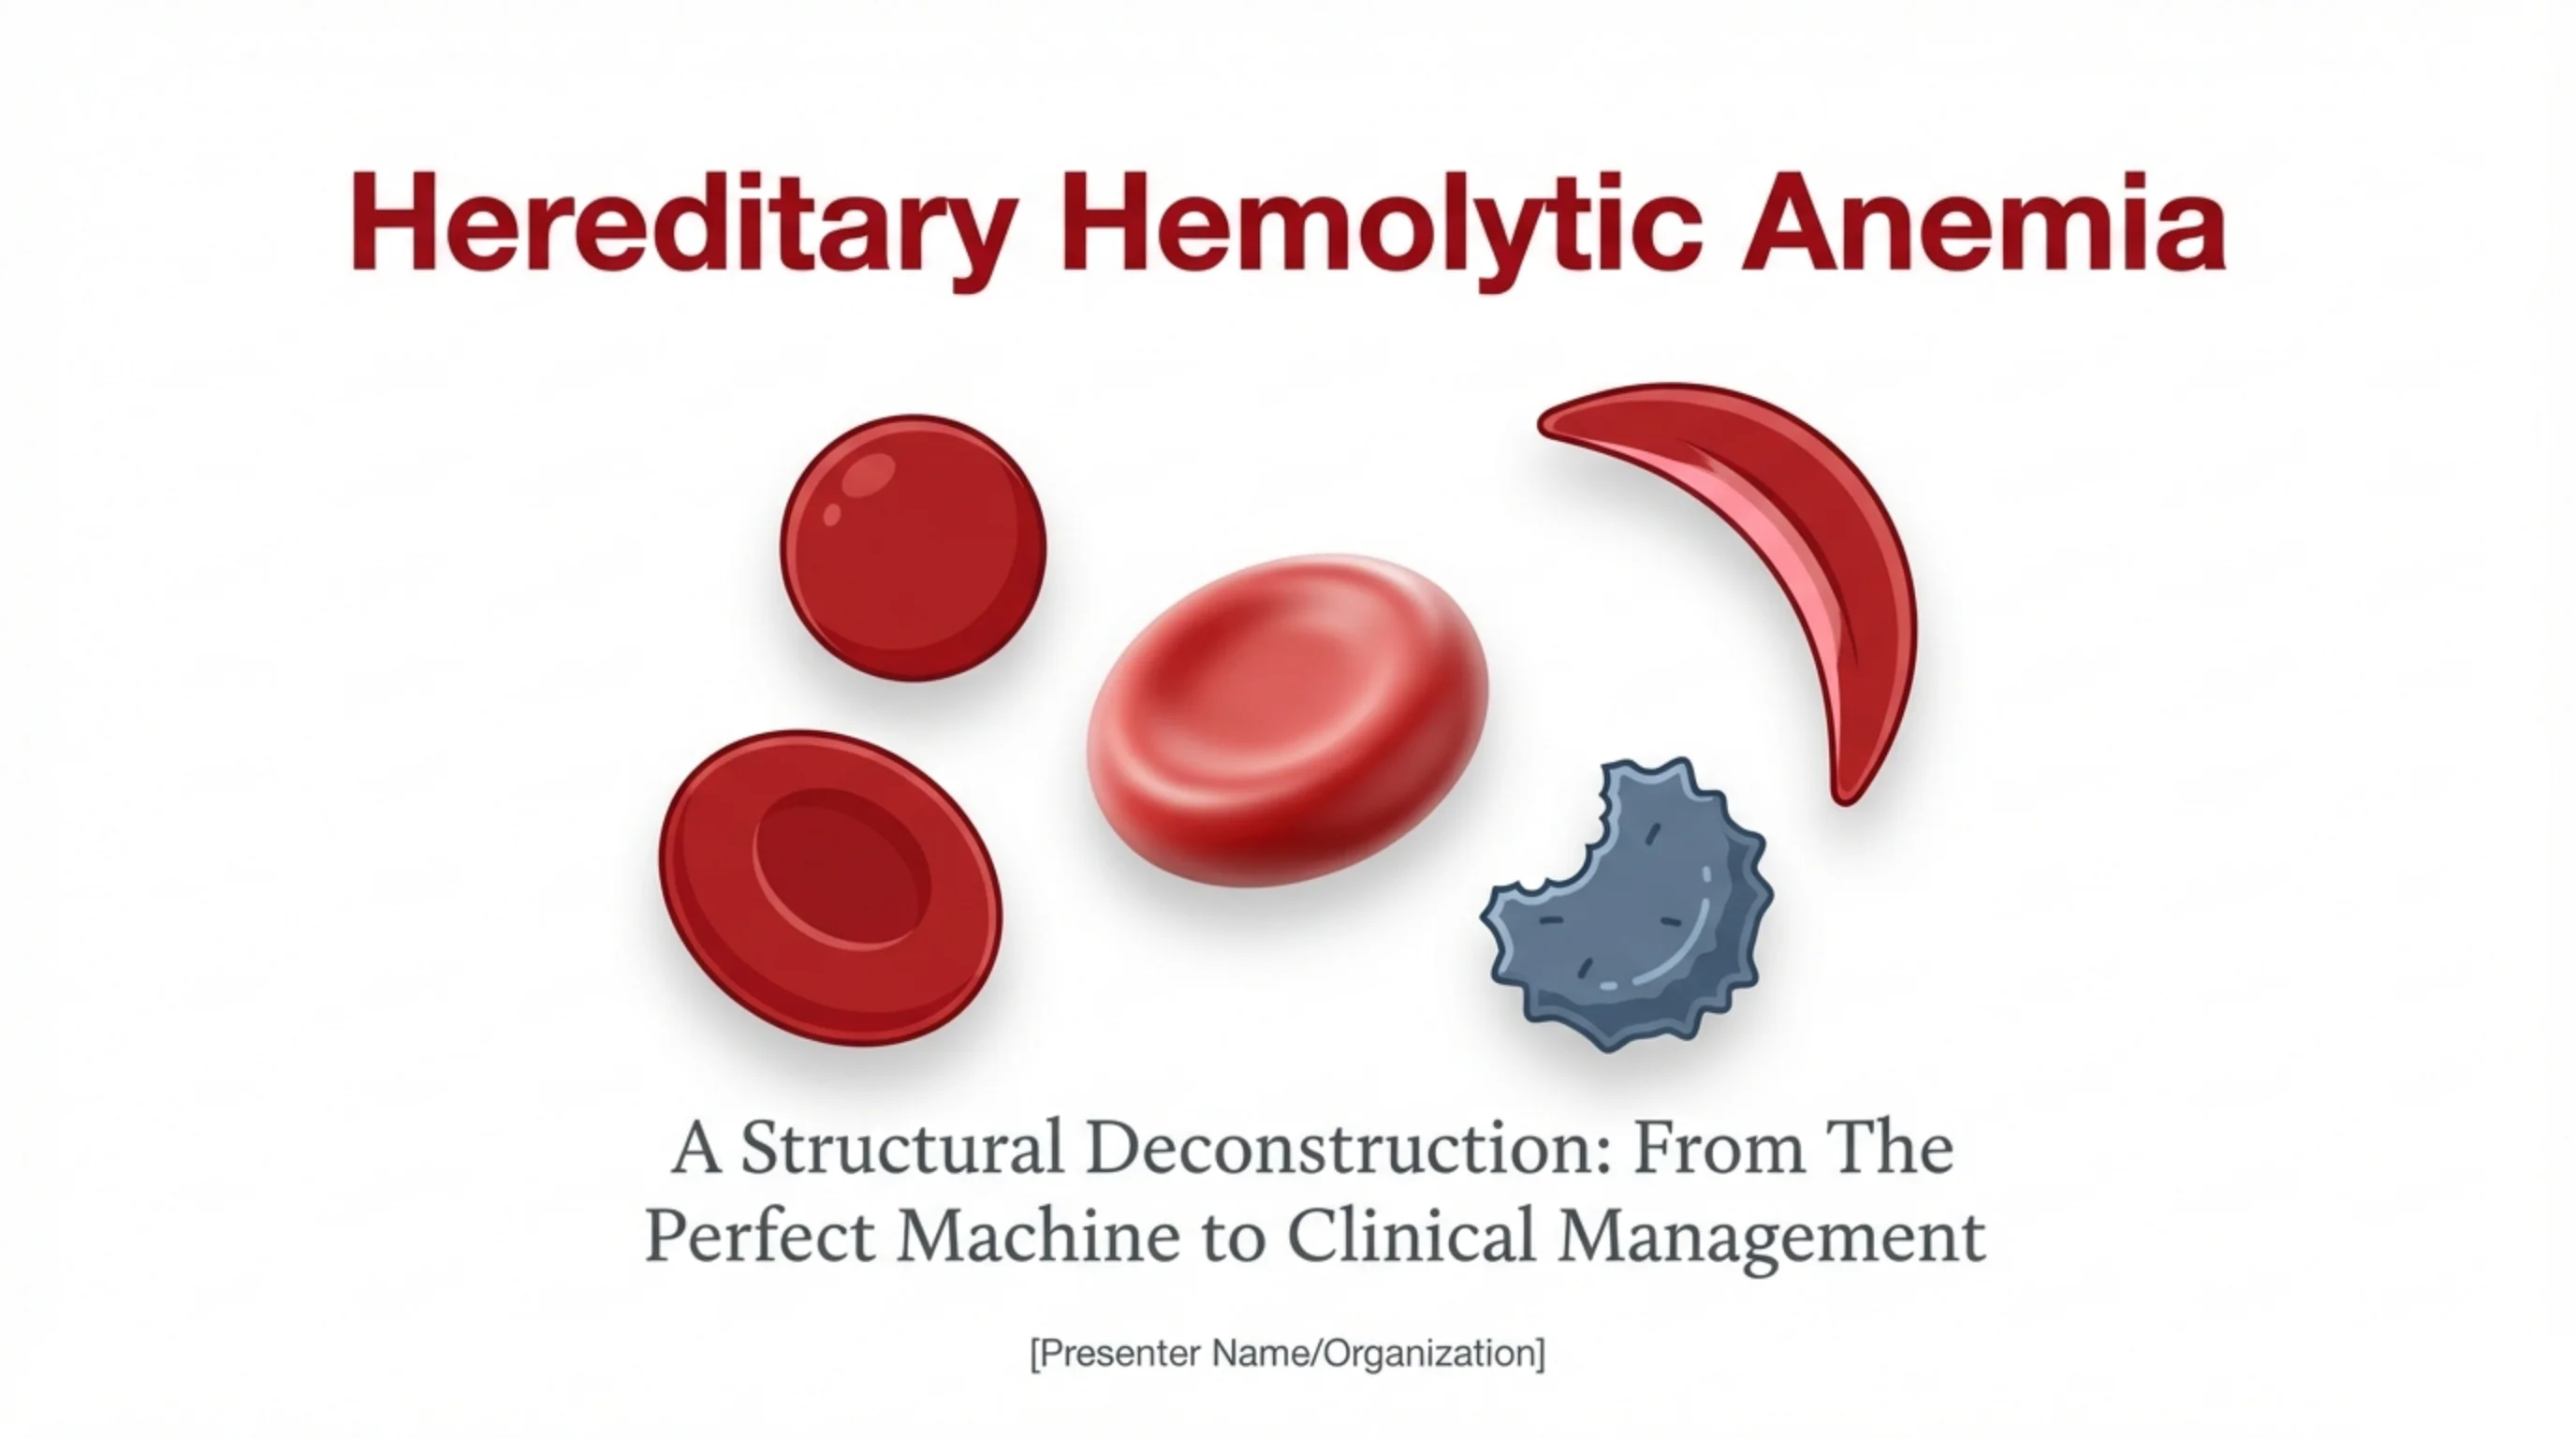
Hereditary Hemolytic Anemia
A Structural Deconstruction: From The Perfect Machine to Clinical Management
[Presenter Name/Organization]
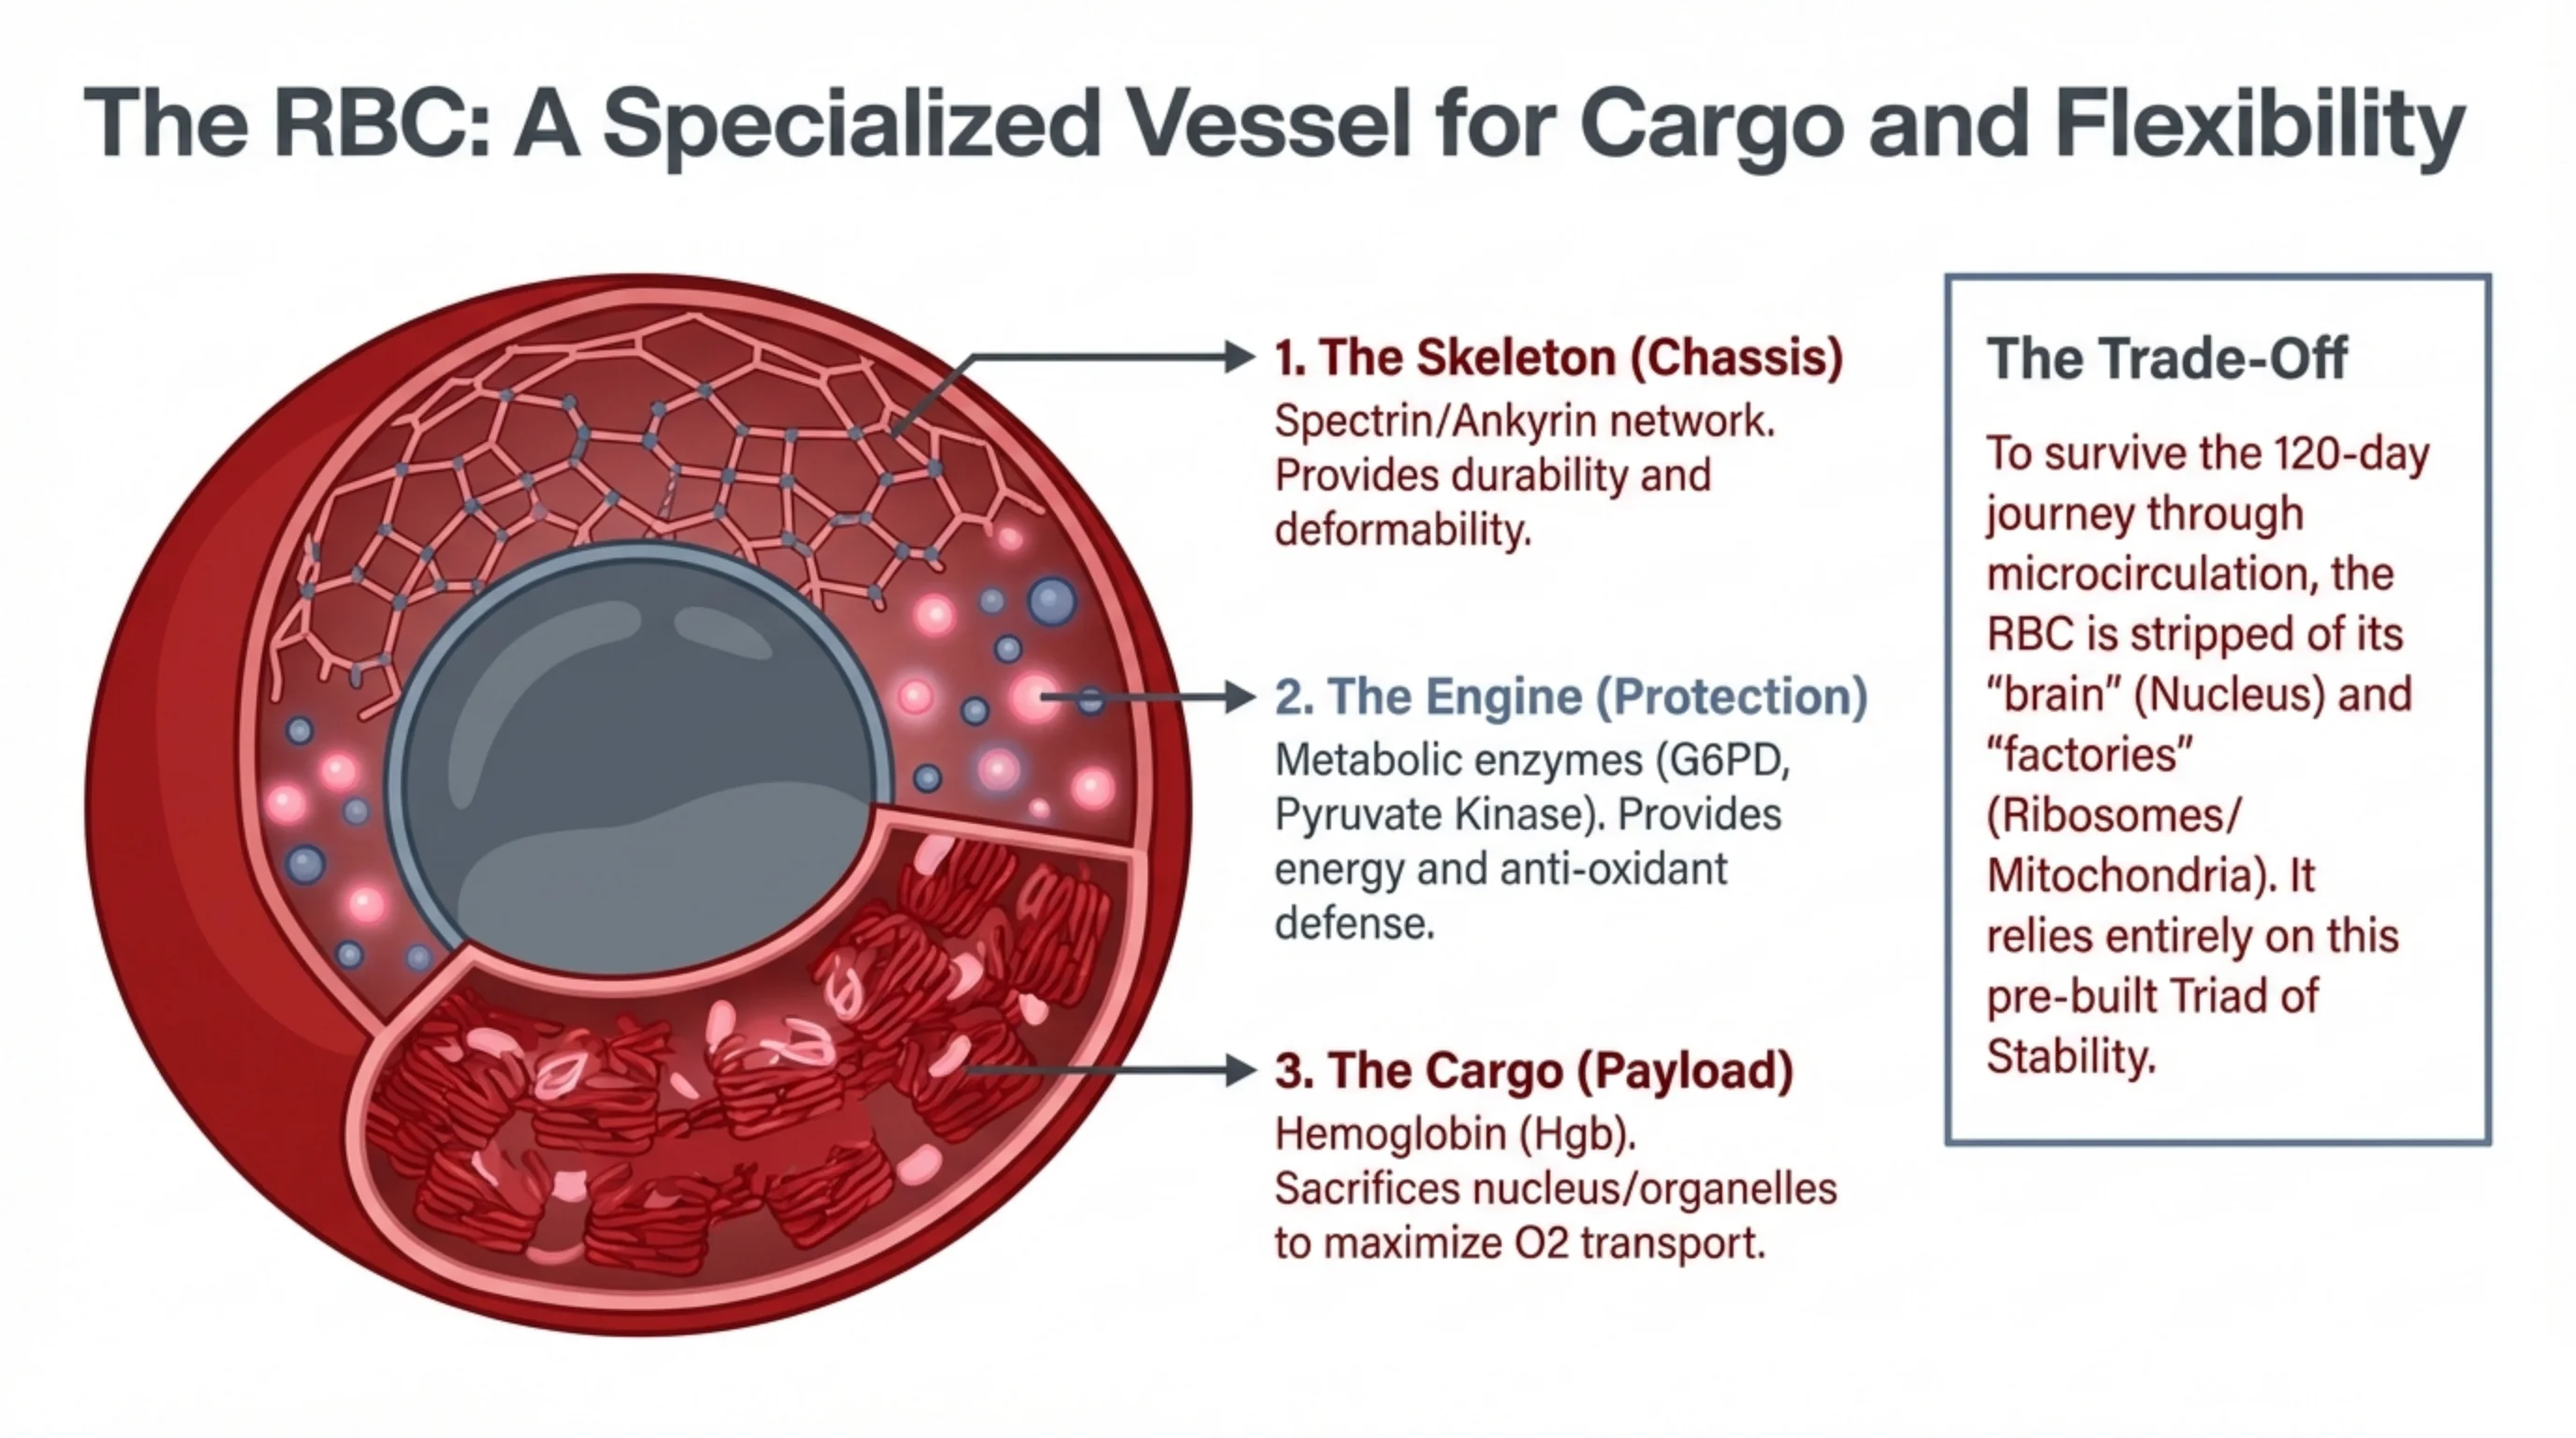
The RBC: A Specialized Vessel for Cargo and Flexibility
- 1. The Skeleton (Chassis) — Spectrin/Ankyrin network. Provides durability and deformability.
- 2. The Engine (Protection) — Metabolic enzymes (G6PD, Pyruvate Kinase). Provides energy and anti-oxidant defense.
- 3. The Cargo (Payload) — Hemoglobin (Hgb). Sacrifices nucleus/organelles to maximize O2 transport.
The Trade-Off
To survive the 120-day journey through microcirculation, the RBC is stripped of its “brain” (Nucleus) and “factories” (Ribosomes/Mitochondria). It relies entirely on this pre-built Triad of Stability.
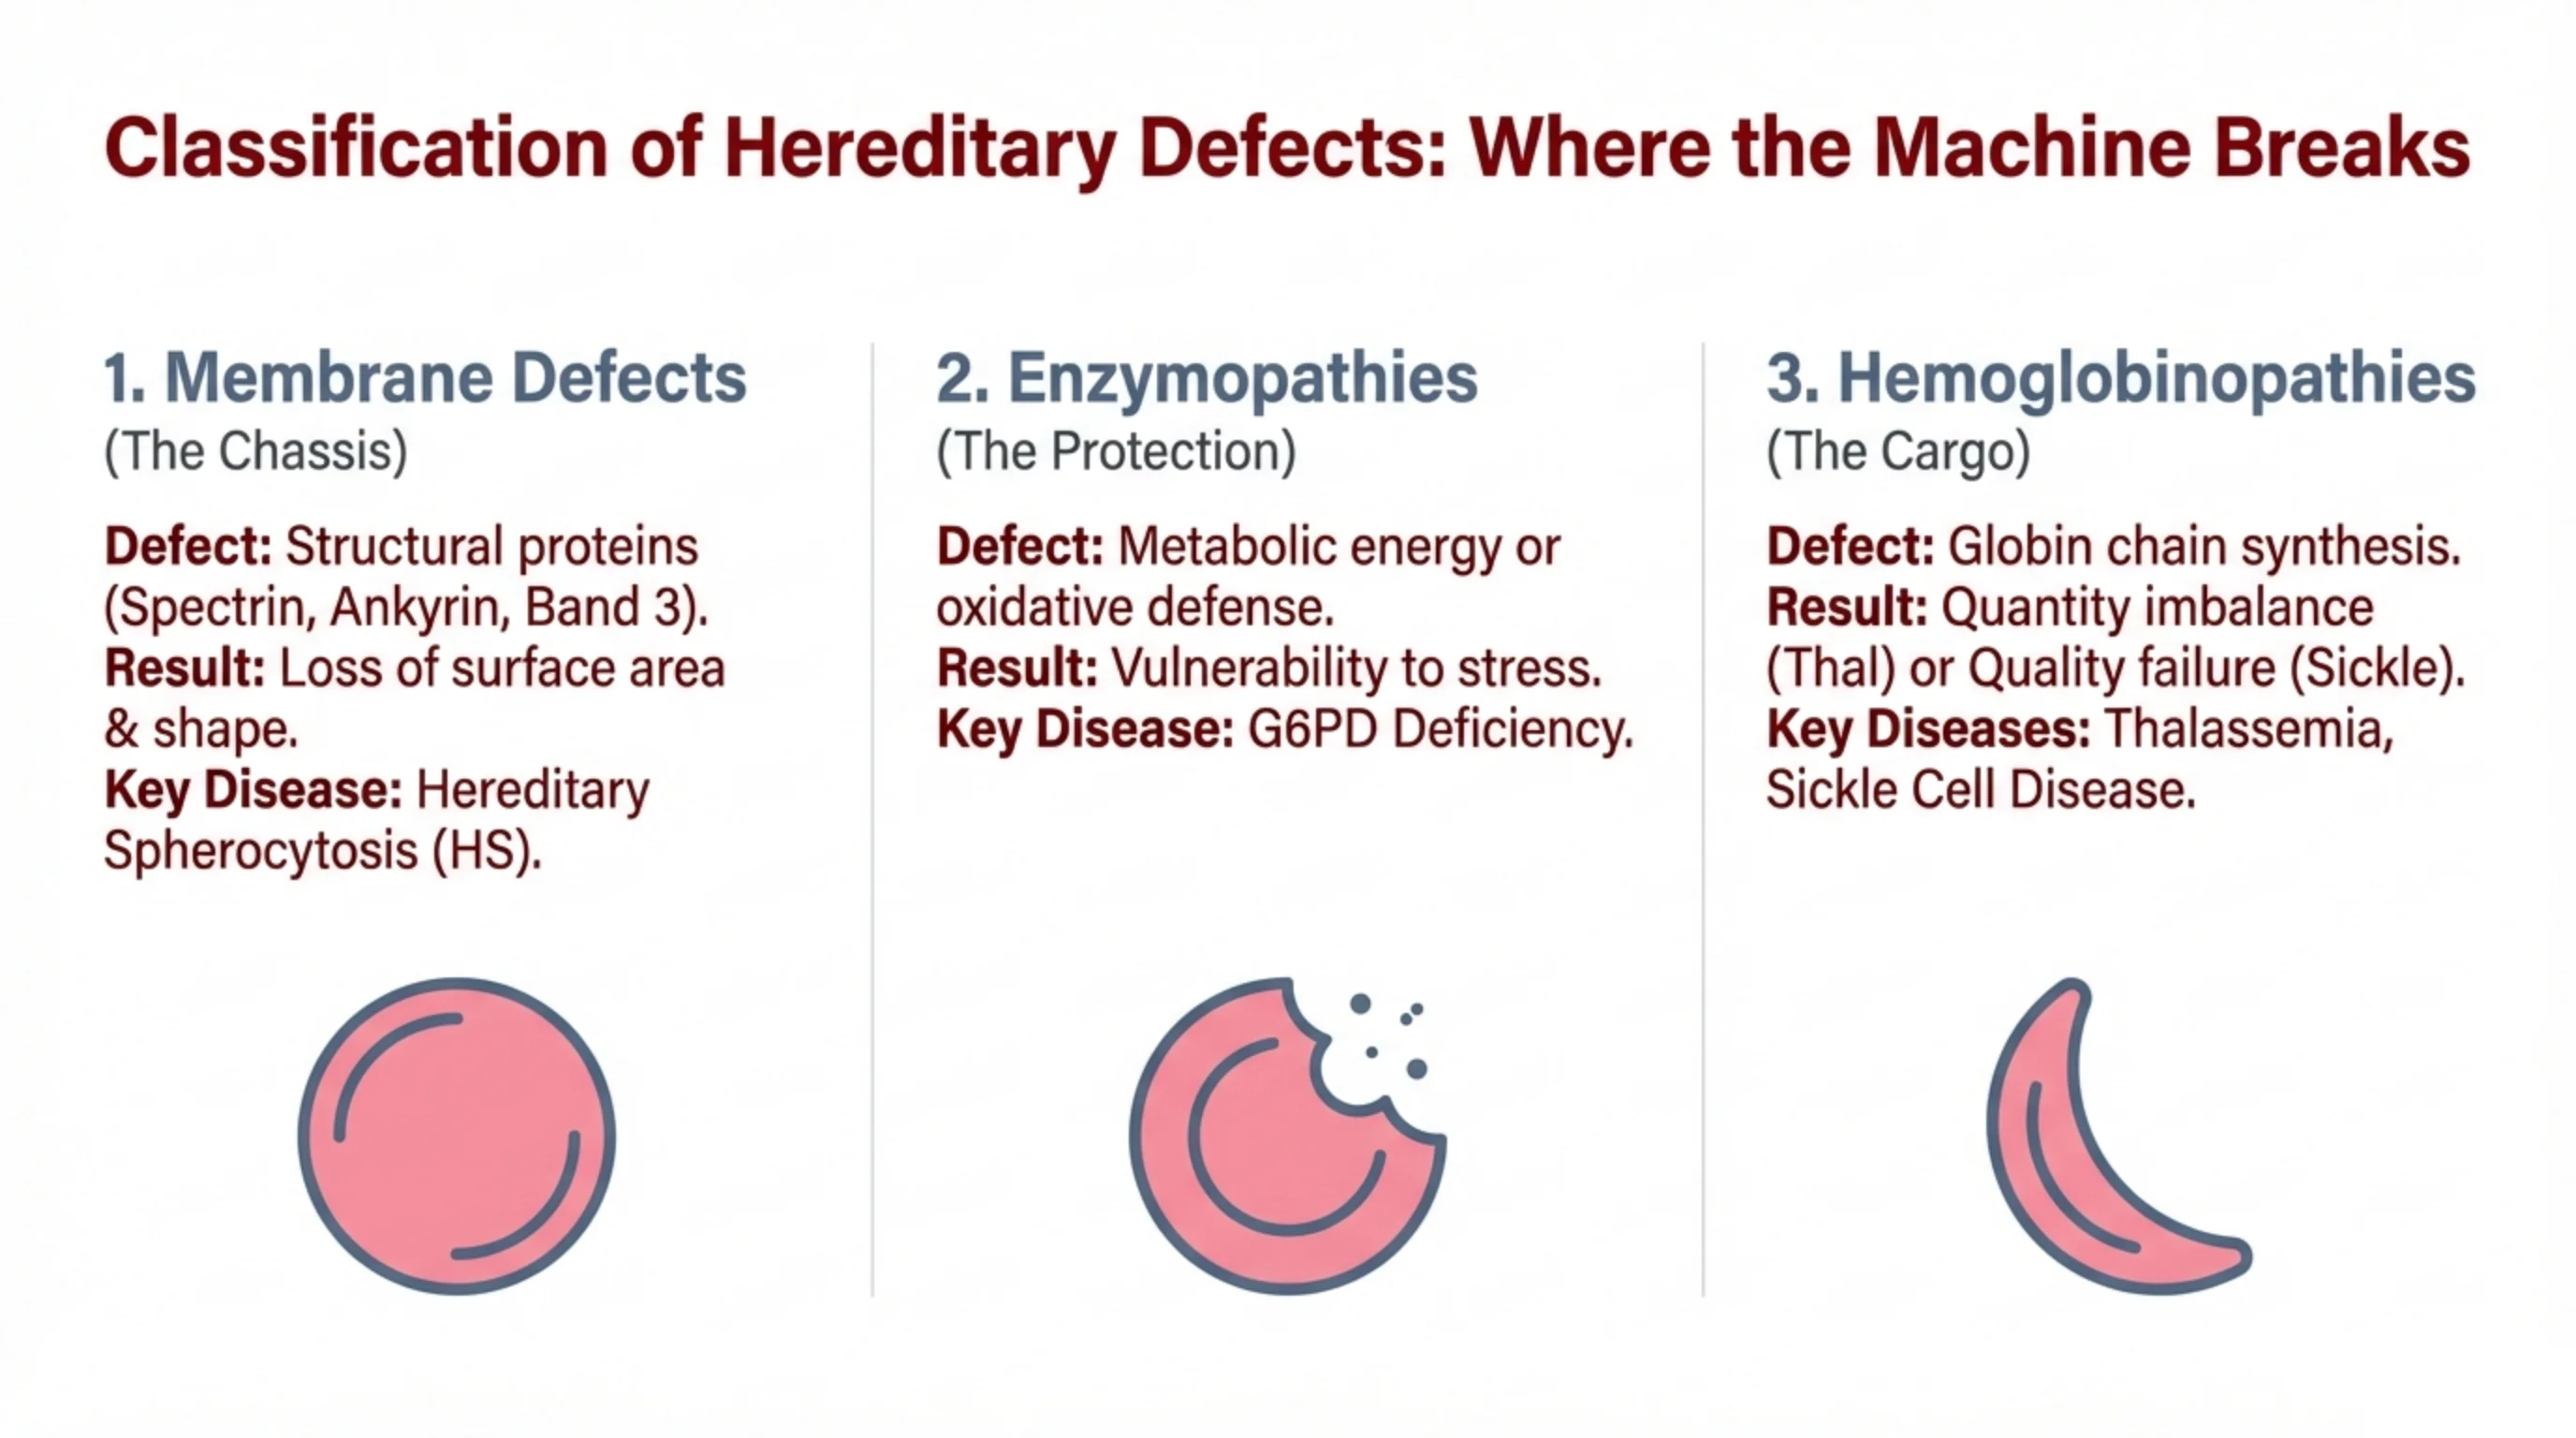
Classification of Hereditary Defects: Where the Machine Breaks
1. Membrane Defects (The Chassis)
- Defect: Structural proteins (Spectrin, Ankyrin, Band 3).
- Result: Loss of surface area & shape.
- Key Disease: Hereditary Spherocytosis (HS).
2. Enzymopathies (The Protection)
- Defect: Metabolic energy or oxidative defense.
- Result: Vulnerability to stress.
- Key Disease: G6PD Deficiency.
3. Hemoglobinopathies (The Cargo)
- Defect: Globin chain synthesis.
- Result: Quantity imbalance (Thal) or Quality failure (Sickle).
- Key Diseases: Thalassemia, Sickle Cell Disease.
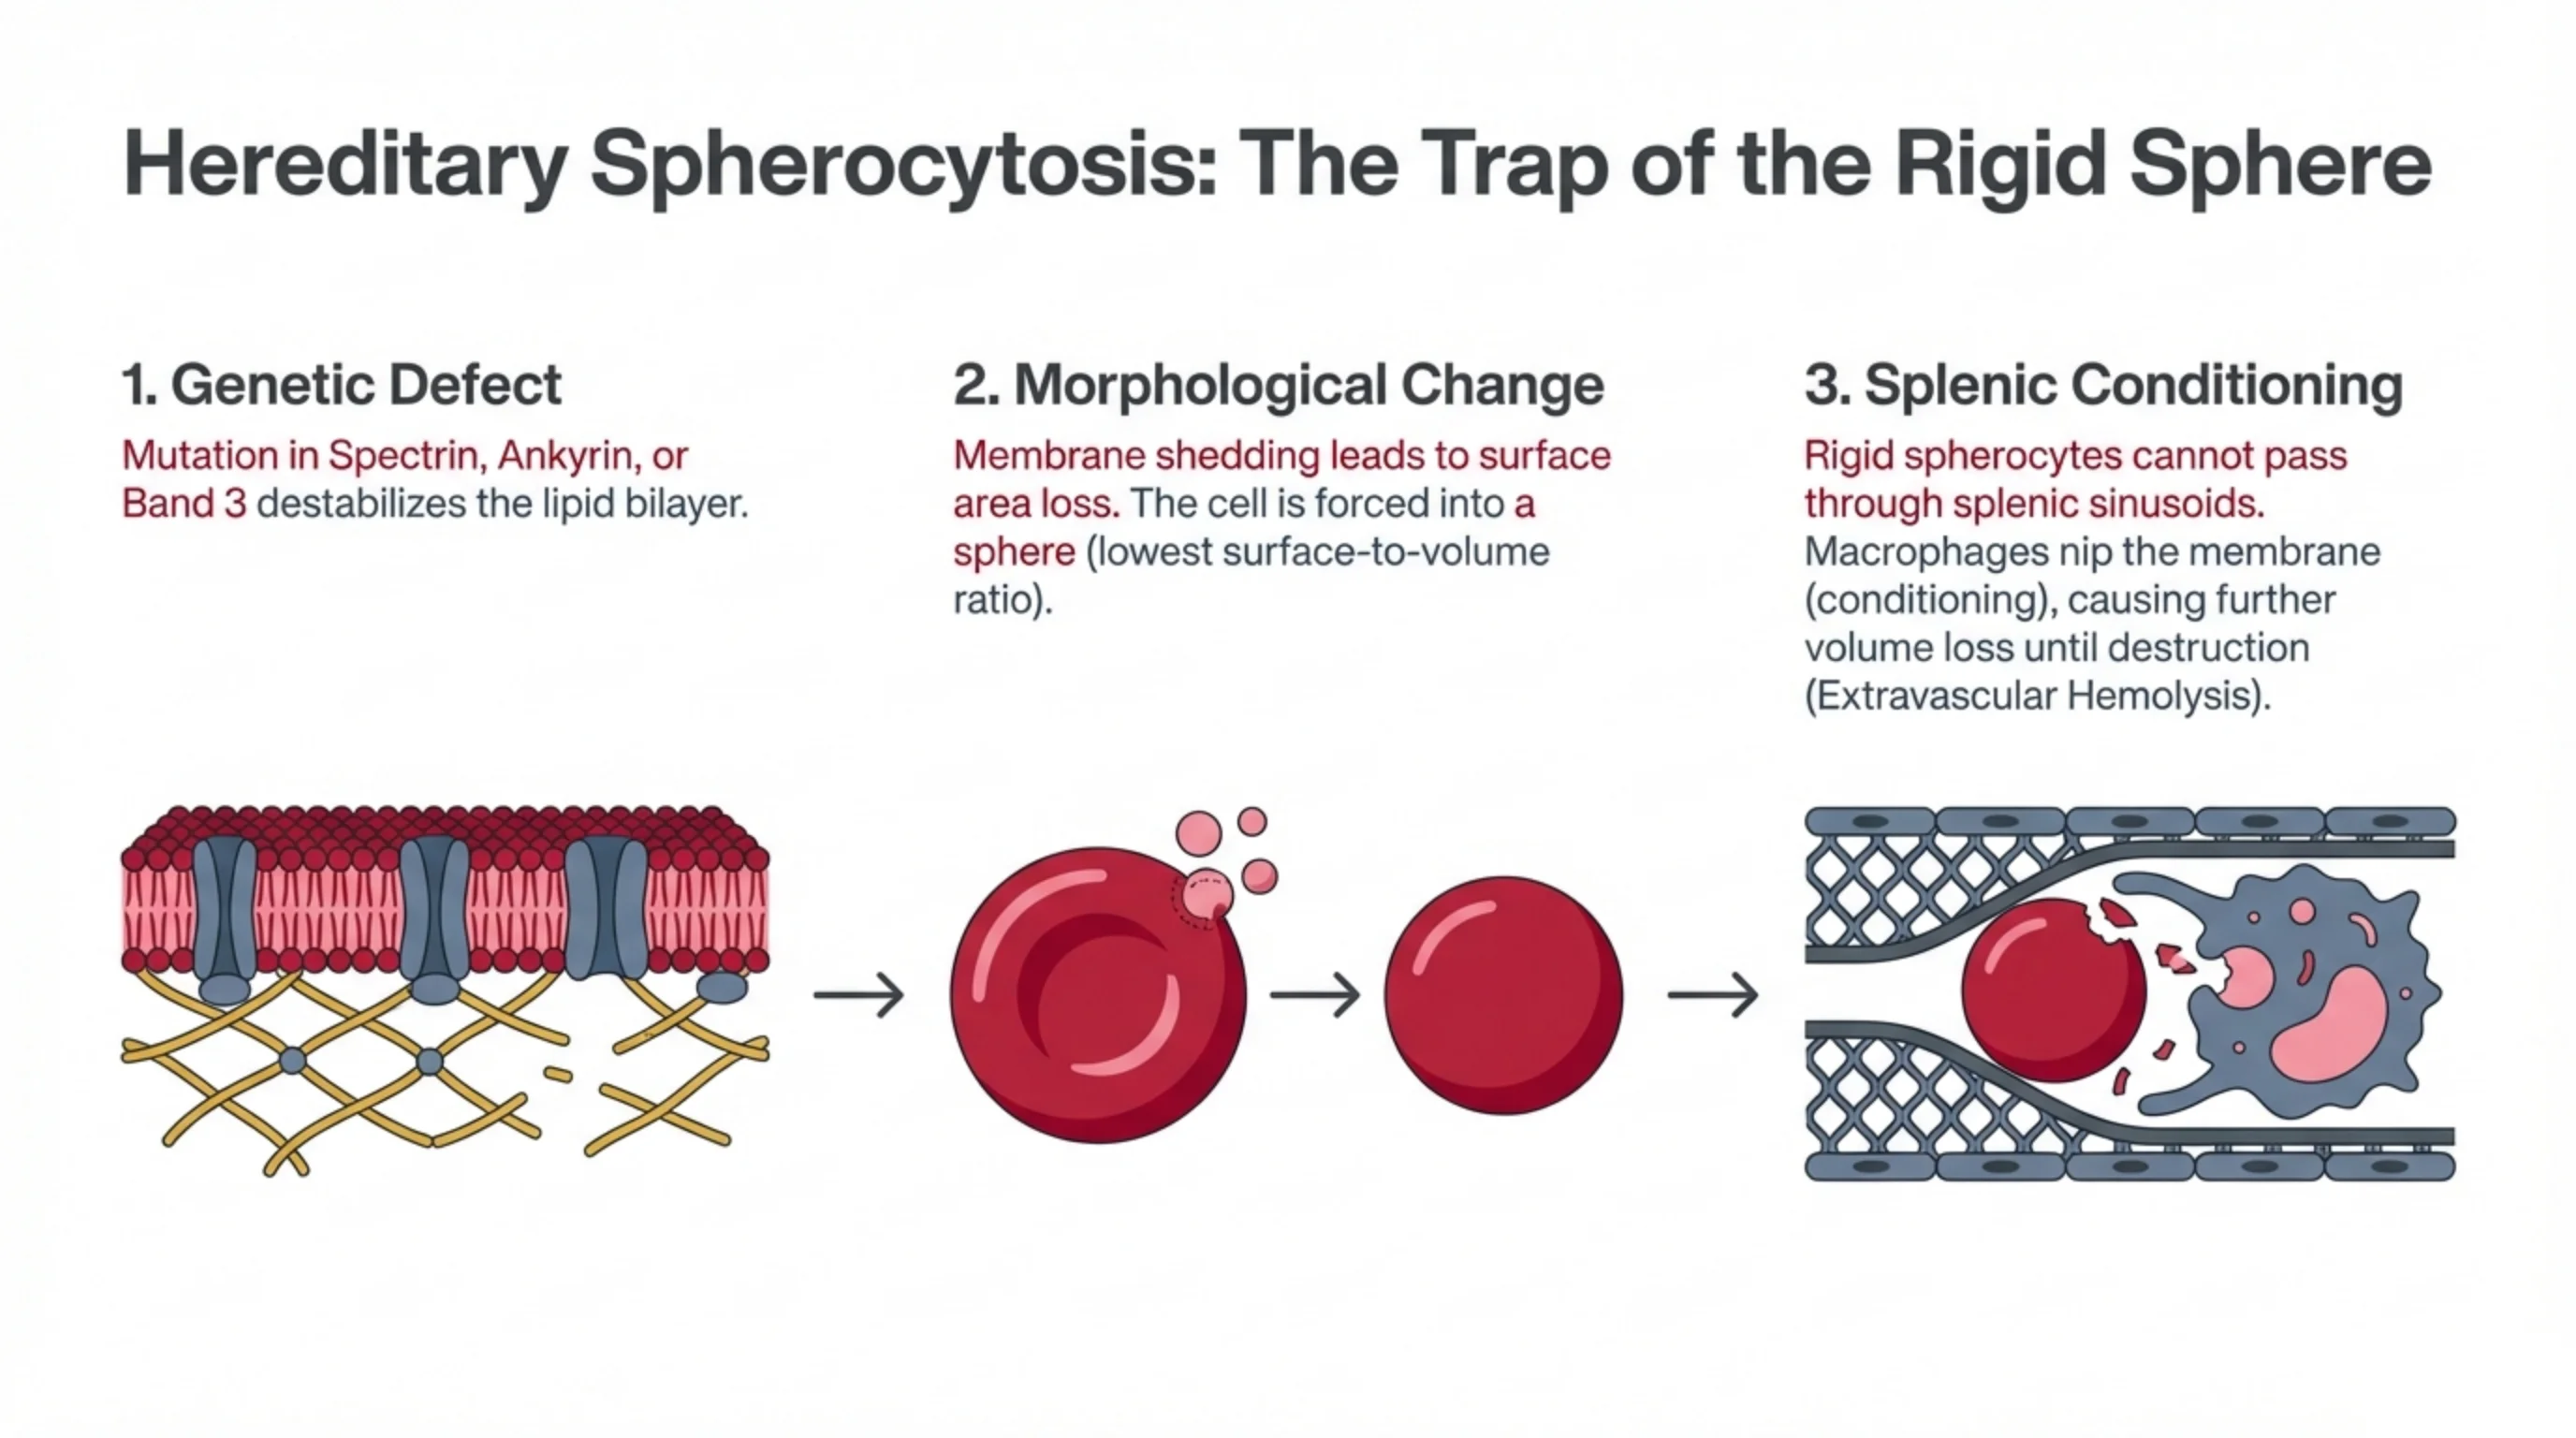
Hereditary Spherocytosis: The Trap of the Rigid Sphere
1. Genetic Defect
Mutation in Spectrin, Ankyrin, or Band 3 destabilizes the lipid bilayer.
2. Morphological Change
Membrane shedding leads to surface area loss. The cell is forced into a sphere (lowest surface-to-volume ratio).
3. Splenic Conditioning
Rigid spherocytes cannot pass through splenic sinusoids. Macrophages nip the membrane (conditioning), causing further volume loss until destruction (Extravascular Hemolysis).
Flow: Lipid bilayer / spectrin defect → biconcave cell sheds membrane vesicles → rigid sphere → trapped and partially engulfed by splenic macrophage in the sinusoid.
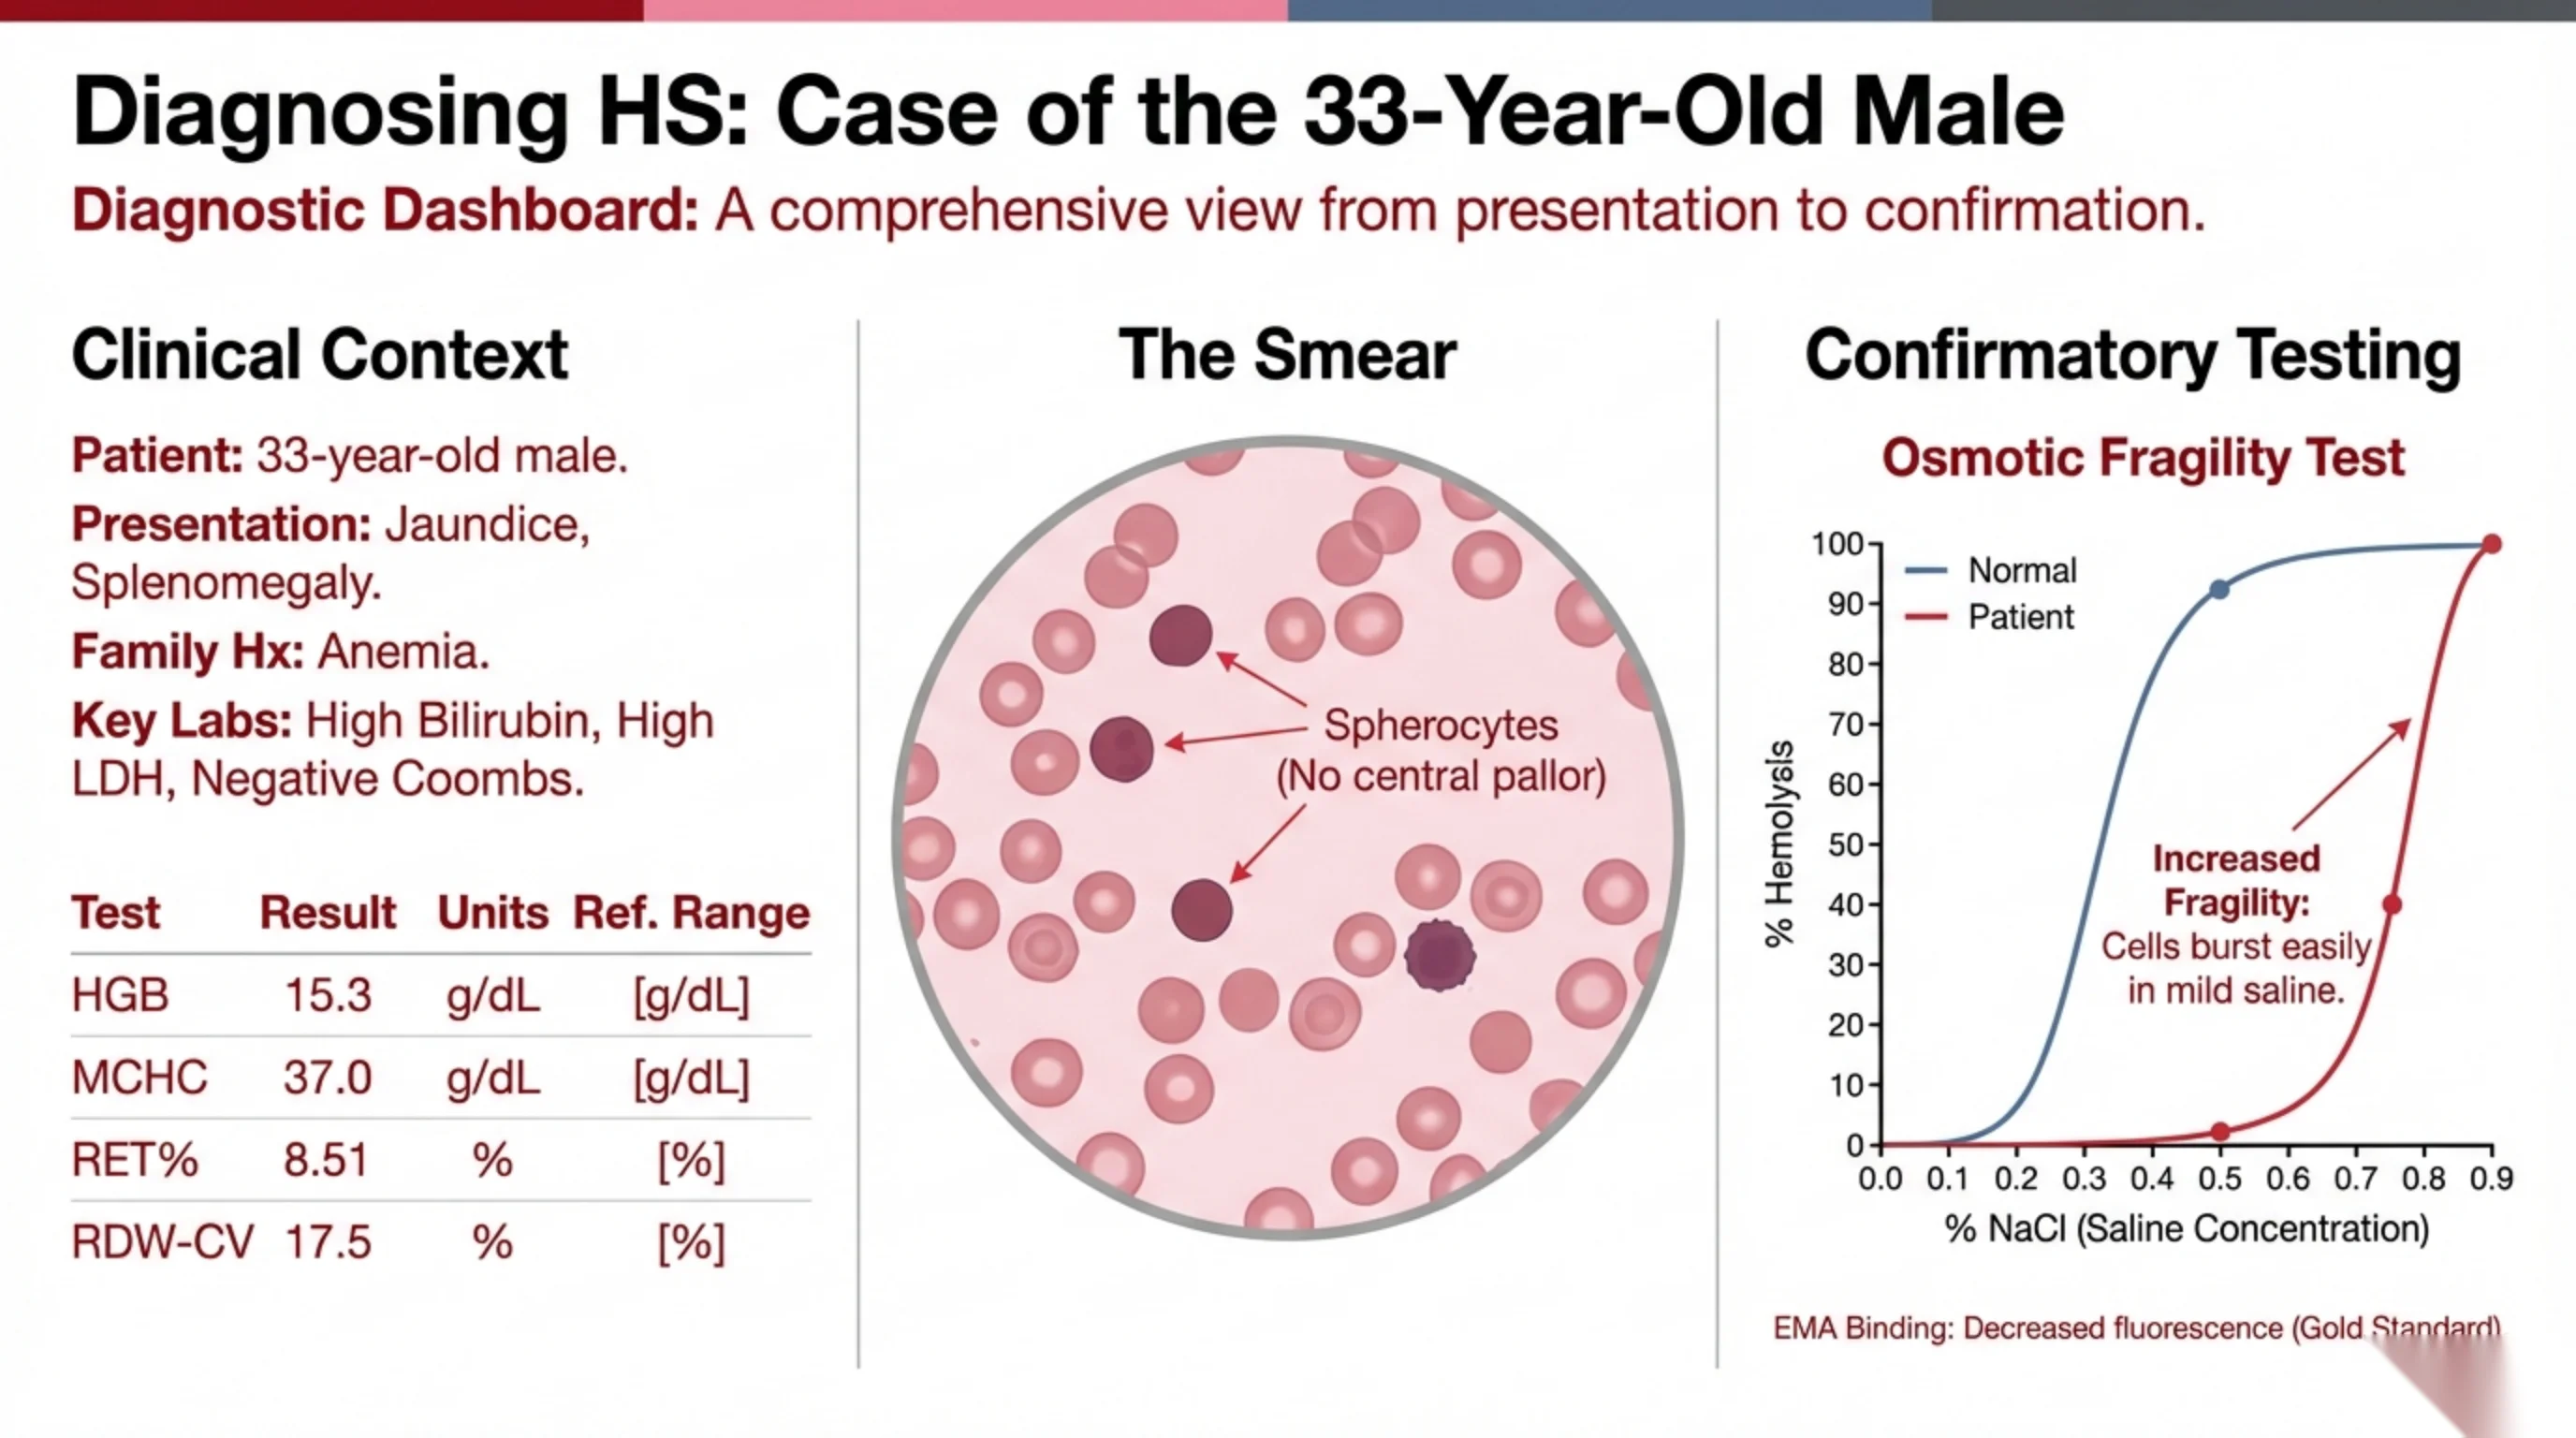
Diagnosing HS: Case of the 33-Year-Old Male
Diagnostic Dashboard: A comprehensive view from presentation to confirmation.
Clinical Context
- Patient: 33-year-old male.
- Presentation: Jaundice, Splenomegaly.
- Family Hx: Anemia.
- Key Labs: High Bilirubin, High LDH, Negative Coombs.
| Test | Result | Units | Ref. Range |
|---|---|---|---|
| HGB | 15.3 | g/dL | [g/dL] |
| MCHC | 37.0 | g/dL | [g/dL] |
| RET% | 8.51 | % | [%] |
| RDW-CV | 17.5 | % | [%] |
The Smear
Spherocytes (No central pallor).
Confirmatory Testing
Osmotic Fragility Test: Graph of % Hemolysis (y-axis, 0–100) versus % NaCl saline concentration (x-axis, 0.0–0.9). The Normal curve hemolyzes at lower saline concentration (leftward); the Patient curve is shifted right. Increased Fragility: Cells burst easily in mild saline.
EMA Binding: Decreased fluorescence (Gold Standard).
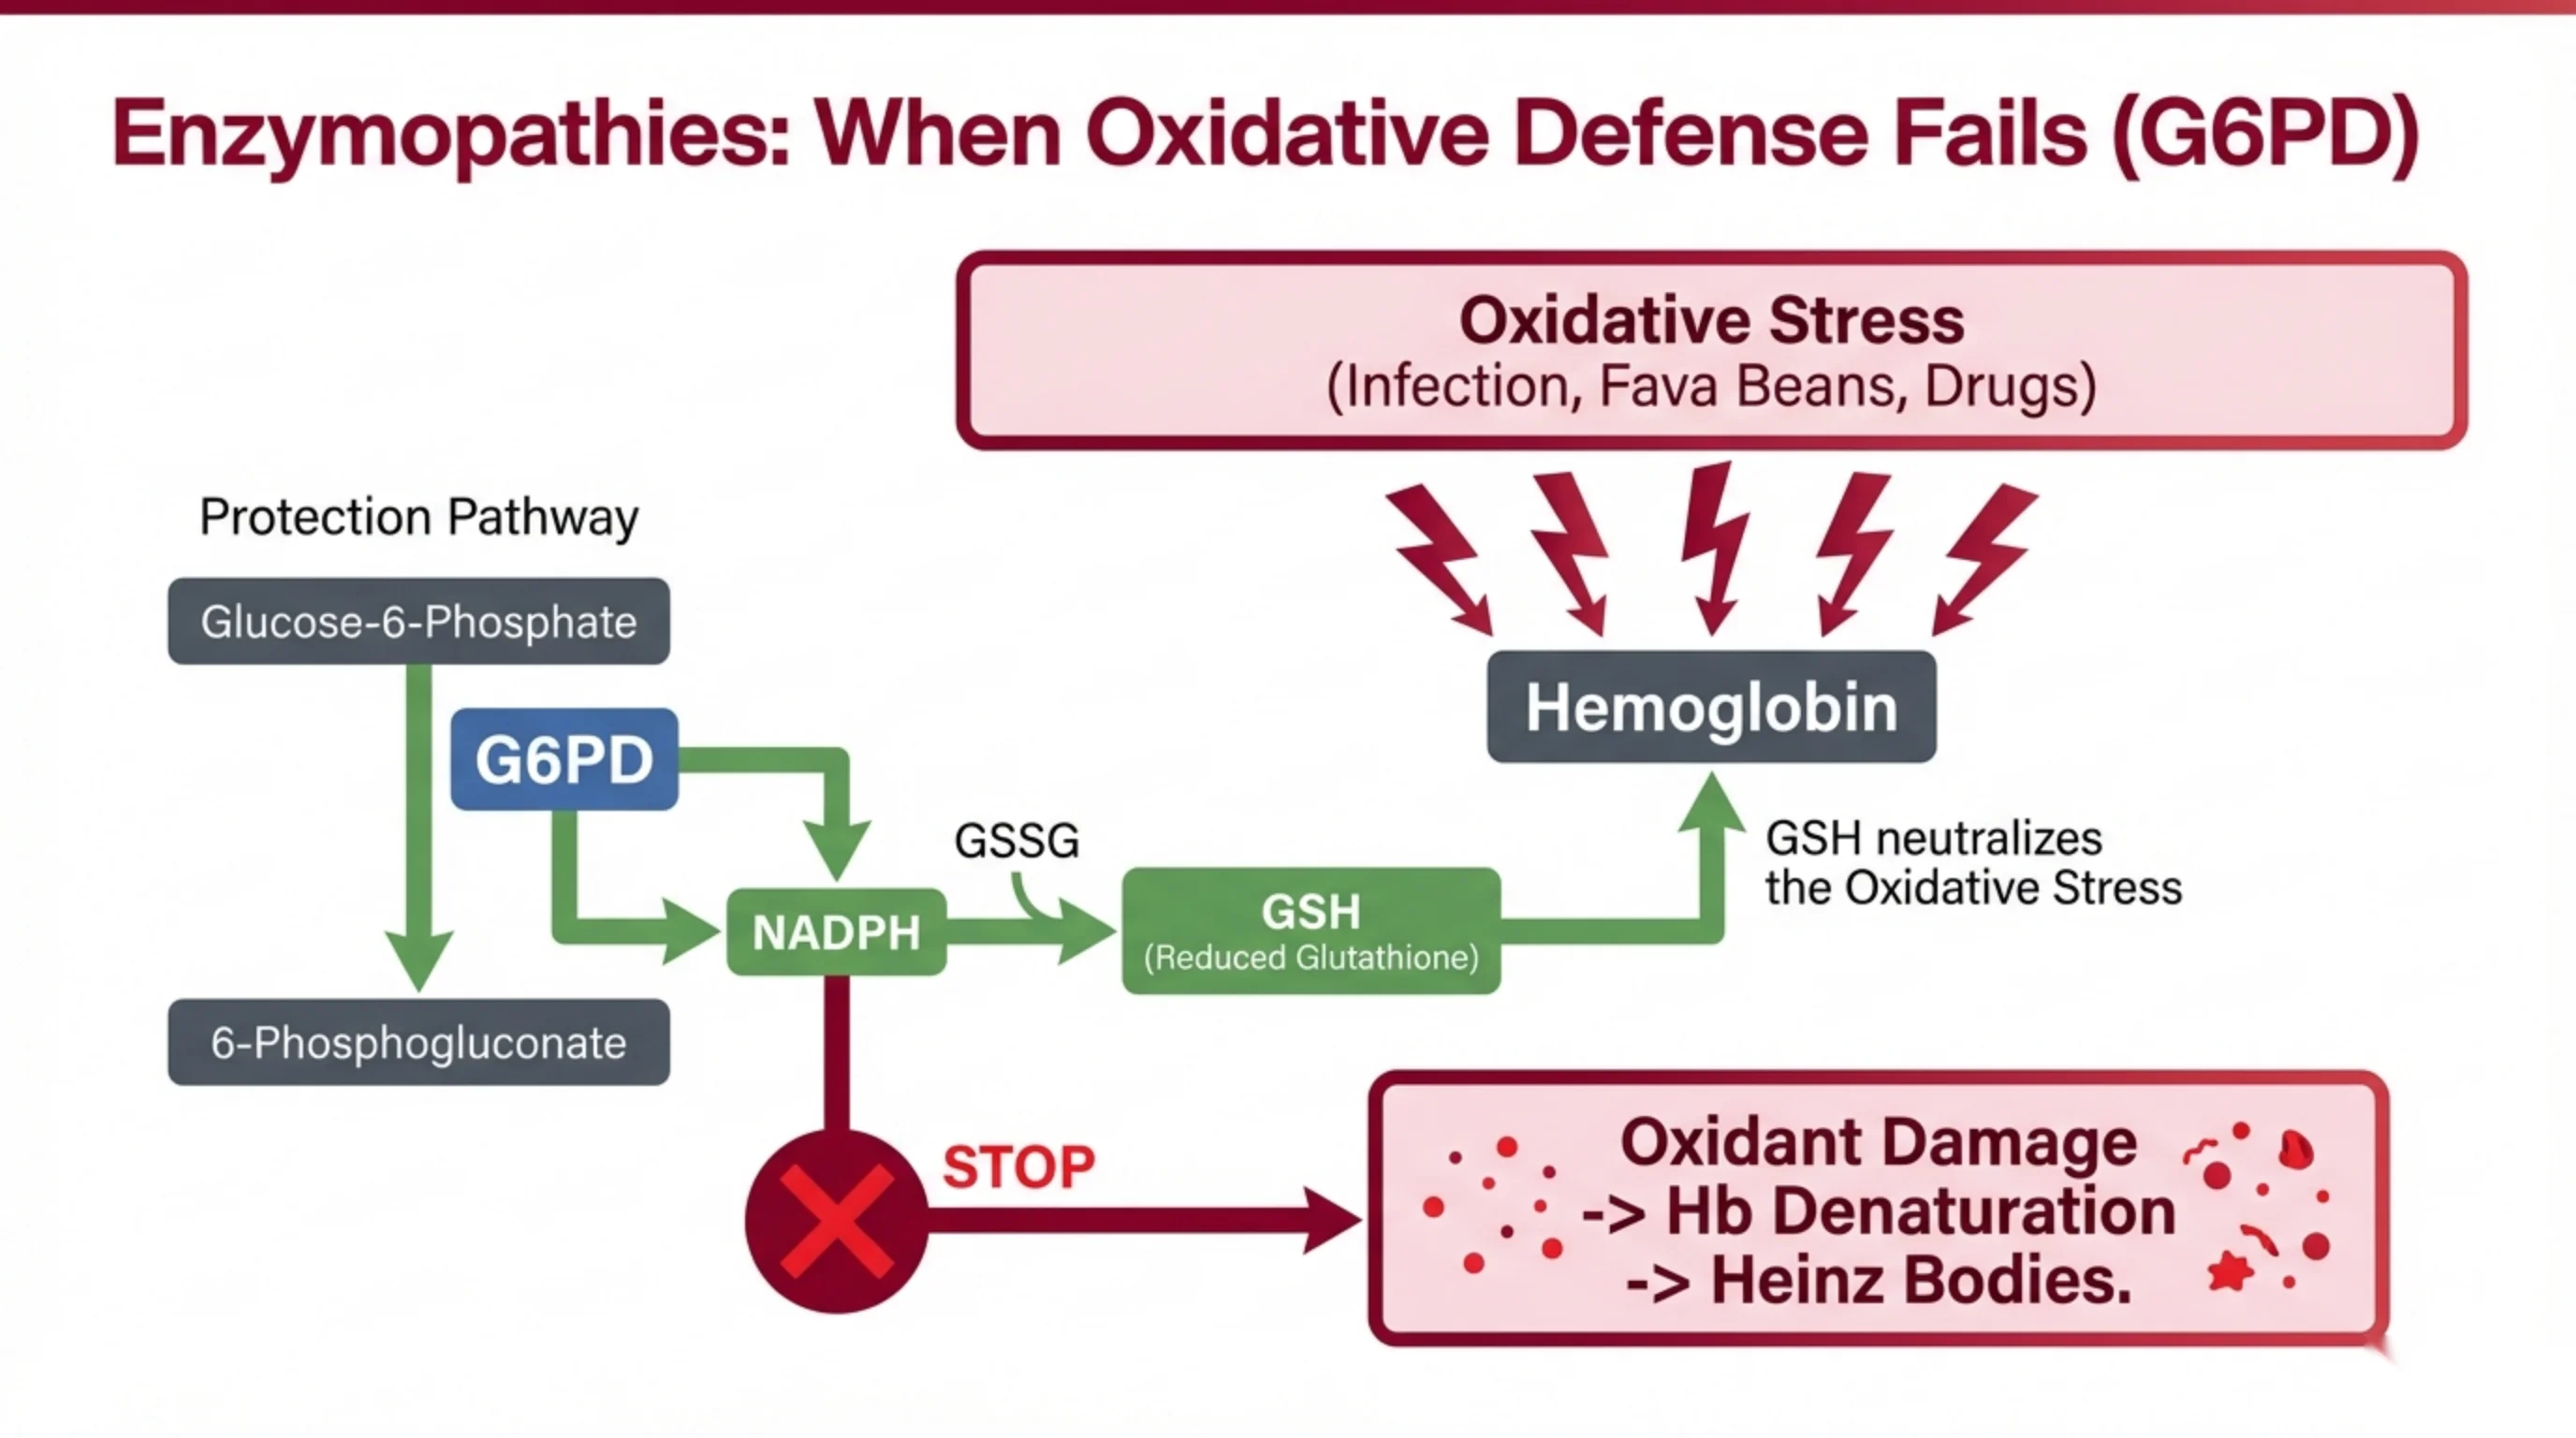
Enzymopathies: When Oxidative Defense Fails (G6PD)
Oxidative Stress (Infection, Fava Beans, Drugs) attacks Hemoglobin.
Protection Pathway: Glucose-6-Phosphate, via the enzyme G6PD, is converted to 6-Phosphogluconate, generating NADPH. NADPH regenerates GSH (Reduced Glutathione) from GSSG. GSH neutralizes the Oxidative Stress on Hemoglobin.
When G6PD is deficient (STOP): No NADPH → no GSH → Oxidant Damage → Hb Denaturation → Heinz Bodies.
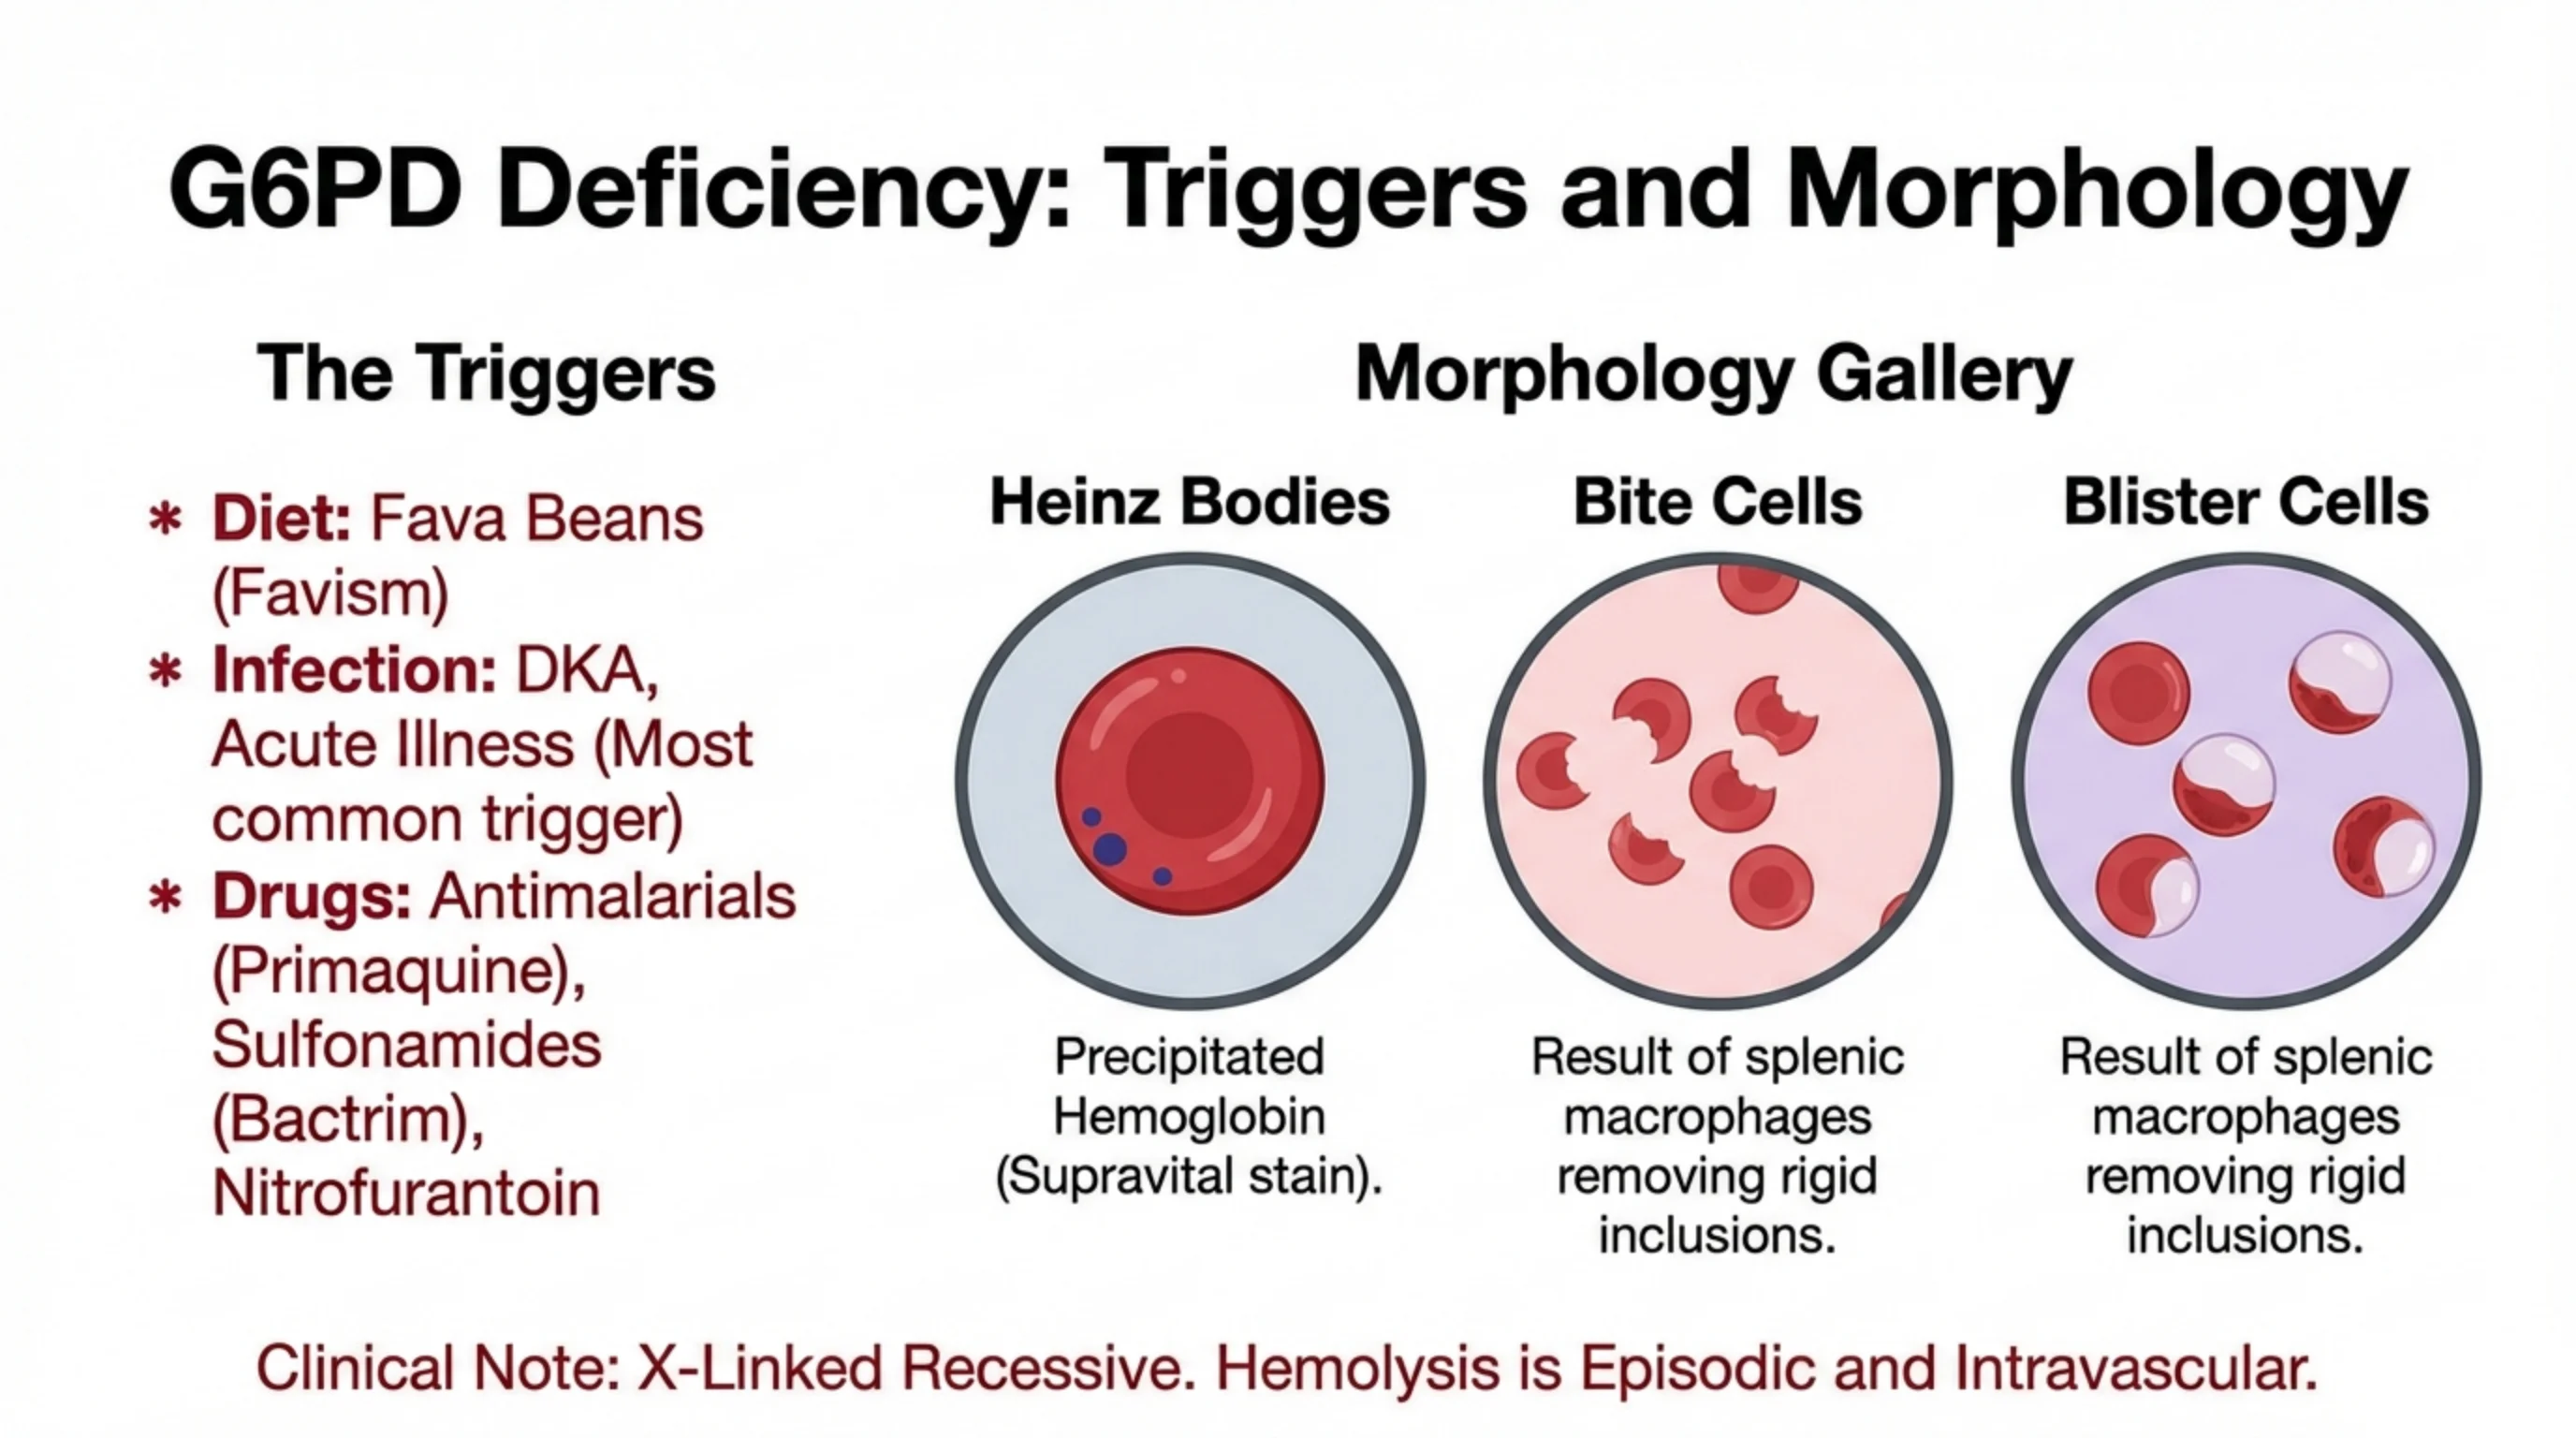
G6PD Deficiency: Triggers and Morphology
The Triggers
- Diet: Fava Beans (Favism)
- Infection: DKA, Acute Illness (Most common trigger)
- Drugs: Antimalarials (Primaquine), Sulfonamides (Bactrim), Nitrofurantoin
Morphology Gallery
| Finding | Description |
|---|---|
| Heinz Bodies | Precipitated Hemoglobin (Supravital stain). |
| Bite Cells | Result of splenic macrophages removing rigid inclusions. |
| Blister Cells | Result of splenic macrophages removing rigid inclusions. |
Clinical Note: X-Linked Recessive. Hemolysis is Episodic and Intravascular.
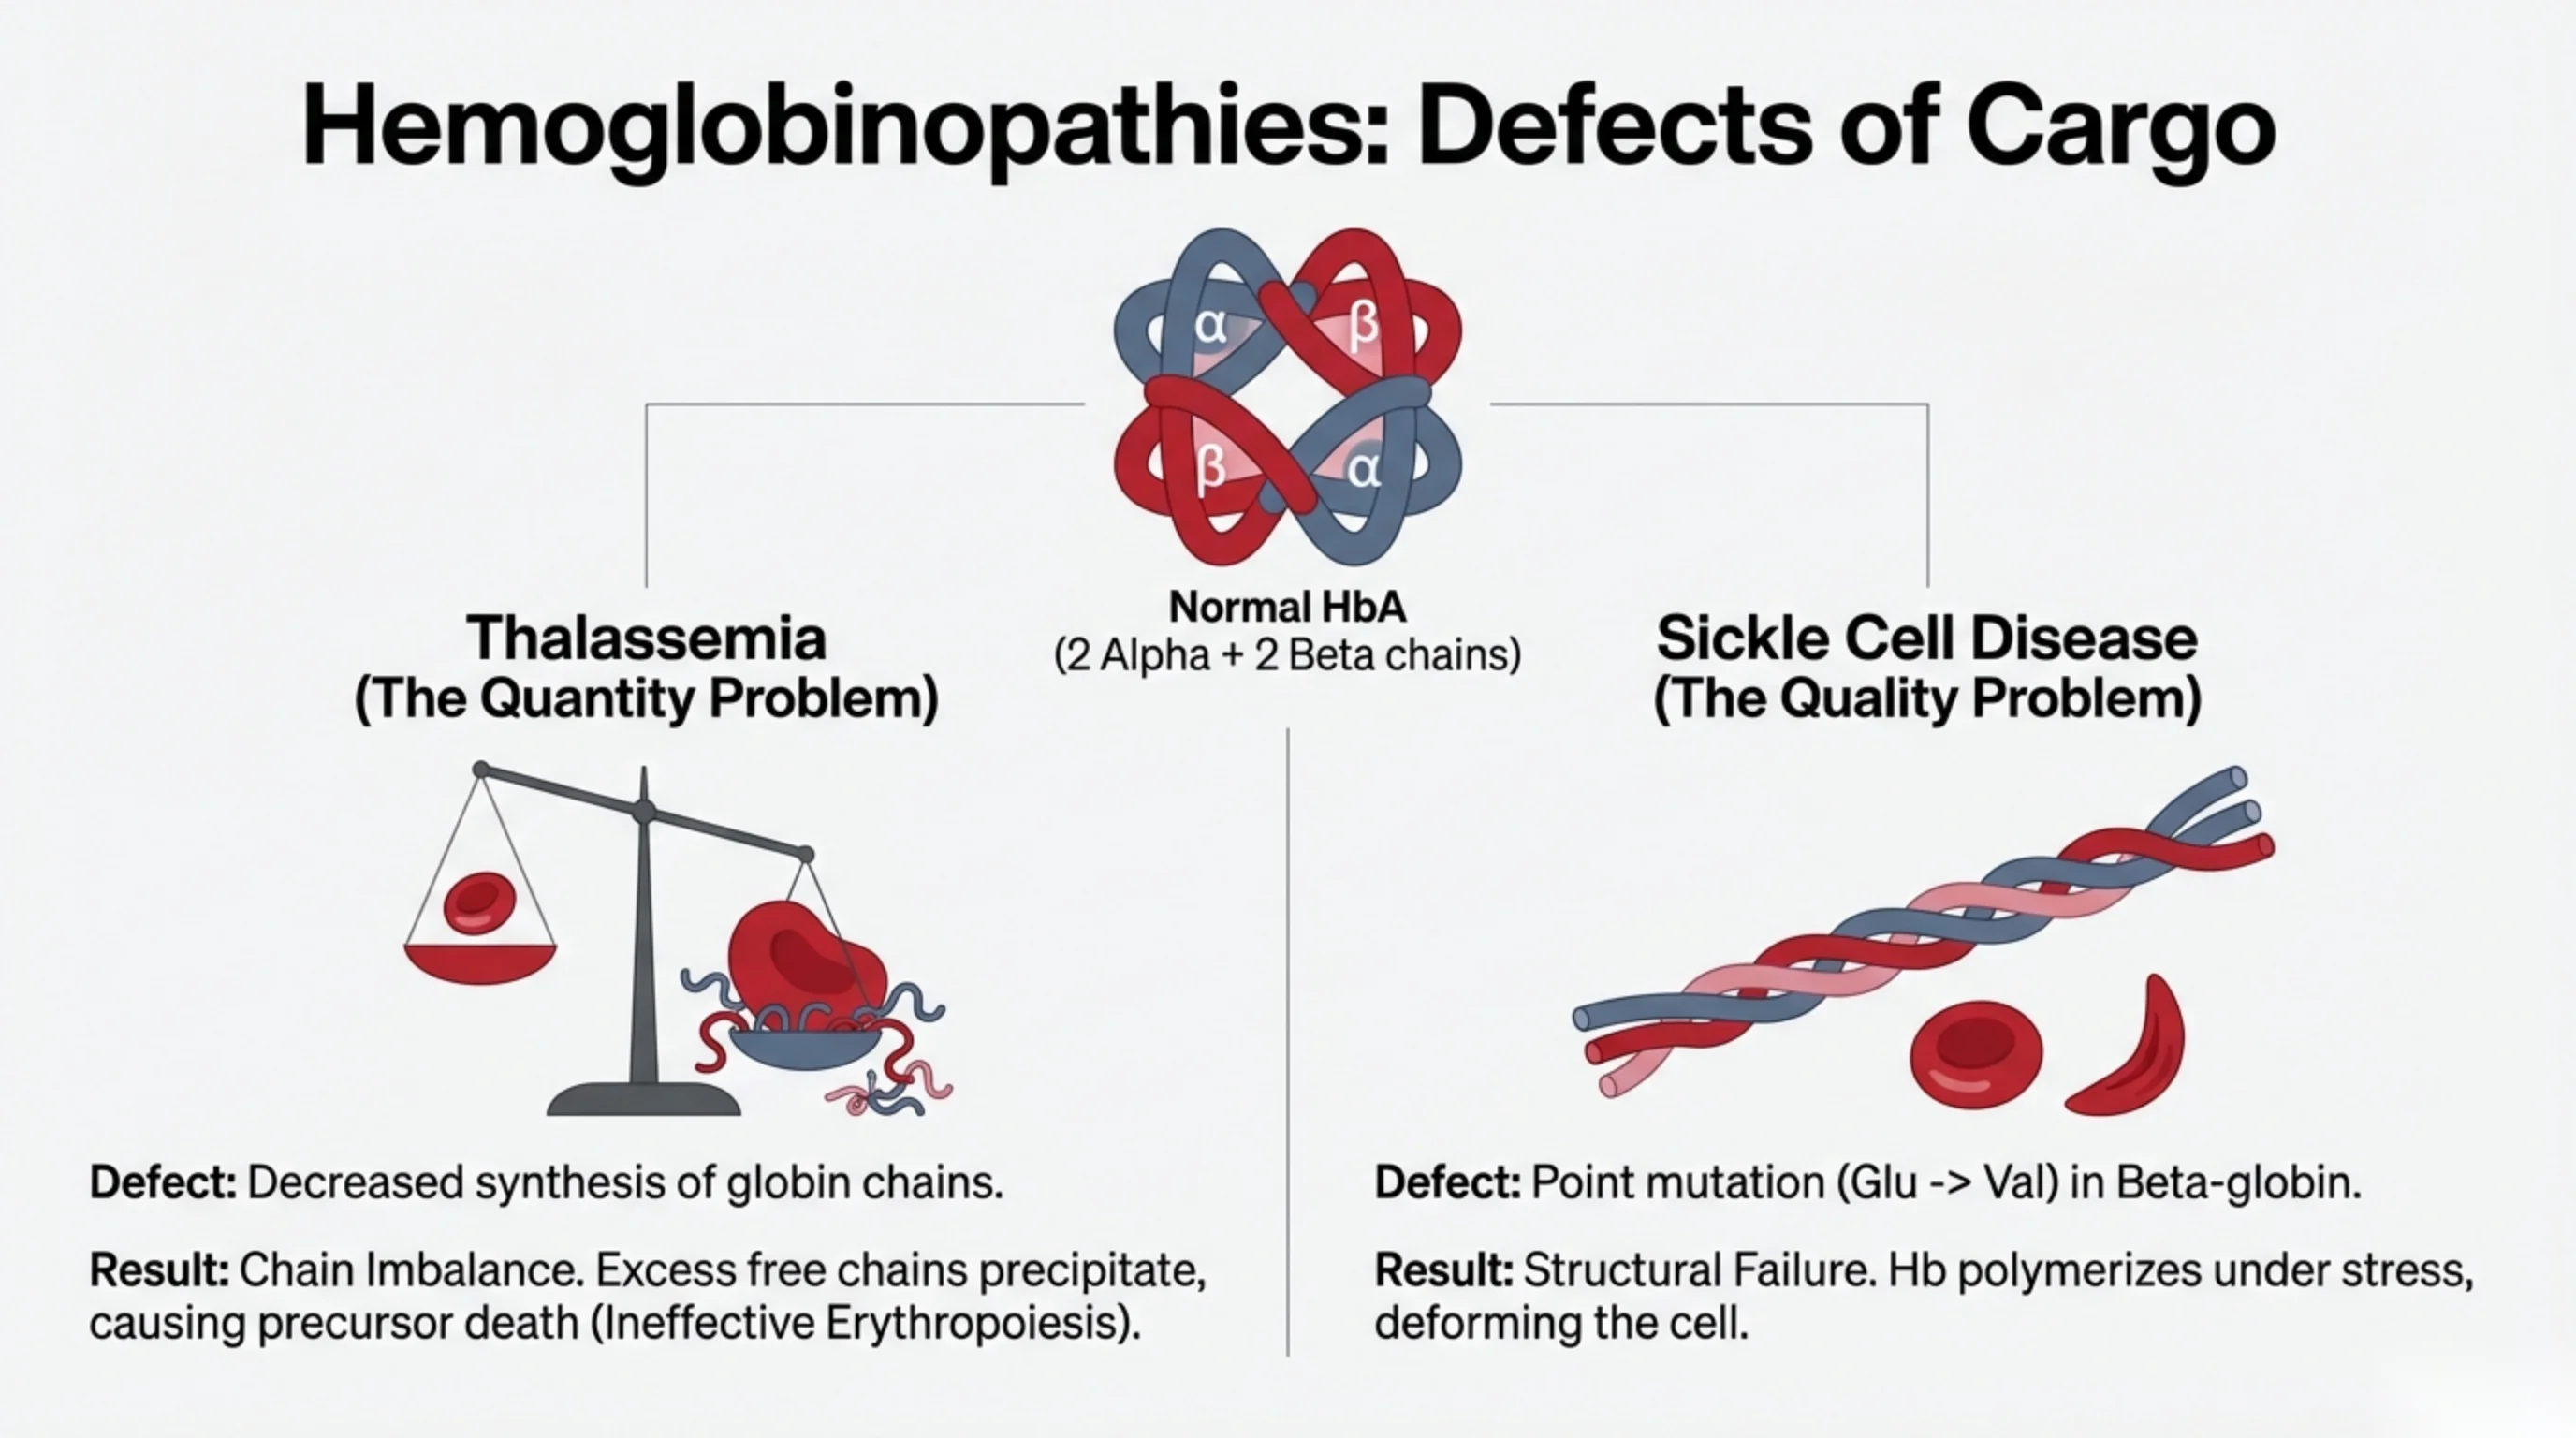
Hemoglobinopathies: Defects of Cargo
Normal HbA (2 Alpha + 2 Beta chains).
Thalassemia (The Quantity Problem)
- Defect: Decreased synthesis of globin chains.
- Result: Chain Imbalance. Excess free chains precipitate, causing precursor death (Ineffective Erythropoiesis).
Sickle Cell Disease (The Quality Problem)
- Defect: Point mutation (Glu -> Val) in Beta-globin.
- Result: Structural Failure. Hb polymerizes under stress, deforming the cell.
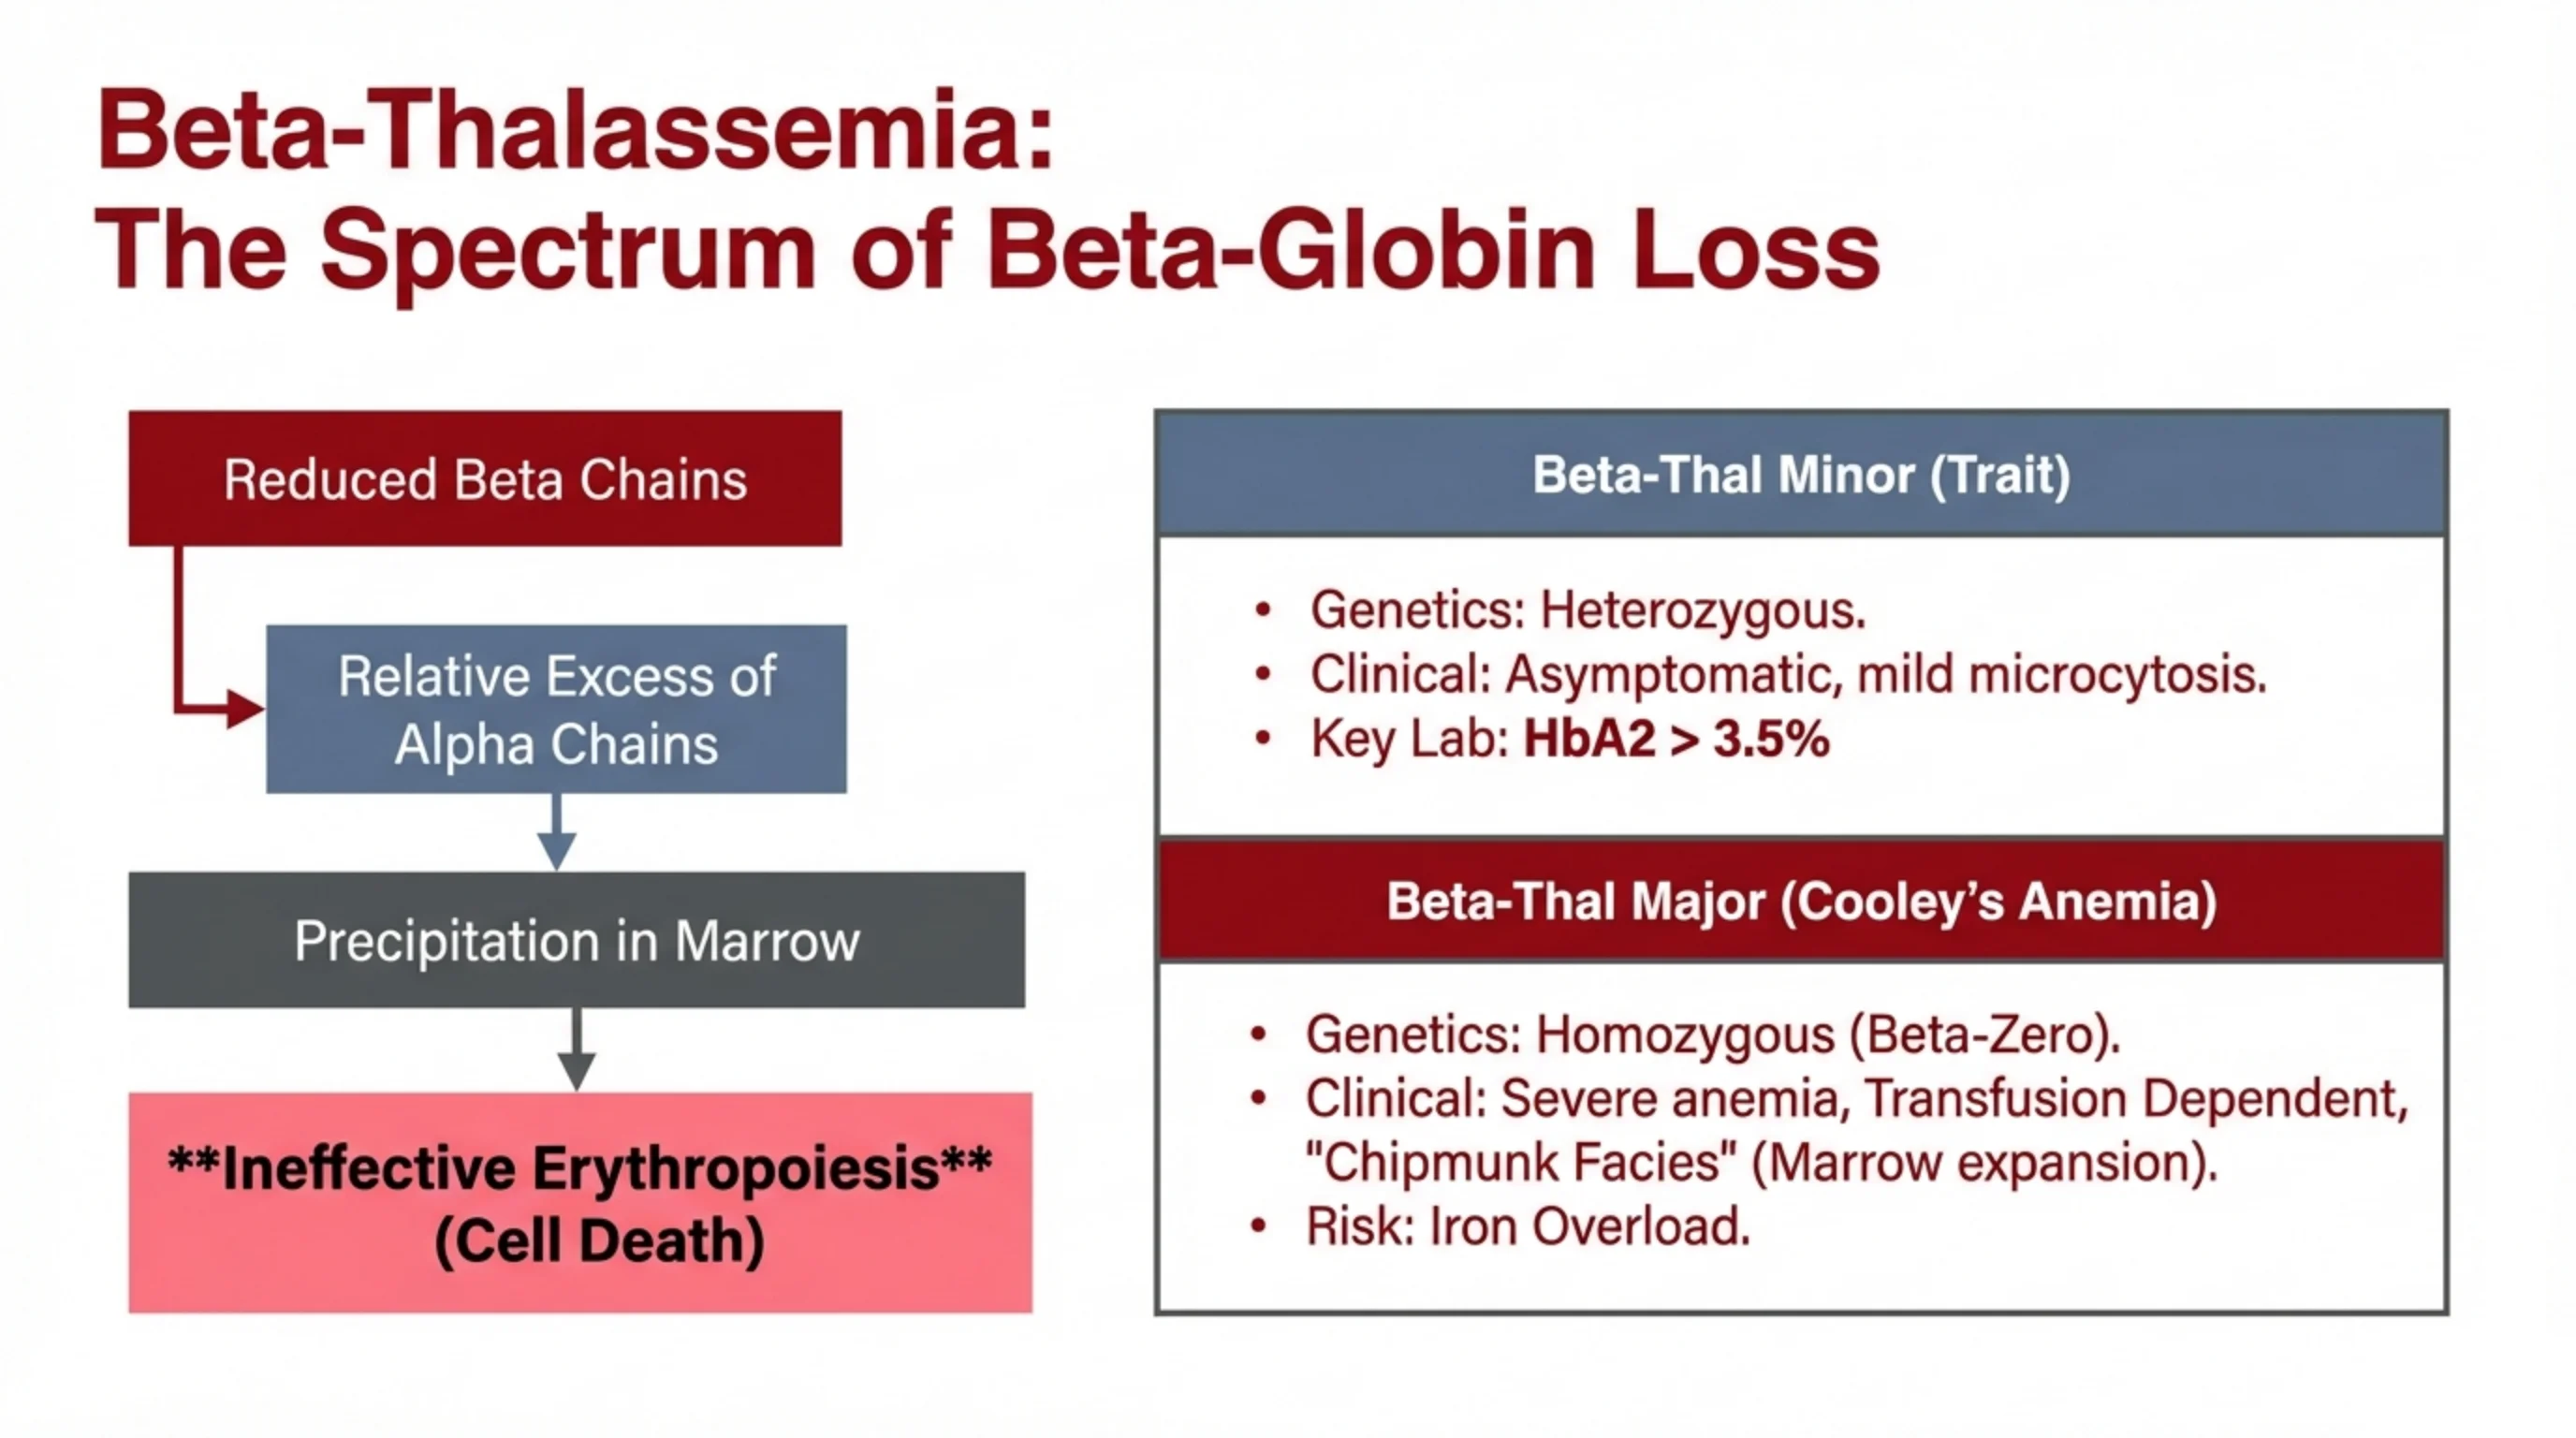
Beta-Thalassemia: The Spectrum of Beta-Globin Loss
Pathway: Reduced Beta Chains → Relative Excess of Alpha Chains → Precipitation in Marrow → Ineffective Erythropoiesis (Cell Death).
Beta-Thal Minor (Trait)
- Genetics: Heterozygous.
- Clinical: Asymptomatic, mild microcytosis.
- Key Lab: HbA2 > 3.5%
Beta-Thal Major (Cooley’s Anemia)
- Genetics: Homozygous (Beta-Zero).
- Clinical: Severe anemia, Transfusion Dependent, “Chipmunk Facies” (Marrow expansion).
- Risk: Iron Overload.
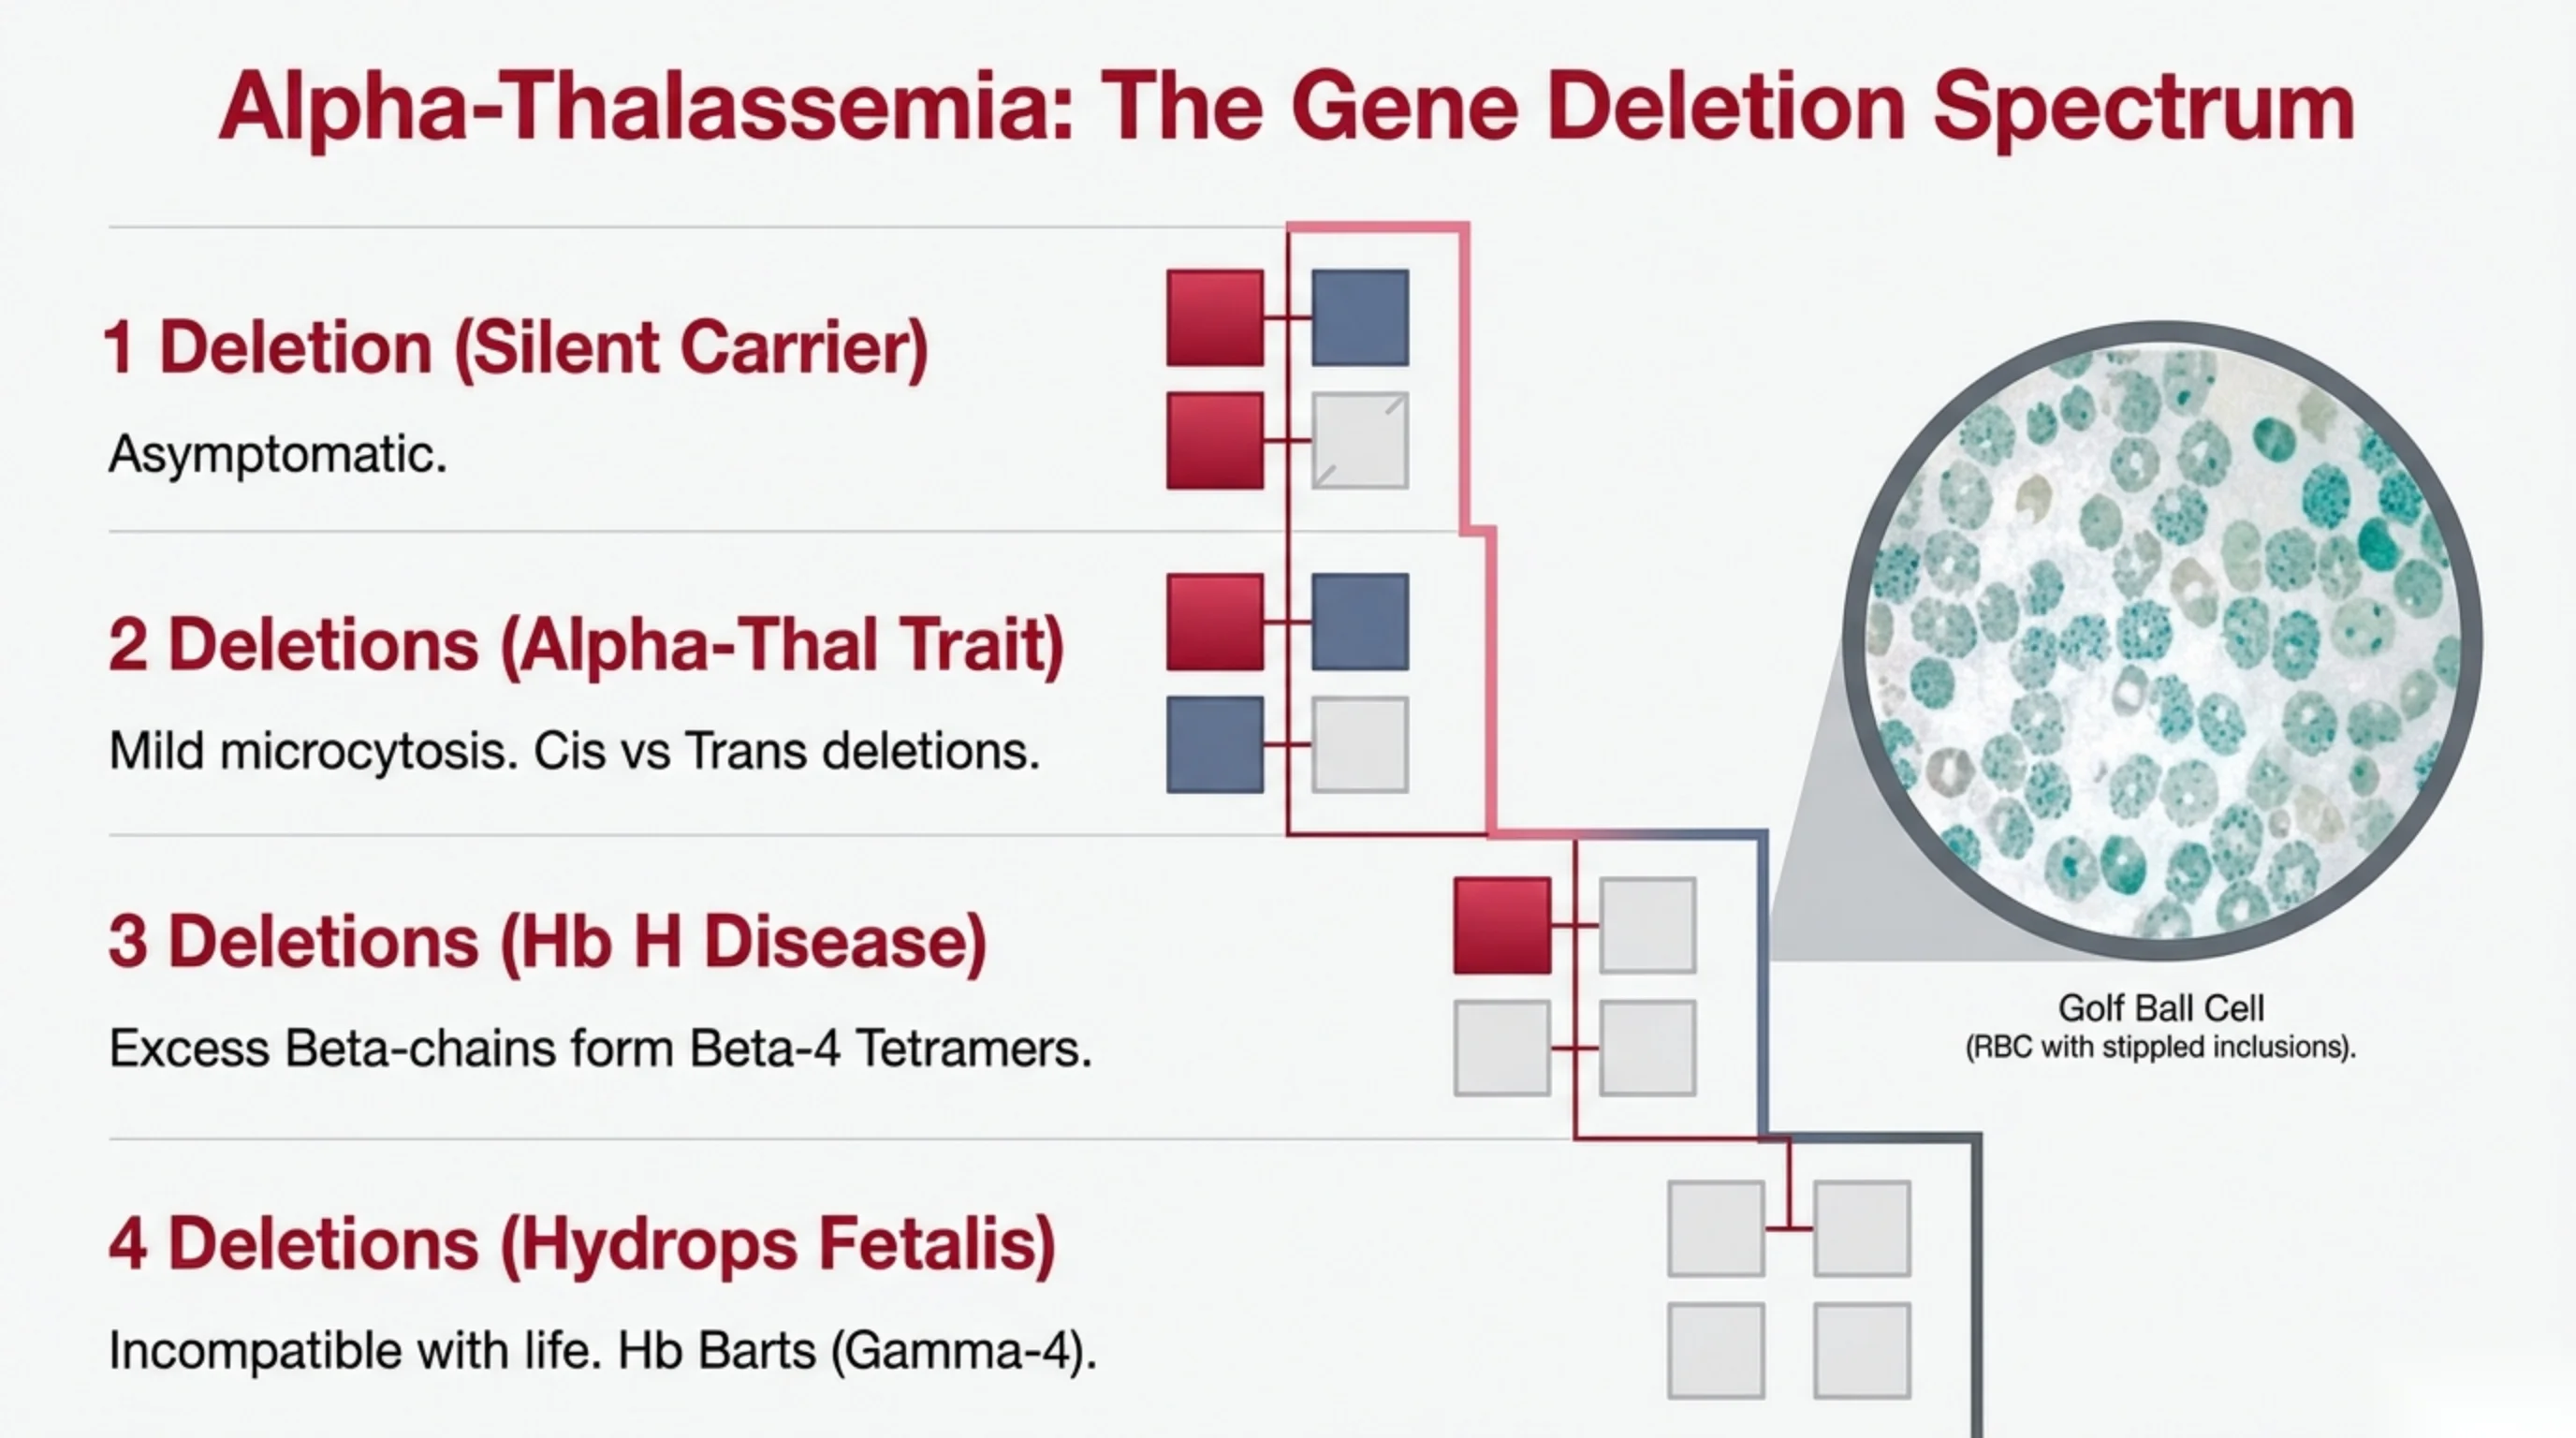
Alpha-Thalassemia: The Gene Deletion Spectrum
- 1 Deletion (Silent Carrier): Asymptomatic.
- 2 Deletions (Alpha-Thal Trait): Mild microcytosis. Cis vs Trans deletions.
- 3 Deletions (Hb H Disease): Excess Beta-chains form Beta-4 Tetramers.
- 4 Deletions (Hydrops Fetalis): Incompatible with life. Hb Barts (Gamma-4).
Inset image: Golf Ball Cell (RBC with stippled inclusions).
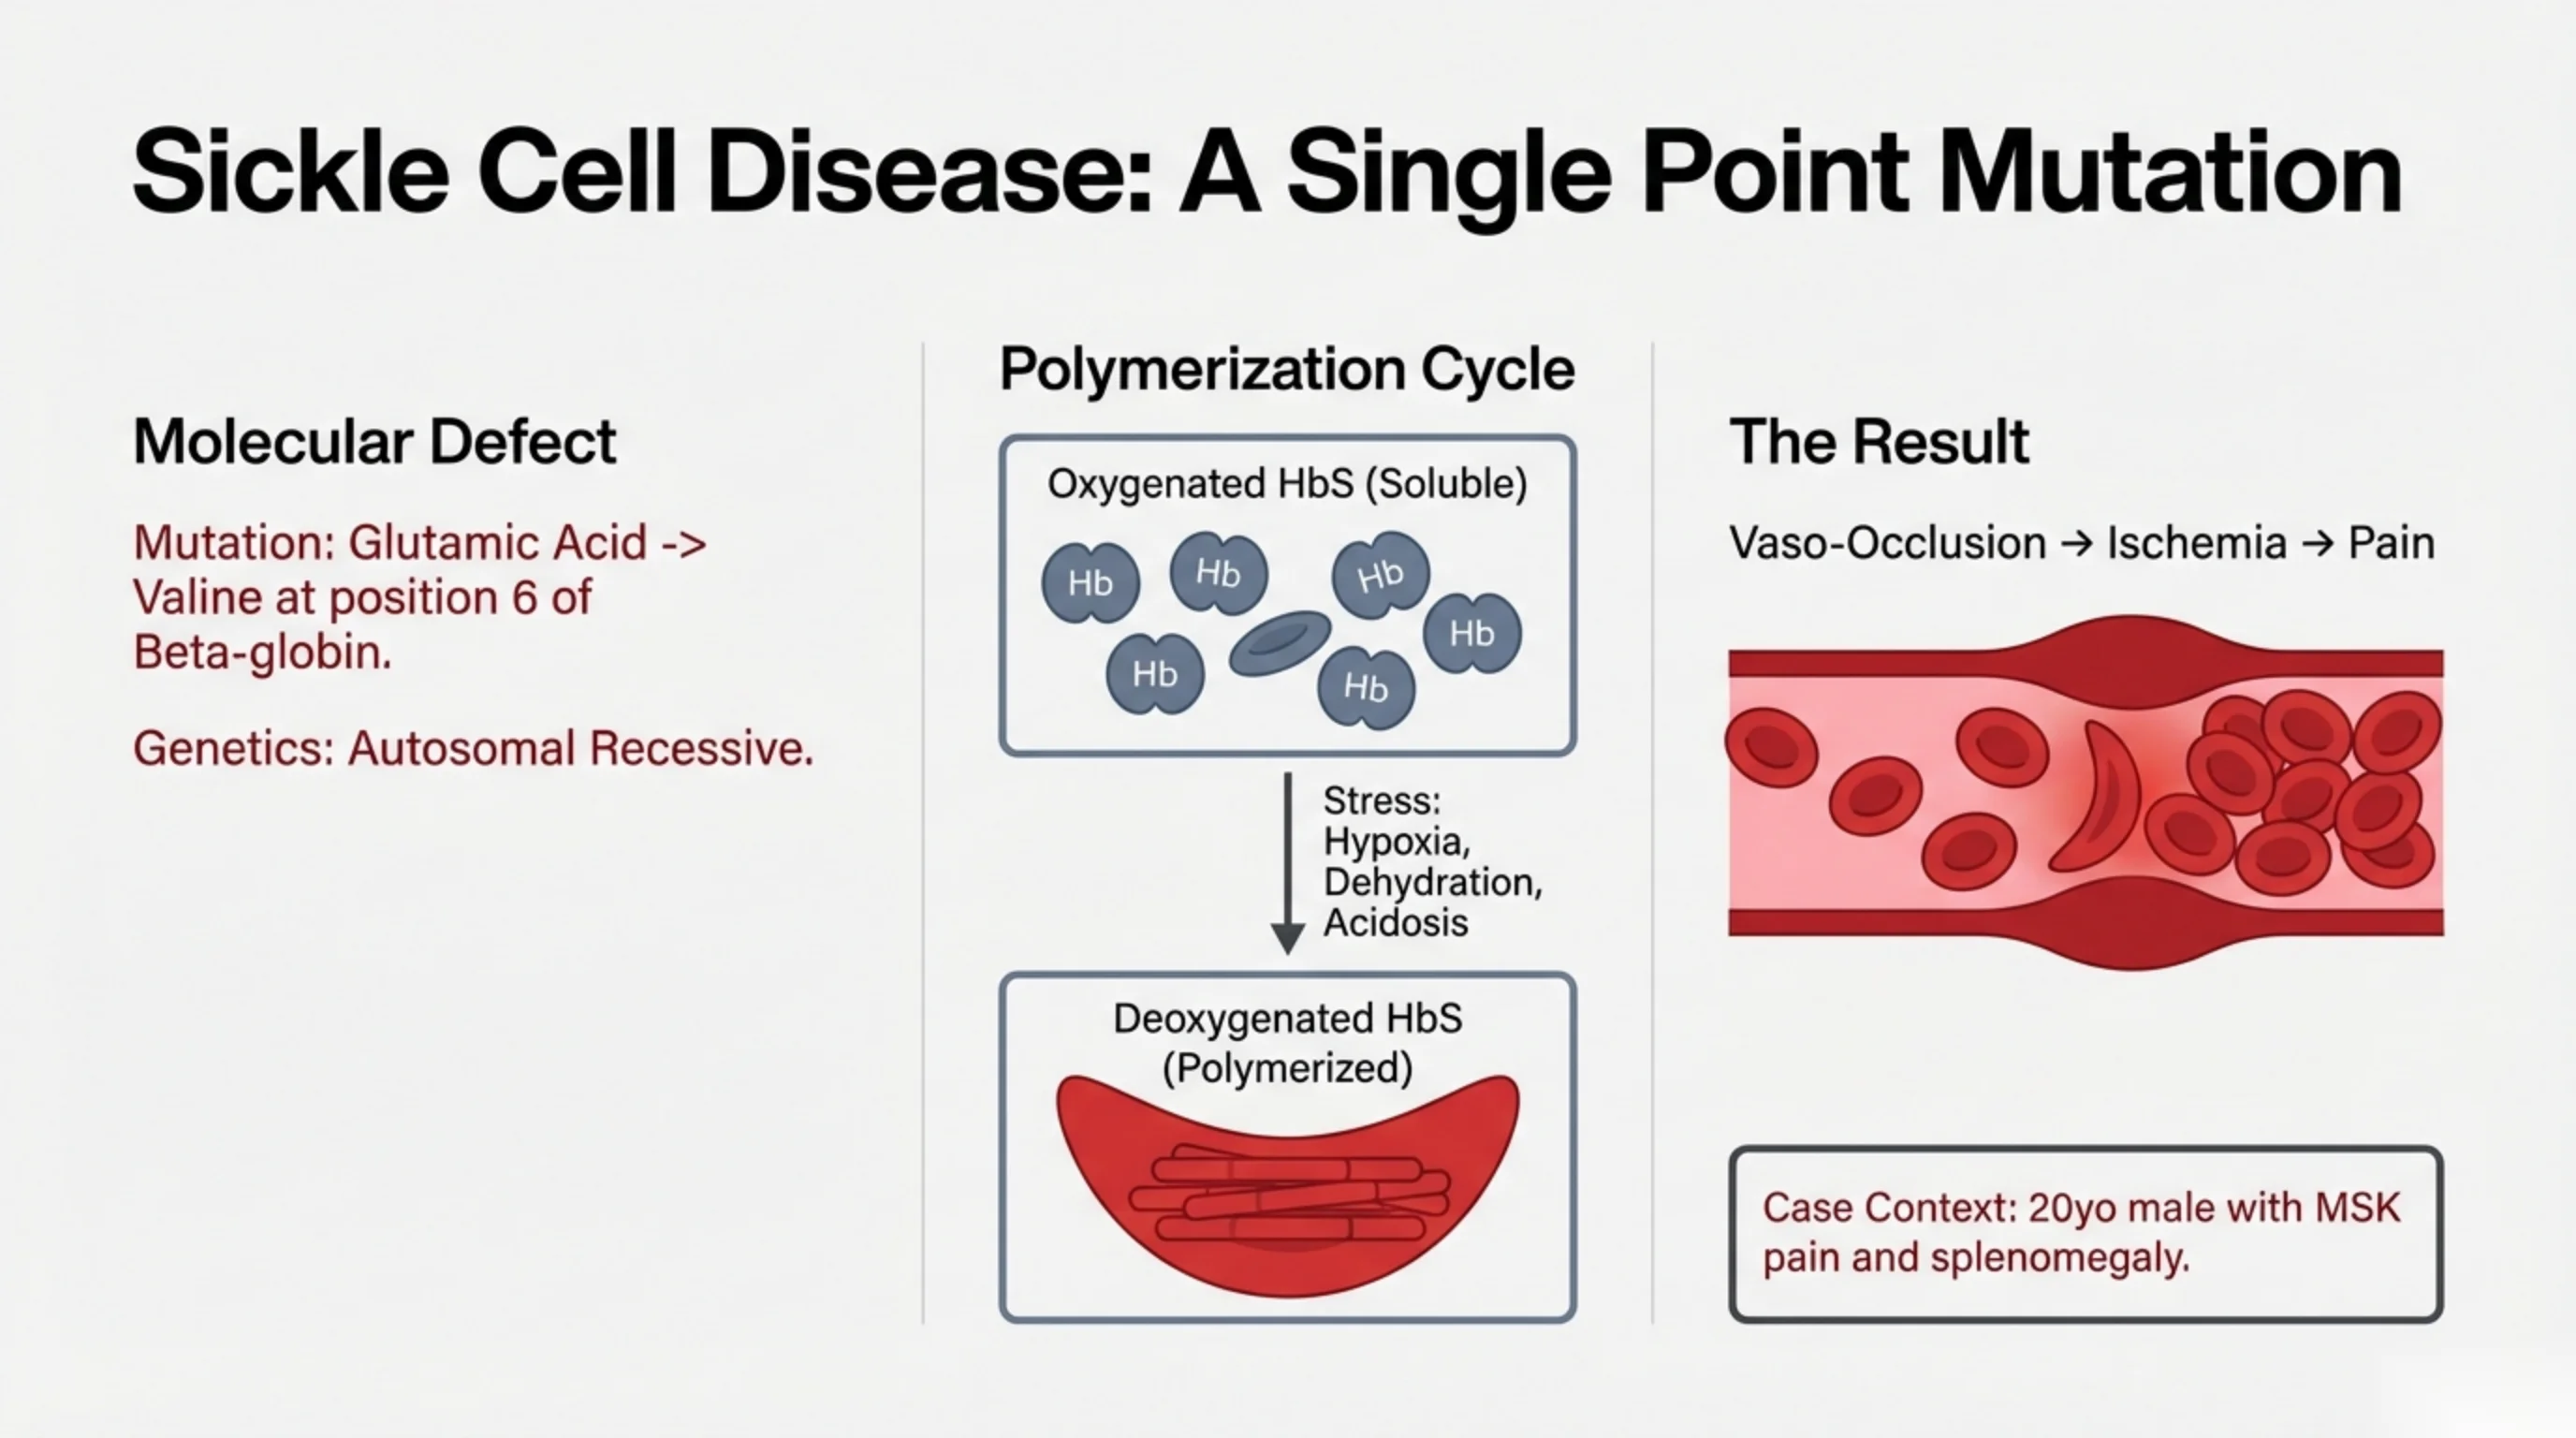
Sickle Cell Disease: A Single Point Mutation
Molecular Defect
- Mutation: Glutamic Acid -> Valine at position 6 of Beta-globin.
- Genetics: Autosomal Recessive.
Polymerization Cycle
Oxygenated HbS (Soluble) — under Stress: Hypoxia, Dehydration, Acidosis → Deoxygenated HbS (Polymerized), forming rigid fibers that deform the cell into a sickle shape.
The Result
Vaso-Occlusion → Ischemia → Pain.
Case Context: 20yo male with MSK pain and splenomegaly.
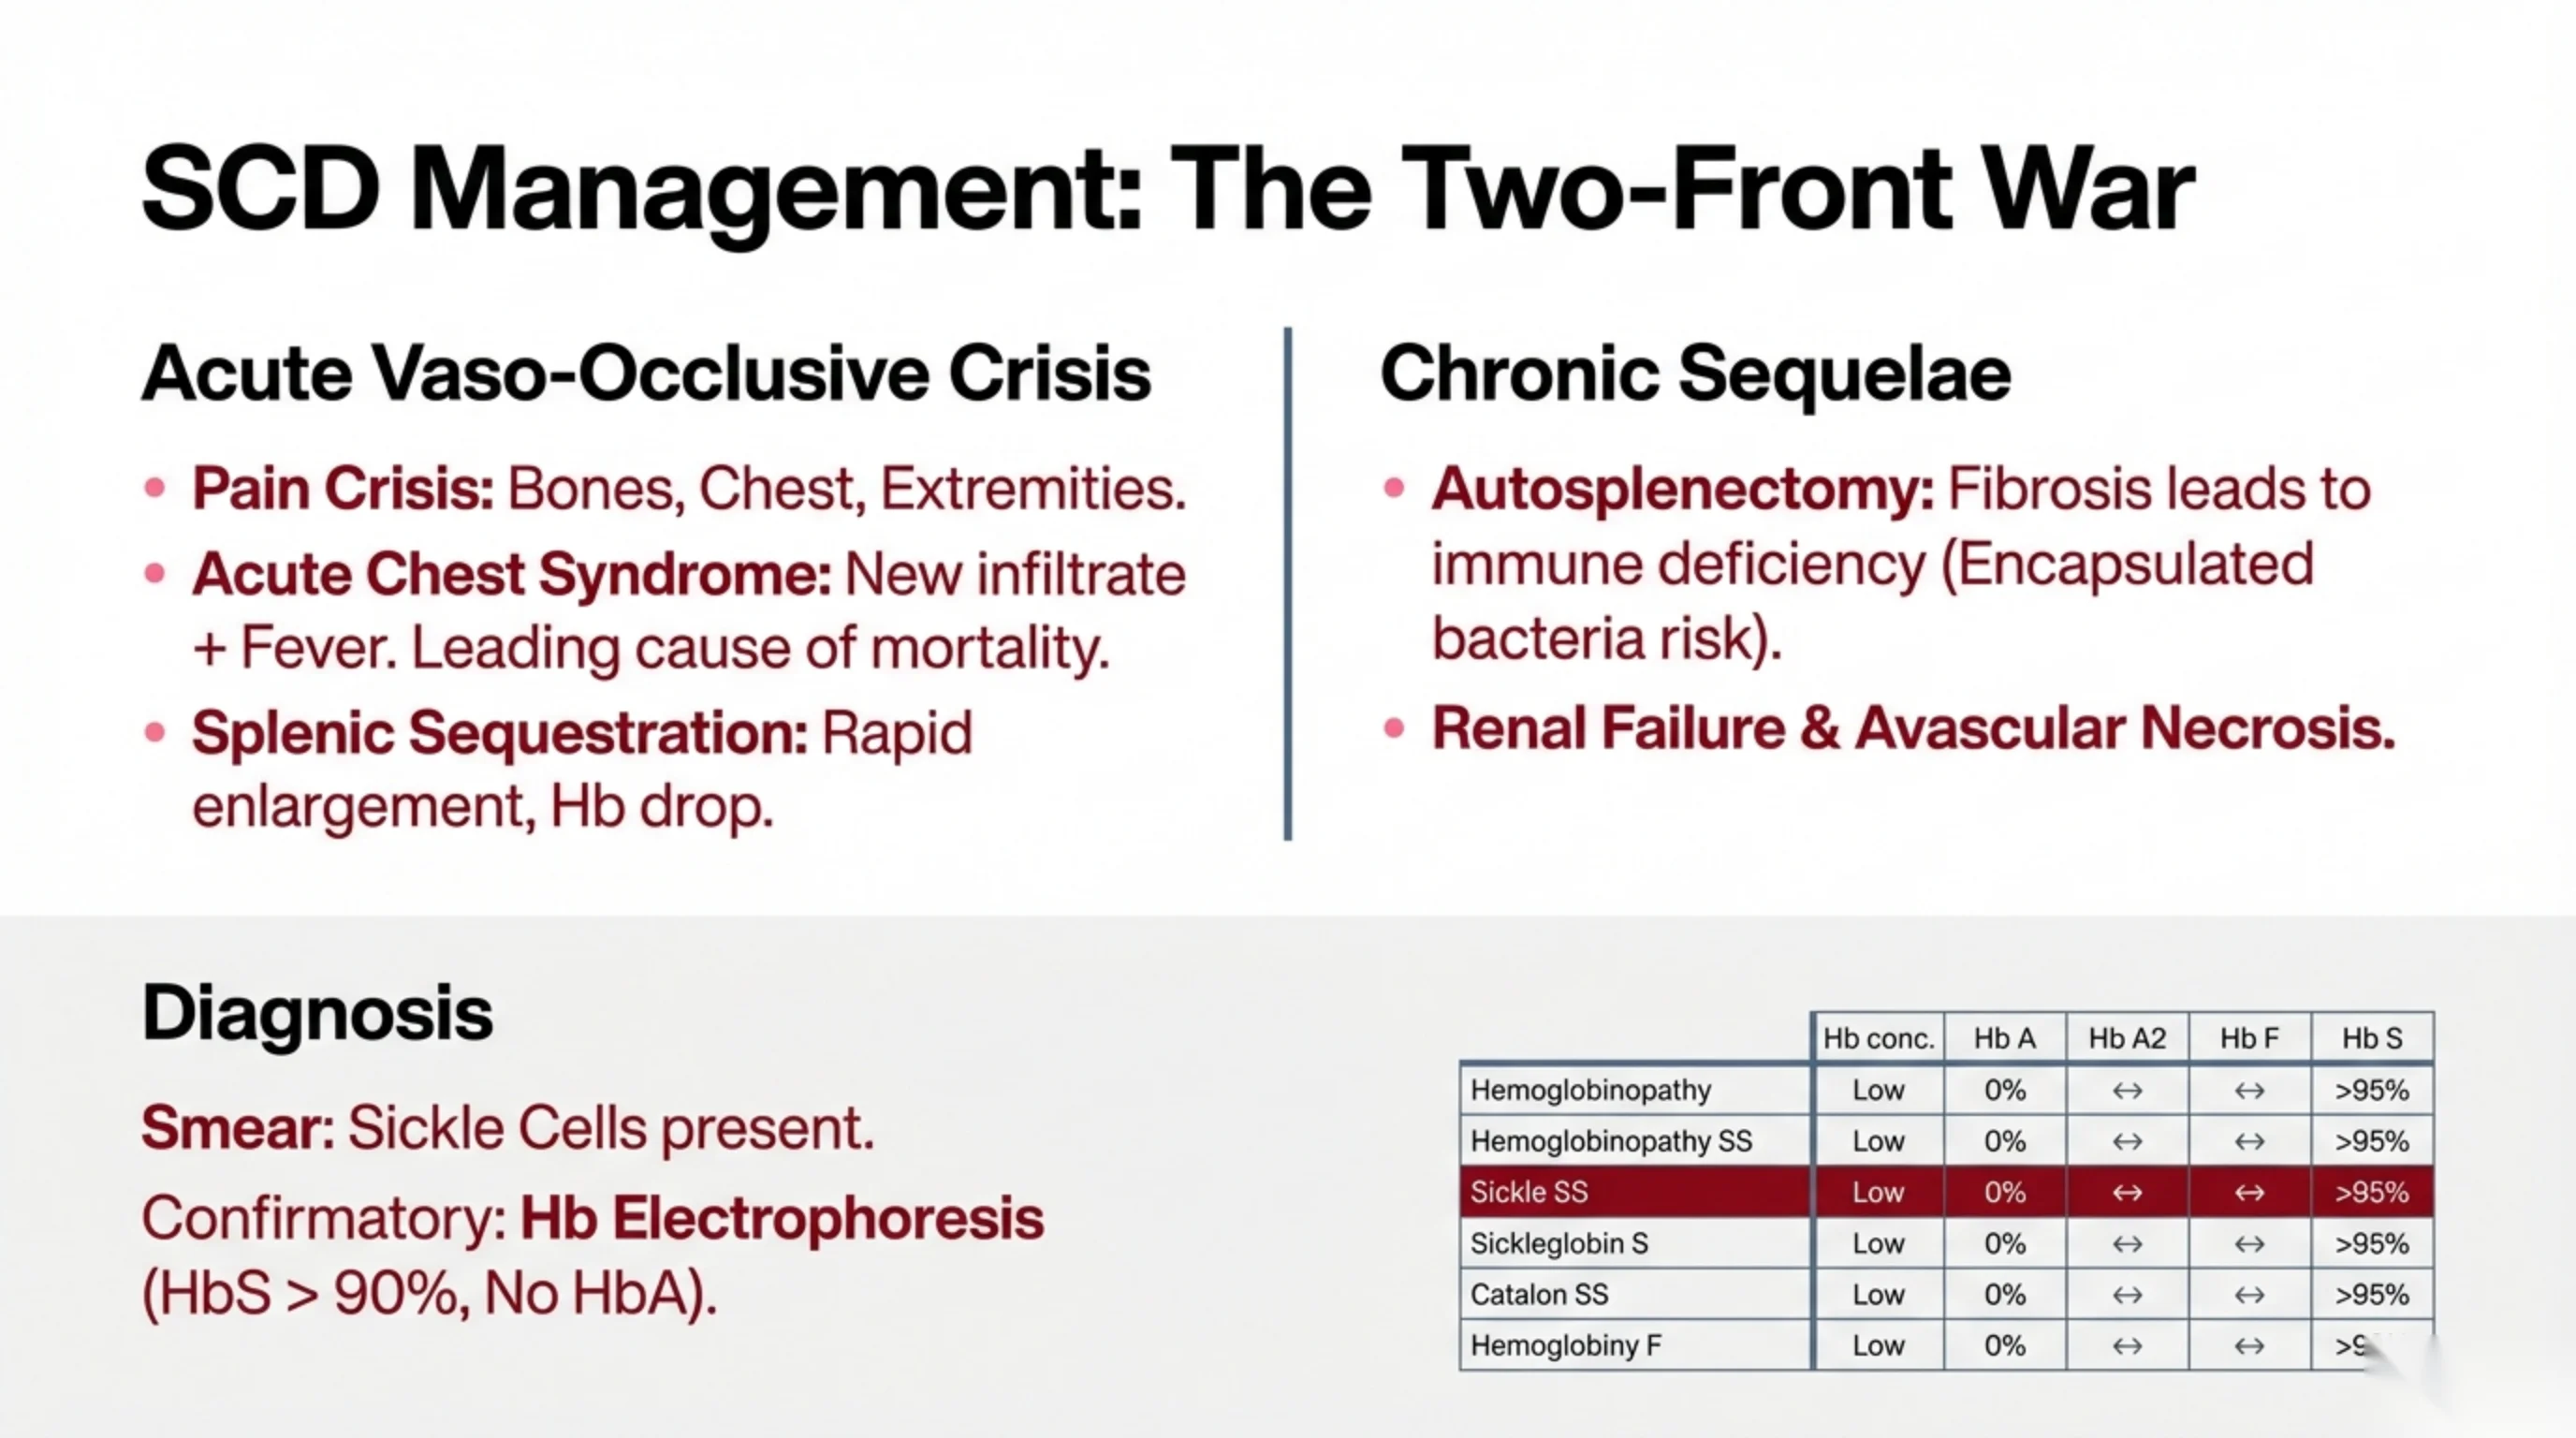
SCD Management: The Two-Front War
Acute Vaso-Occlusive Crisis
- Pain Crisis: Bones, Chest, Extremities.
- Acute Chest Syndrome: New infiltrate + Fever. Leading cause of mortality.
- Splenic Sequestration: Rapid enlargement, Hb drop.
Chronic Sequelae
- Autosplenectomy: Fibrosis leads to immune deficiency (Encapsulated bacteria risk).
- Renal Failure & Avascular Necrosis.
Diagnosis
Smear: Sickle Cells present.
Confirmatory: Hb Electrophoresis (HbS > 90%, No HbA).
[Note: the electrophoresis table row labels below appear garbled/duplicated on the source slide.]
| Hb conc. | Hb A | Hb A2 | Hb F | Hb S | |
|---|---|---|---|---|---|
| Hemoglobinopathy | Low | 0% | ↔ | ↔ | >95% |
| Hemoglobinopathy SS | Low | 0% | ↔ | ↔ | >95% |
| Sickle SS | Low | 0% | ↔ | ↔ | >95% |
| Sickleglobin S | Low | 0% | ↔ | ↔ | >95% |
| Catalon SS | Low | 0% | ↔ | ↔ | >95% |
| Hemoglobiny F | Low | 0% | ↔ | ↔ | >9 (illegible) |
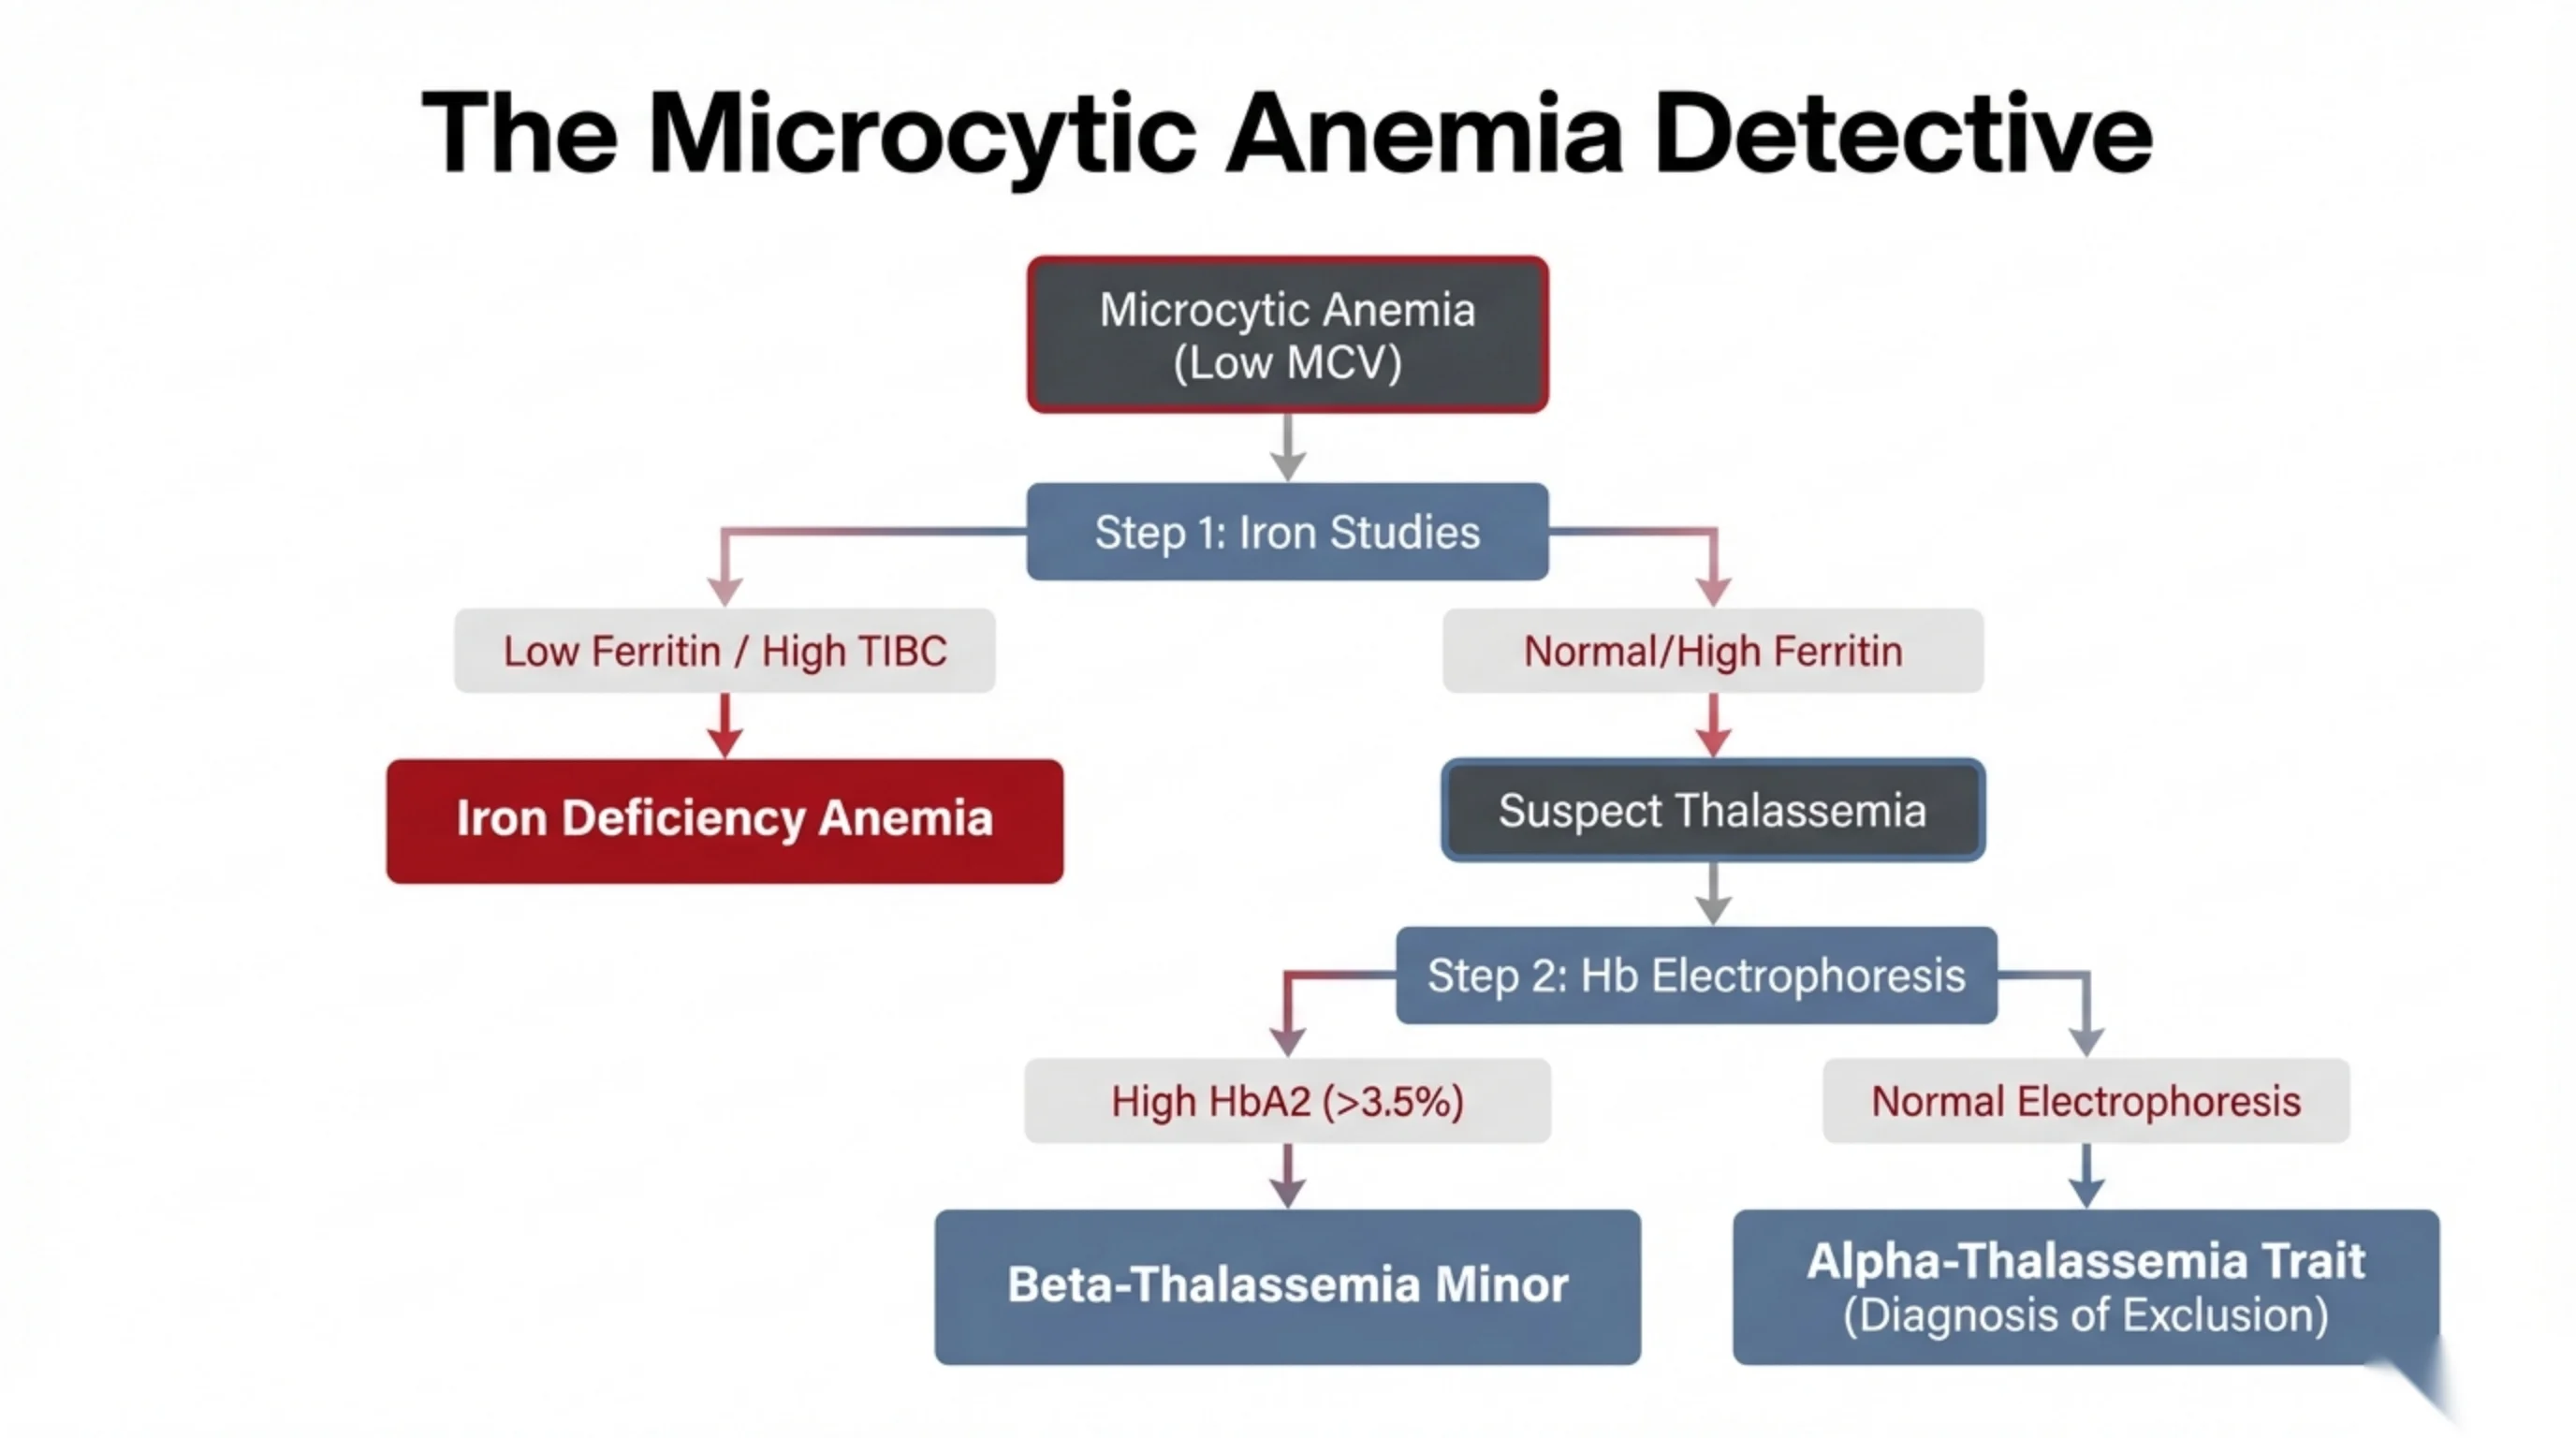
The Microcytic Anemia Detective
Start: Microcytic Anemia (Low MCV) → Step 1: Iron Studies.
- Low Ferritin / High TIBC → Iron Deficiency Anemia.
- Normal/High Ferritin → Suspect Thalassemia → Step 2: Hb Electrophoresis:
- High HbA2 (>3.5%) → Beta-Thalassemia Minor.
- Normal Electrophoresis → Alpha-Thalassemia Trait (Diagnosis of Exclusion).
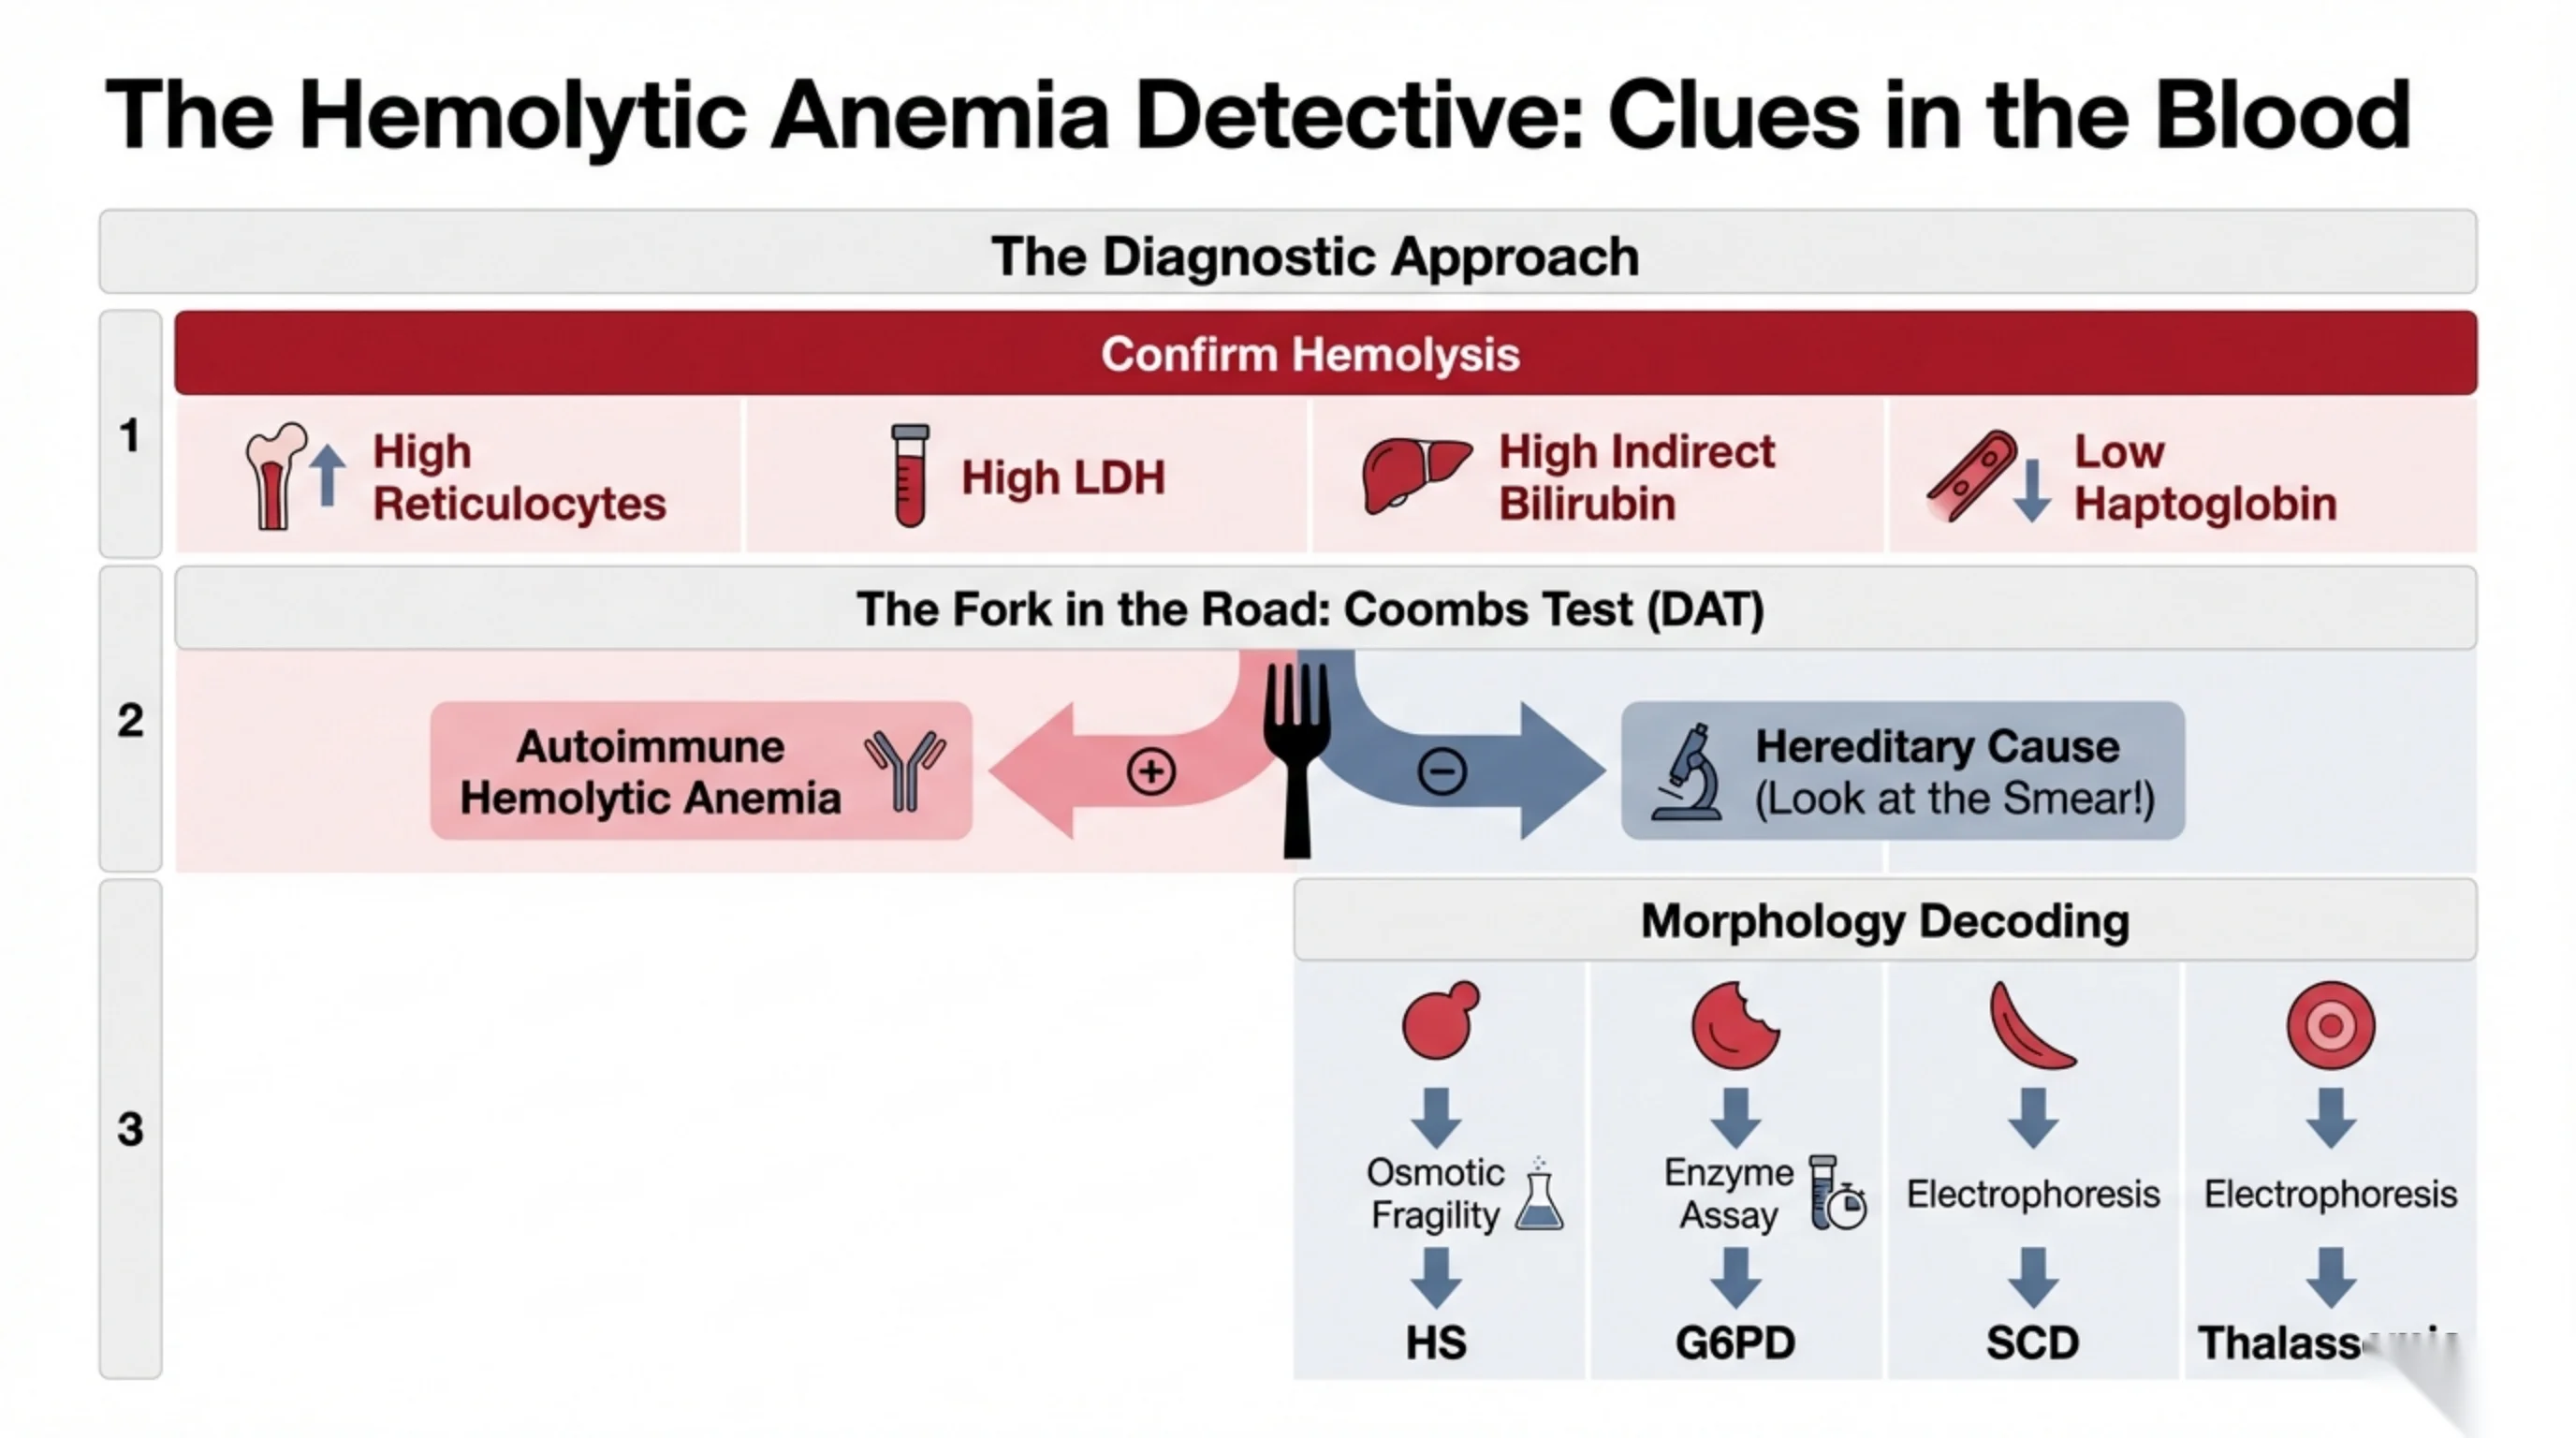
The Hemolytic Anemia Detective: Clues in the Blood
The Diagnostic Approach
Step 1 — Confirm Hemolysis: High Reticulocytes, High LDH, High Indirect Bilirubin, Low Haptoglobin.
Step 2 — The Fork in the Road: Coombs Test (DAT):
- Positive (+) → Autoimmune Hemolytic Anemia.
- Negative (−) → Hereditary Cause (Look at the Smear!).
Step 3 — Morphology Decoding:
| Smear finding | Confirmatory test | Diagnosis |
|---|---|---|
| Spherocyte | Osmotic Fragility | HS |
| Bite cell | Enzyme Assay | G6PD |
| Sickle cell | Electrophoresis | SCD |
| Target cell | Electrophoresis | Thalassemia |
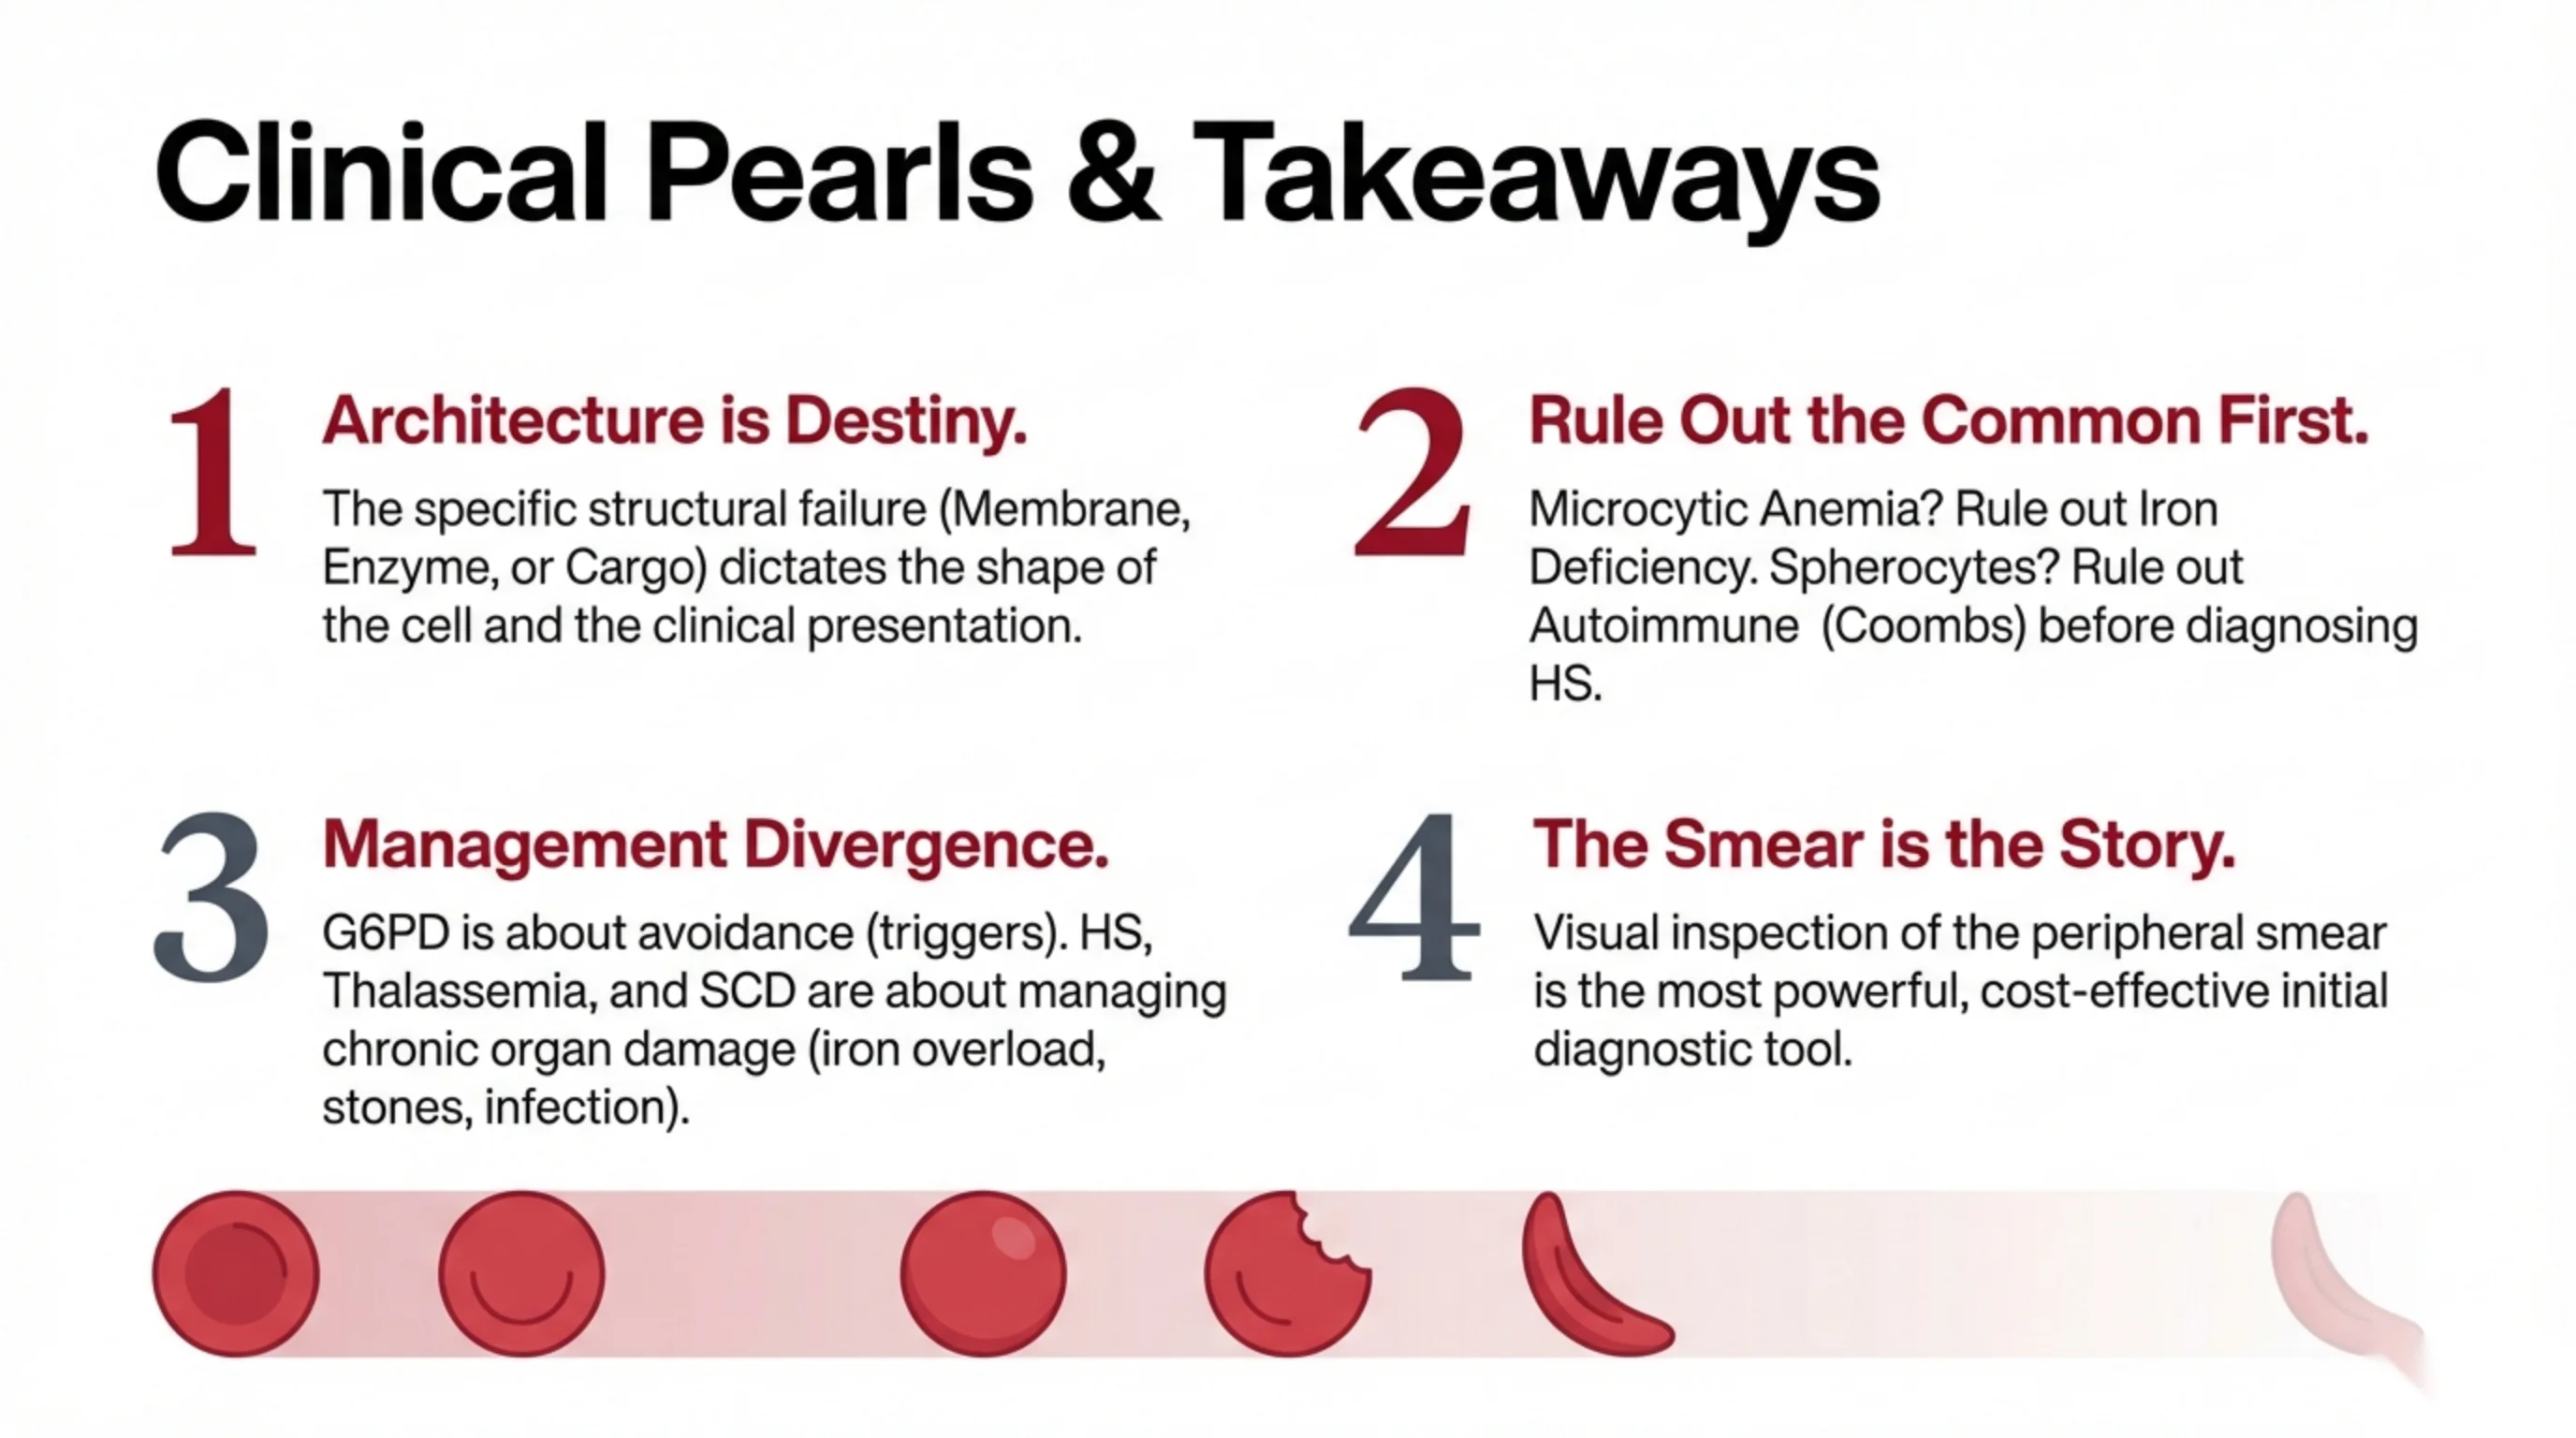
Clinical Pearls & Takeaways
- 1. Architecture is Destiny. The specific structural failure (Membrane, Enzyme, or Cargo) dictates the shape of the cell and the clinical presentation.
- 2. Rule Out the Common First. Microcytic Anemia? Rule out Iron Deficiency. Spherocytes? Rule out Autoimmune (Coombs) before diagnosing HS.
- 3. Management Divergence. G6PD is about avoidance (triggers). HS, Thalassemia, and SCD are about managing chronic organ damage (iron overload, stones, infection).
- 4. The Smear is the Story. Visual inspection of the peripheral smear is the most powerful, cost-effective initial diagnostic tool.