Introduction to Bleeding Disorders
The hemostatic system from platelets to fibrinolysis — physiology and the coagulation cascade.
Introduction to Bleeding Disorders
HK
Objectives
- Physiology of hemostasis
- Hemostasis : Process of clot formation
- Classification of bleeding disorders
- Clinical approach to bleeding disorders
- Case study -1 ( hereditary bleeding disorder)
- Case study -2 ( acquired bleeding disorder)
- Interpretation of coagulation tests (?)
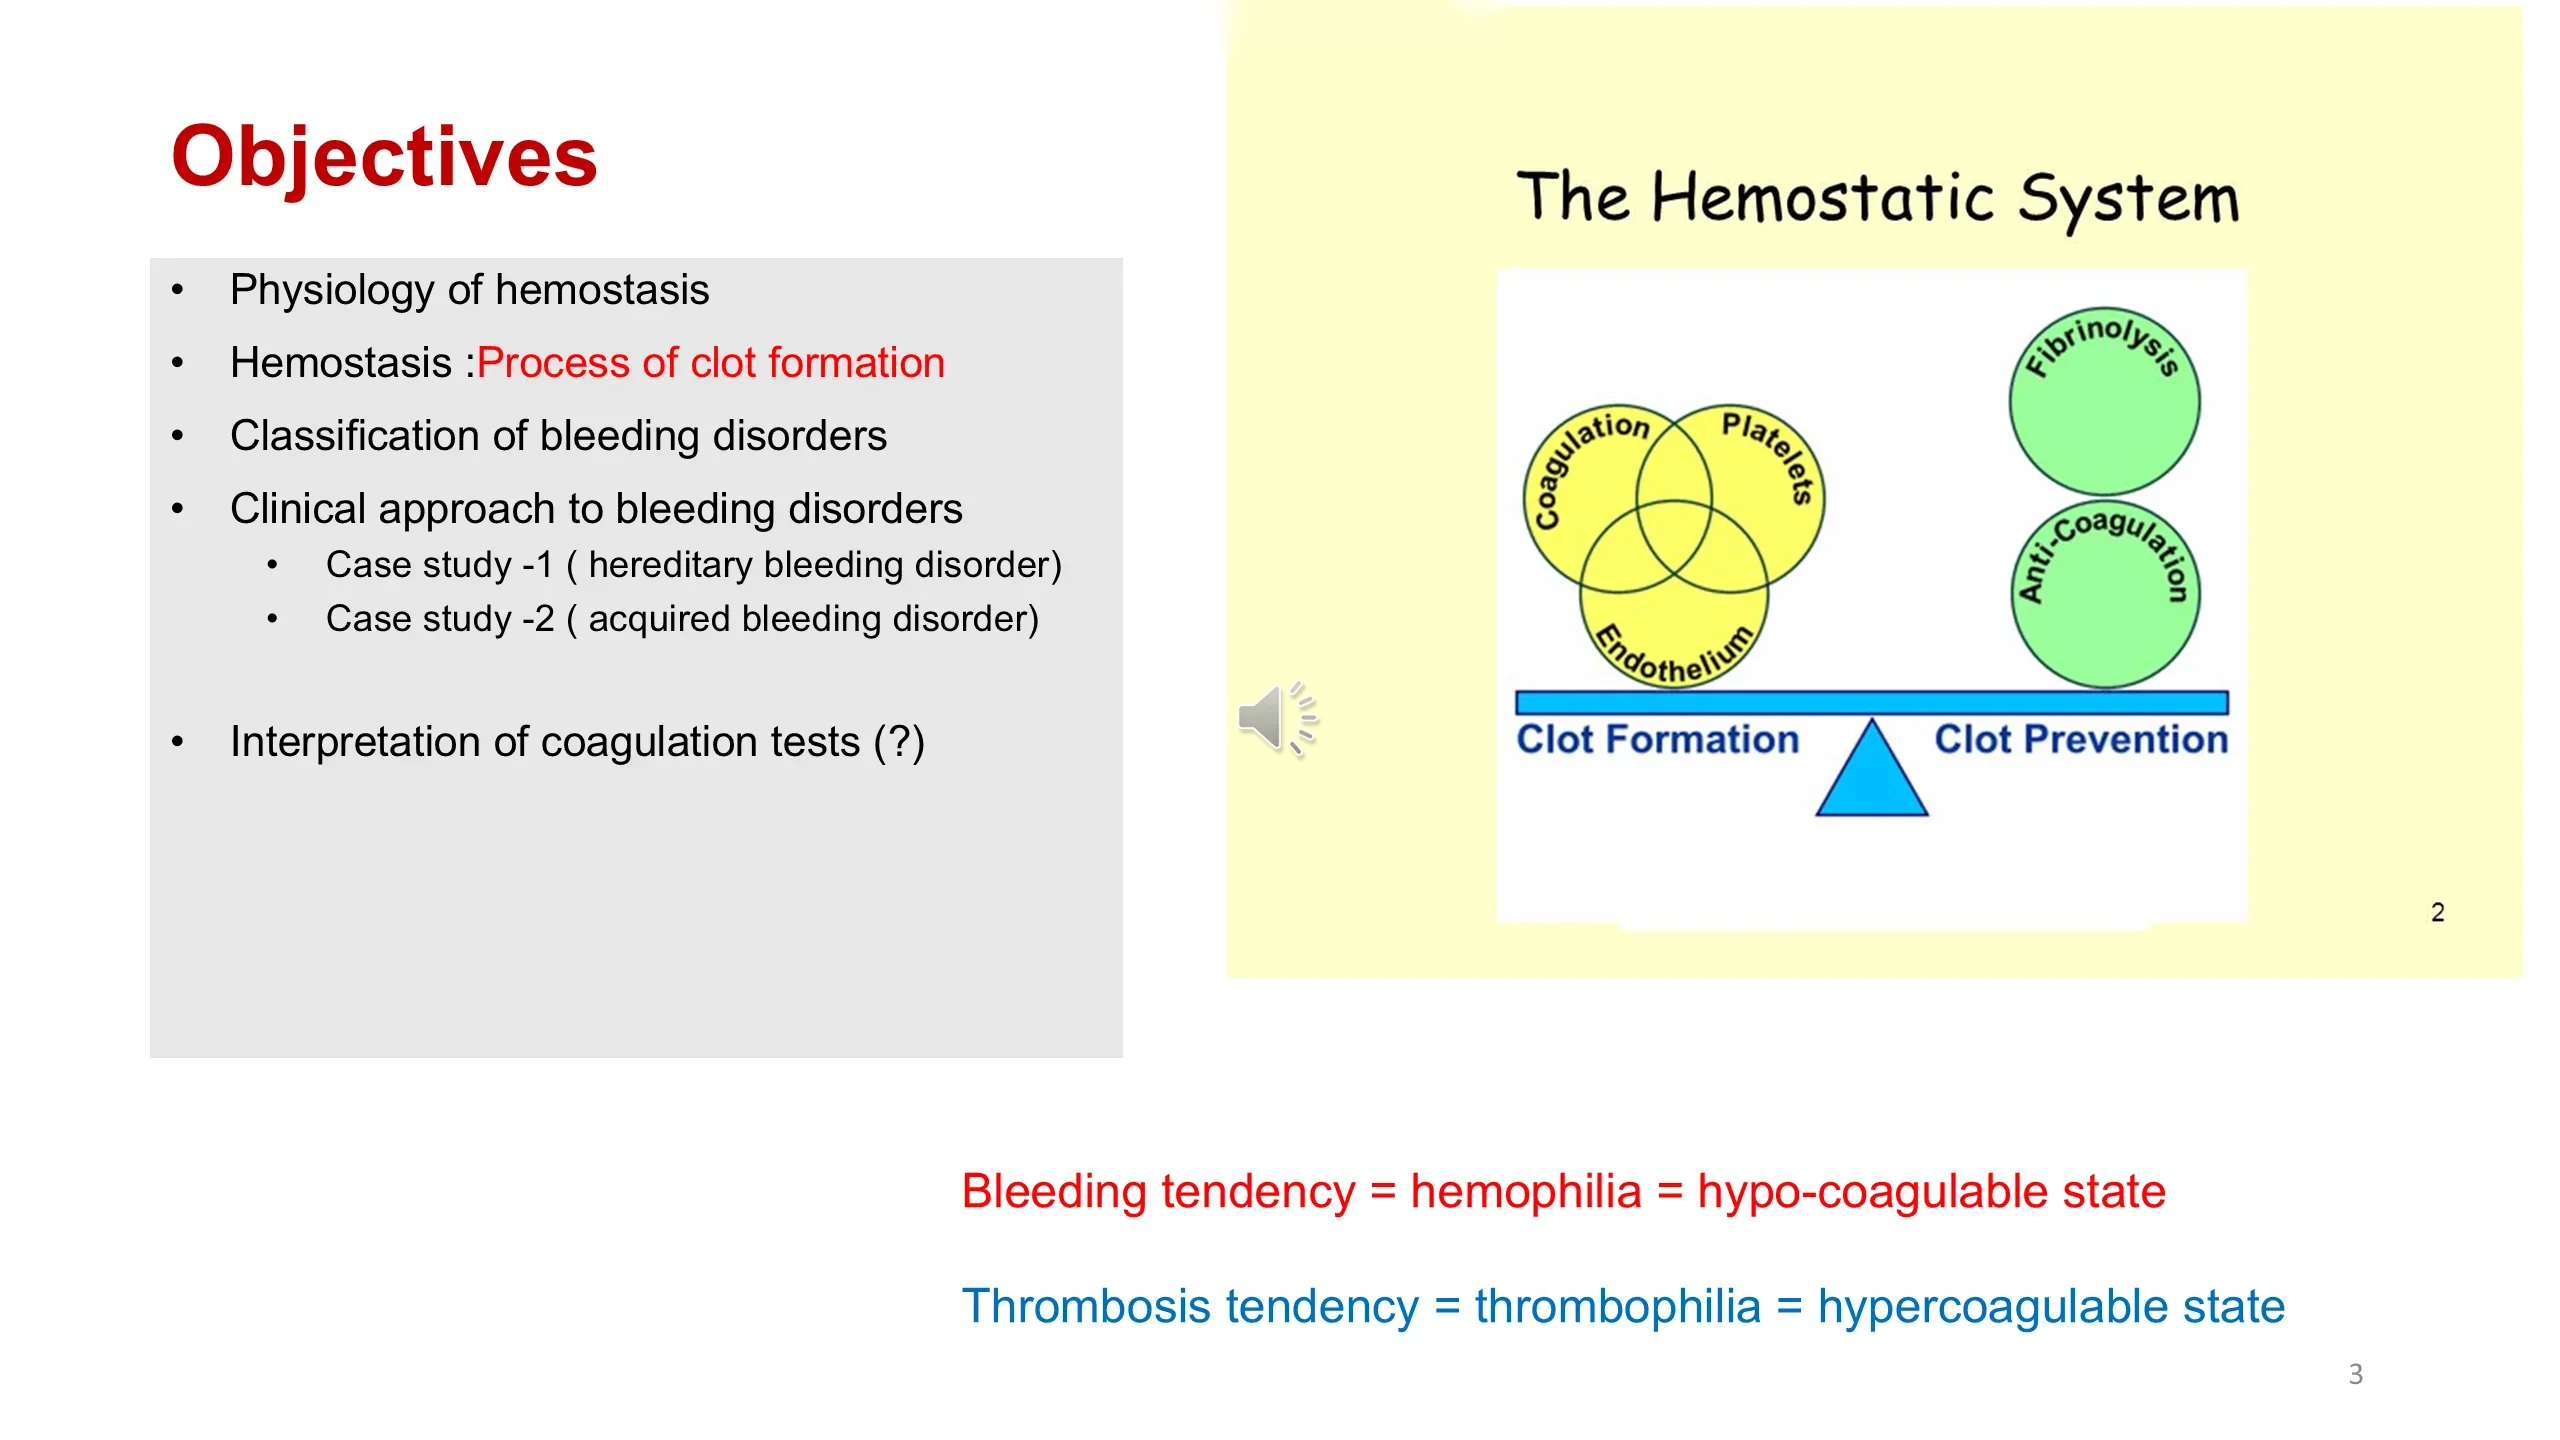
The Hemostatic System
A balance diagram: on the Clot Formation side, three overlapping circles labeled Coagulation, Platelets, and Endothelium. On the Clot Prevention side, two circles labeled Fibrinolysis and Anti-Coagulation. The beam balances Clot Formation against Clot Prevention.
Bleeding tendency = hemophilia = hypo-coagulable state
Thrombosis tendency = thrombophilia = hypercoagulable state
Blood is the essence of vitality; it must remain in constant motion to sustain every part of the body. When blood ceases to flow, life ends.
Interrelated process
- STOP ( natural anticoagulants)
- START ( endothelium + platelets) — Platelet plug
- MAKE ( coagulation cascade) — Fibrin clot
- STOP ( natural anticoagulants)
- CLEAN ( fibrin-o-lysis)
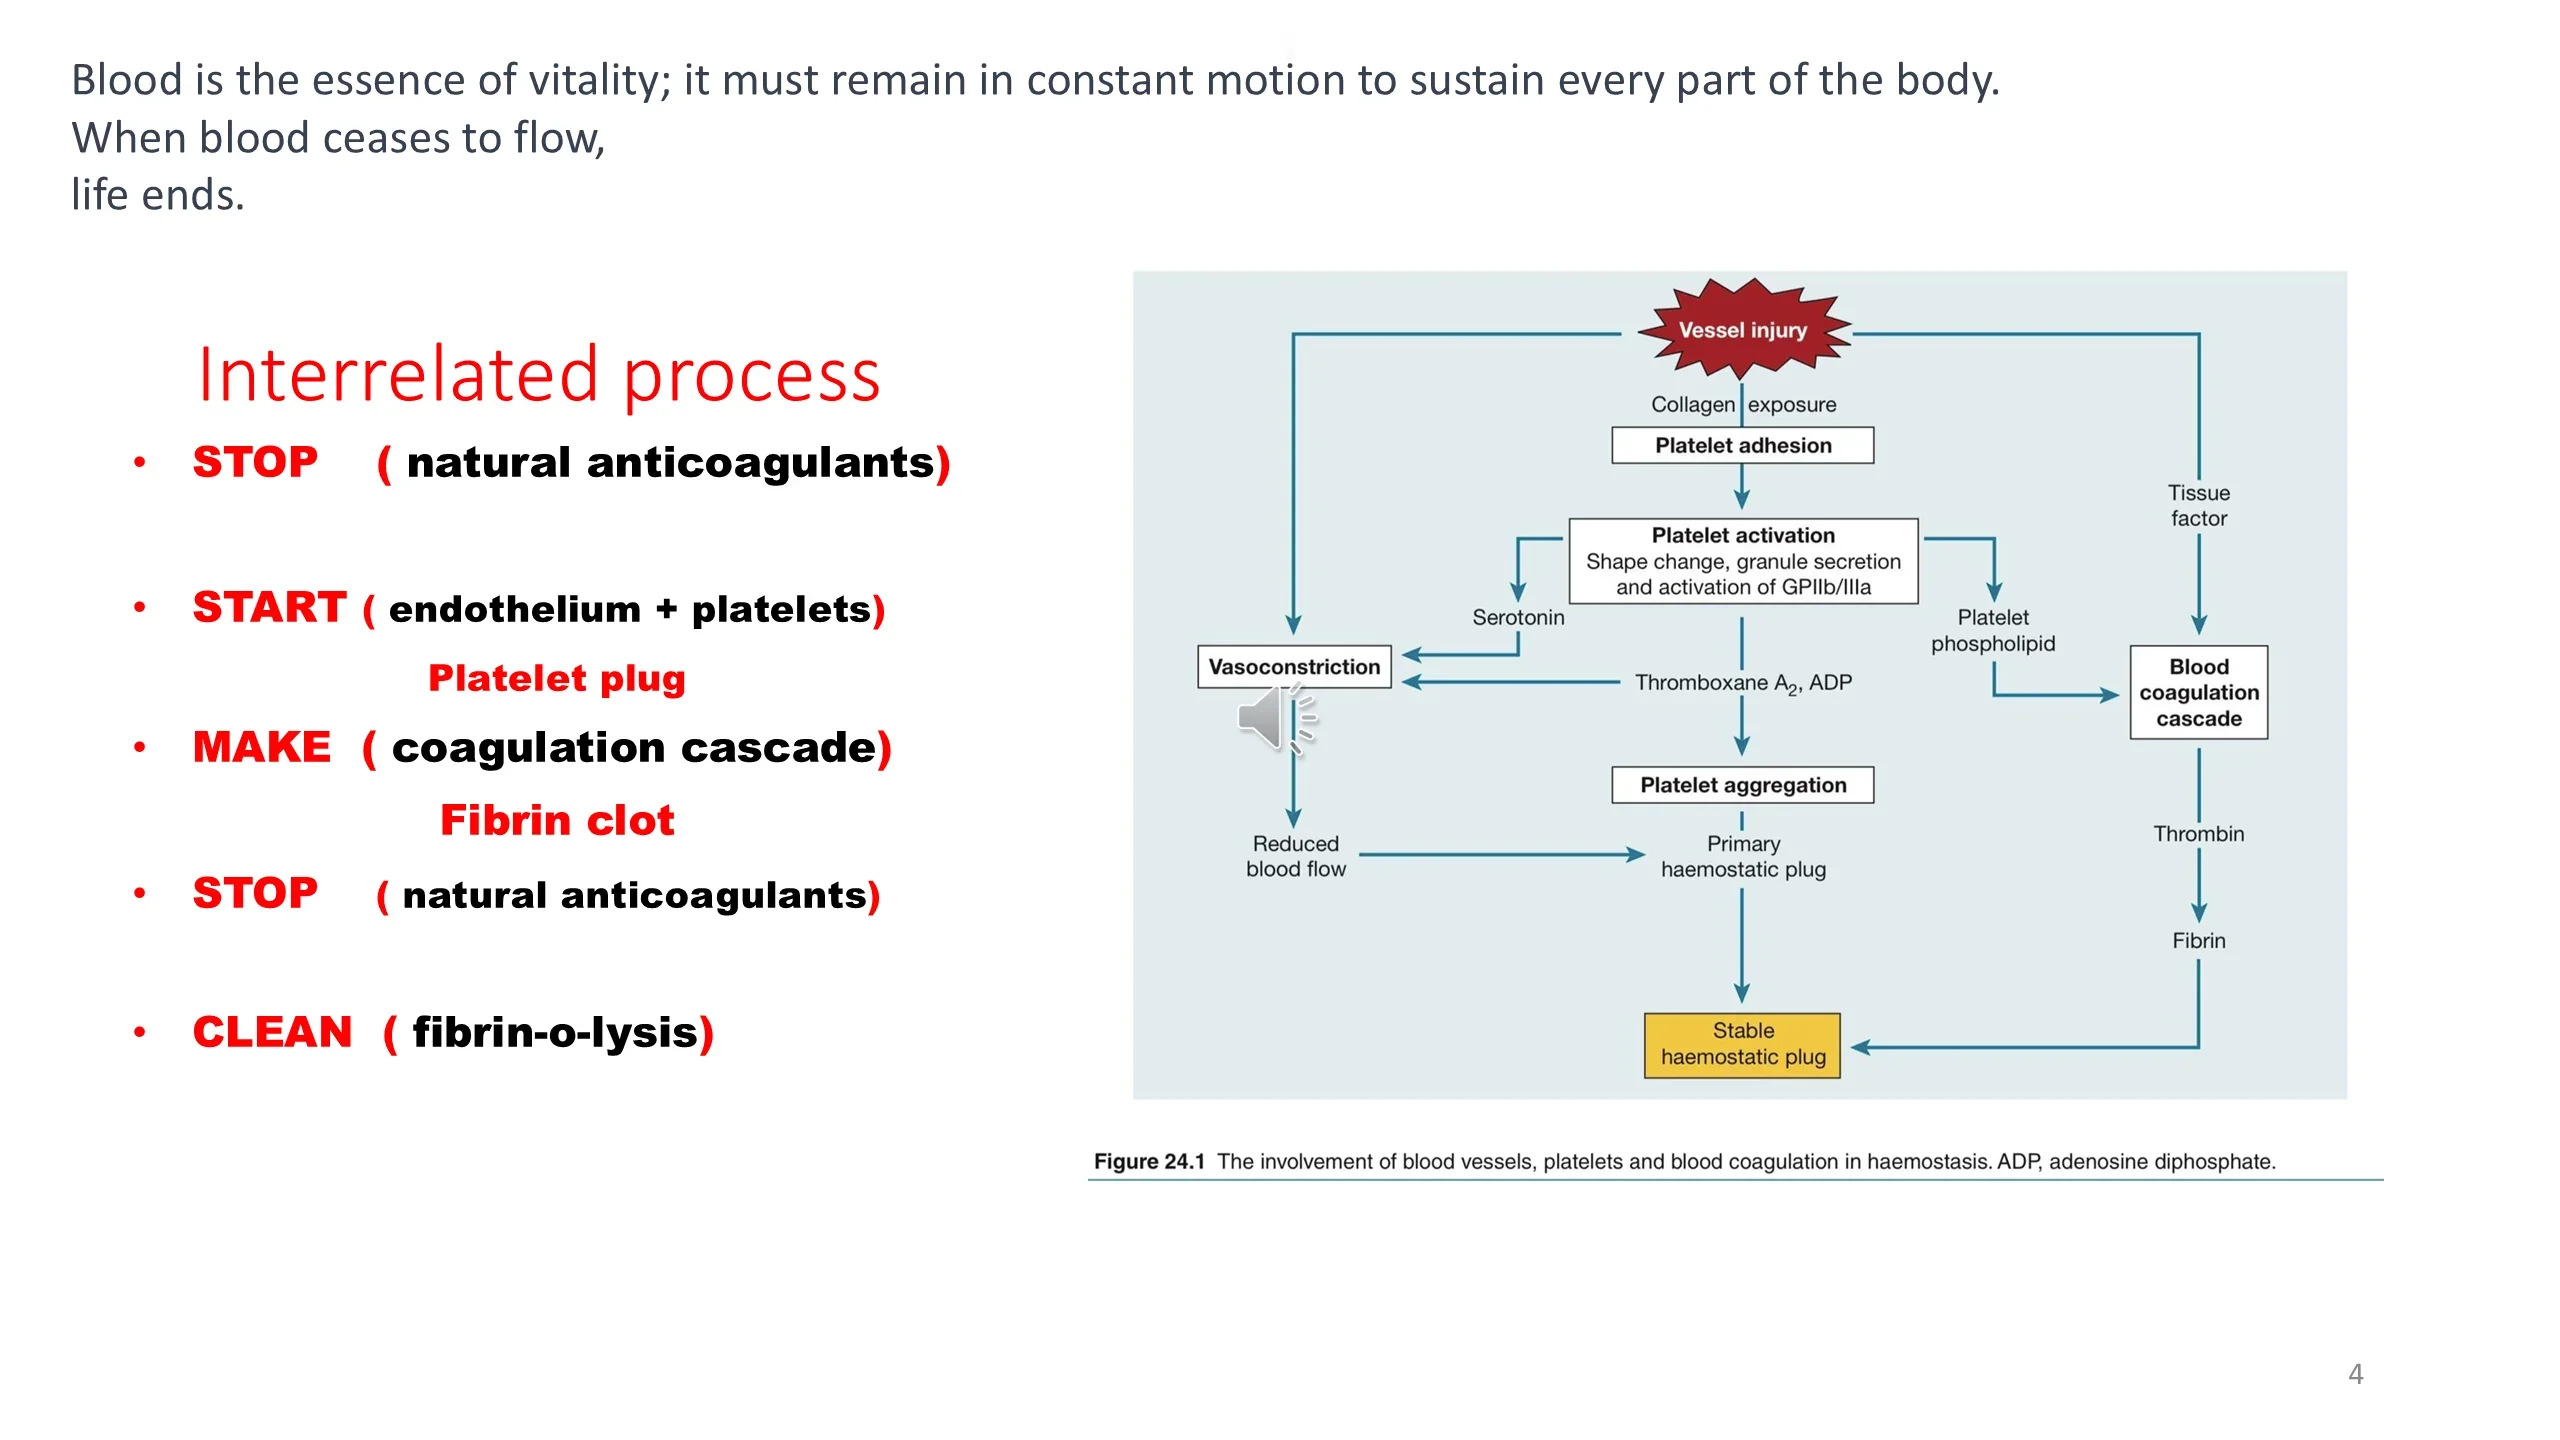
Figure 24.1 (flowchart logic): Vessel injury leads to Collagen exposure and Tissue factor. Collagen exposure → Platelet adhesion → Platelet activation (Shape change, granule secretion and activation of GPIIb/IIIa). Platelet activation releases Serotonin → Vasoconstriction → Reduced blood flow, and Thromboxane A2, ADP → Platelet aggregation → Primary haemostatic plug. Platelet phospholipid and Tissue factor feed the Blood coagulation cascade → Thrombin → Fibrin. Both the Primary haemostatic plug and Fibrin converge to form the Stable haemostatic plug.
Figure 24.1 The involvement of blood vessels, platelets and blood coagulation in haemostasis. ADP, adenosine diphosphate.
Hemostasis is a process
- START ( endothelium + platelets) — Platelet plug
- MAKE ( coagulation cascade) — Fibrin clot
- STOP ( natural anticoagulants)
- CLEAN ( fibrin-o-lysis)
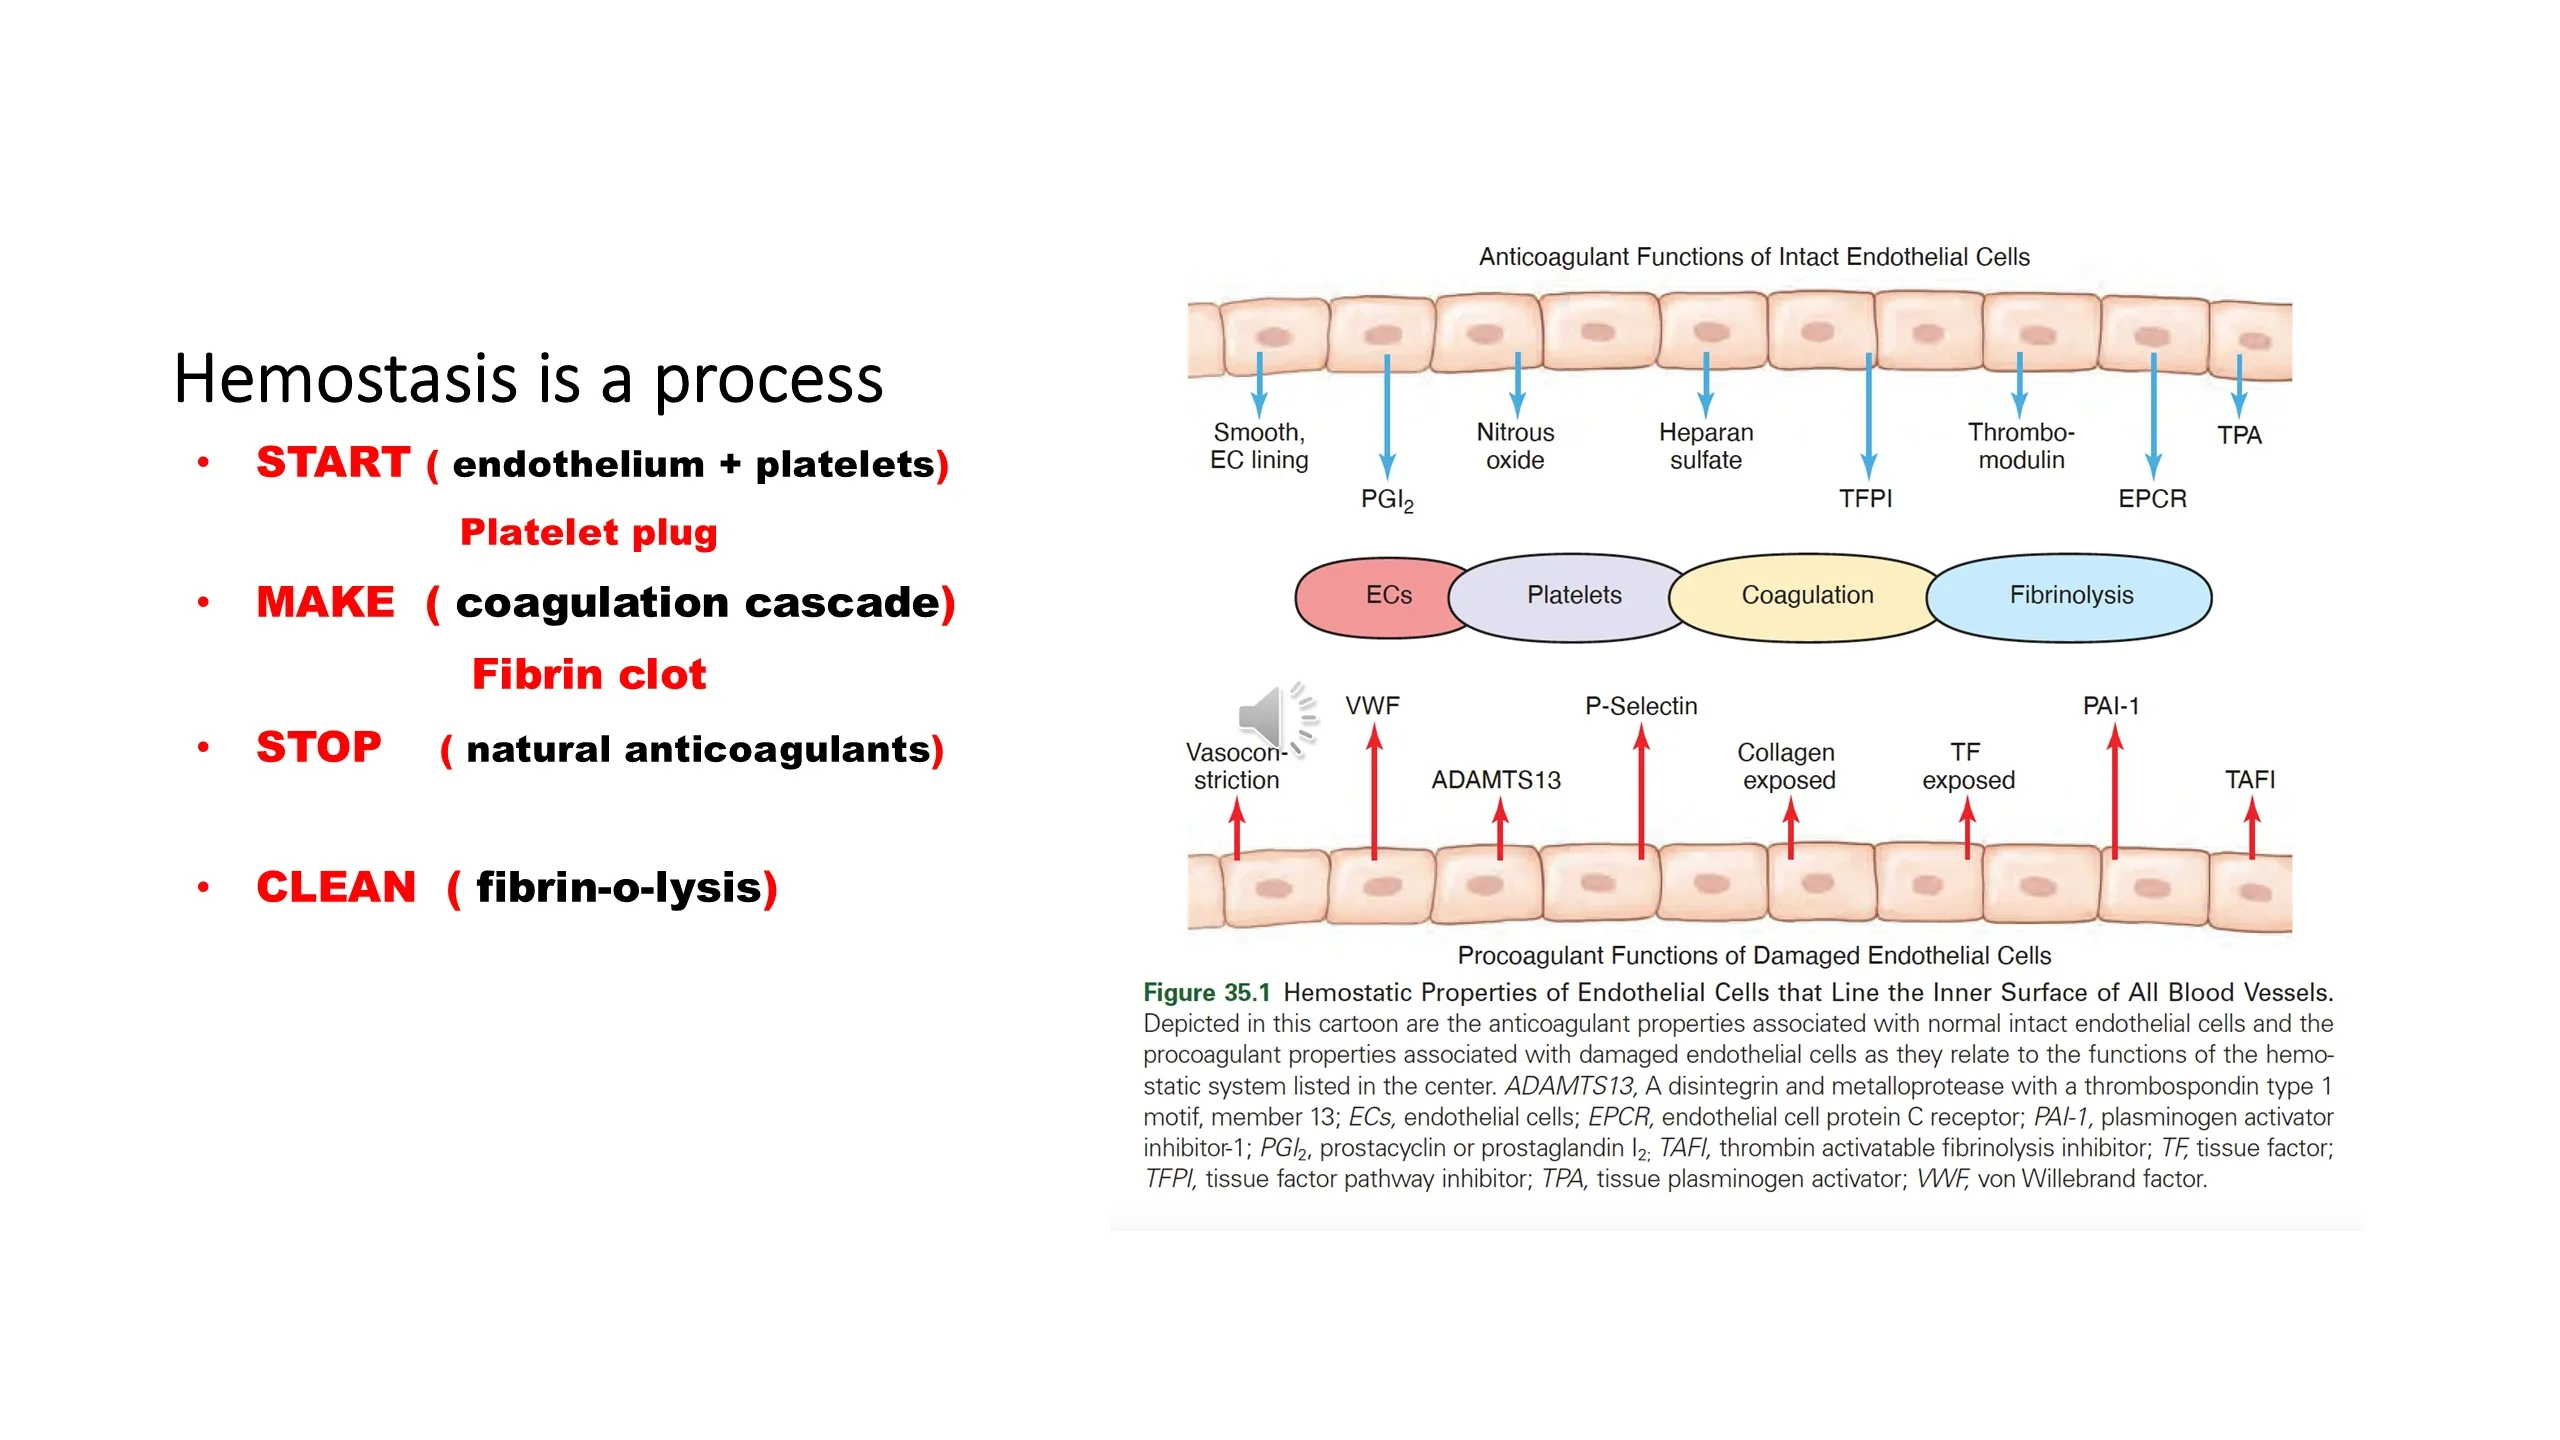
Central sequence of the hemostatic system: ECs → Platelets → Coagulation → Fibrinolysis.
Anticoagulant Functions of Intact Endothelial Cells: Smooth, EC lining; PGI2; Nitrous oxide; Heparan sulfate; TFPI; Thrombo-modulin; EPCR; TPA.
Procoagulant Functions of Damaged Endothelial Cells: Vasoconstriction; VWF; ADAMTS13; P-Selectin; Collagen exposed; TF exposed; PAI-1; TAFI.
Figure 35.1 Hemostatic Properties of Endothelial Cells that Line the Inner Surface of All Blood Vessels. Depicted in this cartoon are the anticoagulant properties associated with normal intact endothelial cells and the procoagulant properties associated with damaged endothelial cells as they relate to the functions of the hemostatic system listed in the center. ADAMTS13, A disintegrin and metalloprotease with a thrombospondin type 1 motif, member 13; ECs, endothelial cells; EPCR, endothelial cell protein C receptor; PAI-1, plasminogen activator inhibitor-1; PGI2, prostacyclin or prostaglandin I2; TAFI, thrombin activatable fibrinolysis inhibitor; TF, tissue factor; TFPI, tissue factor pathway inhibitor; TPA, tissue plasminogen activator; VWF, von Willebrand factor.
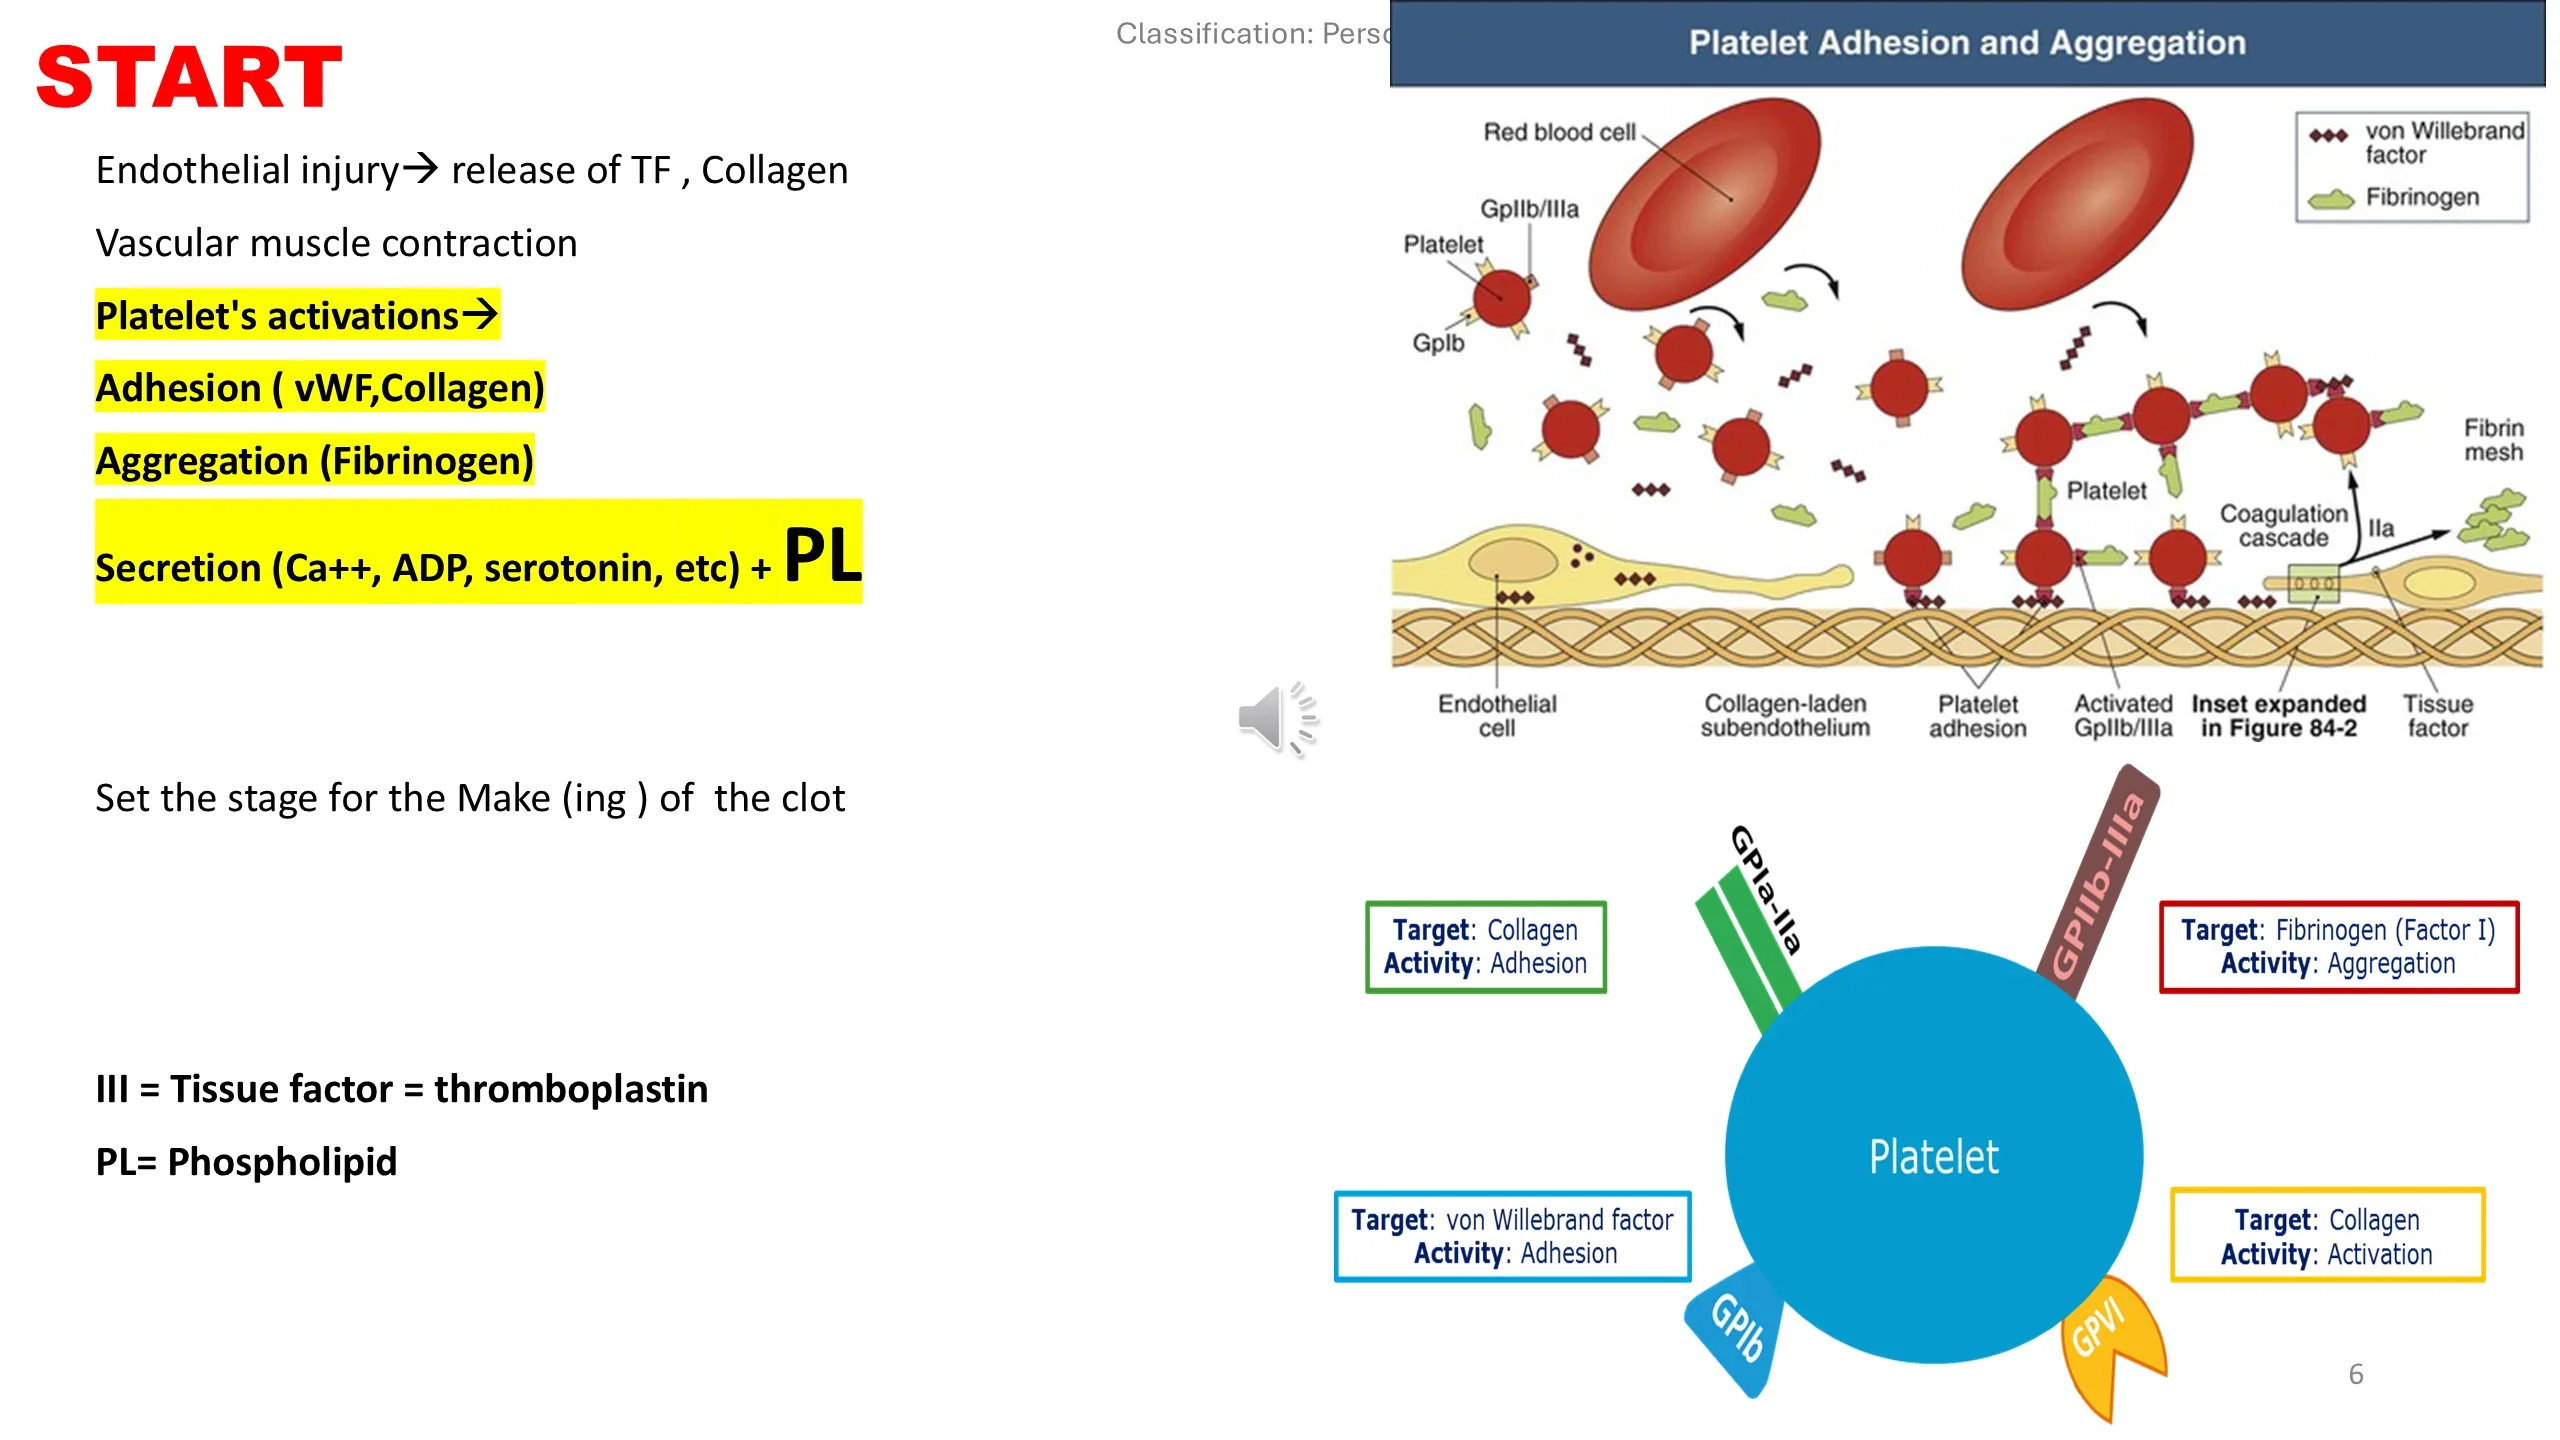
START
Endothelial injury → release of TF , Collagen
Vascular muscle contraction
Platelet's activations →
- Adhesion ( vWF, Collagen)
- Aggregation (Fibrinogen)
- Secretion (Ca++, ADP, serotonin, etc) + PL
Set the stage for the Make (ing ) of the clot
III = Tissue factor = thromboplastin
PL= Phospholipid
Platelet Adhesion and Aggregation
Diagram legend: von Willebrand factor; Fibrinogen. Steps shown across the subendothelium: Endothelial cell → Collagen-laden subendothelium → Platelet adhesion (via GpIb) → Activated GpIIb/IIIa → Tissue factor, with the Coagulation cascade (IIa) building a Fibrin mesh.
Platelet glycoprotein receptors and their targets/activities:
- GPIb — Target: von Willebrand factor; Activity: Adhesion
- GPIa-IIa — Target: Collagen; Activity: Adhesion
- GPIIb-IIIa — Target: Fibrinogen (Factor I); Activity: Aggregation
- GPVI — Target: Collagen; Activity: Activation
Platelet plug
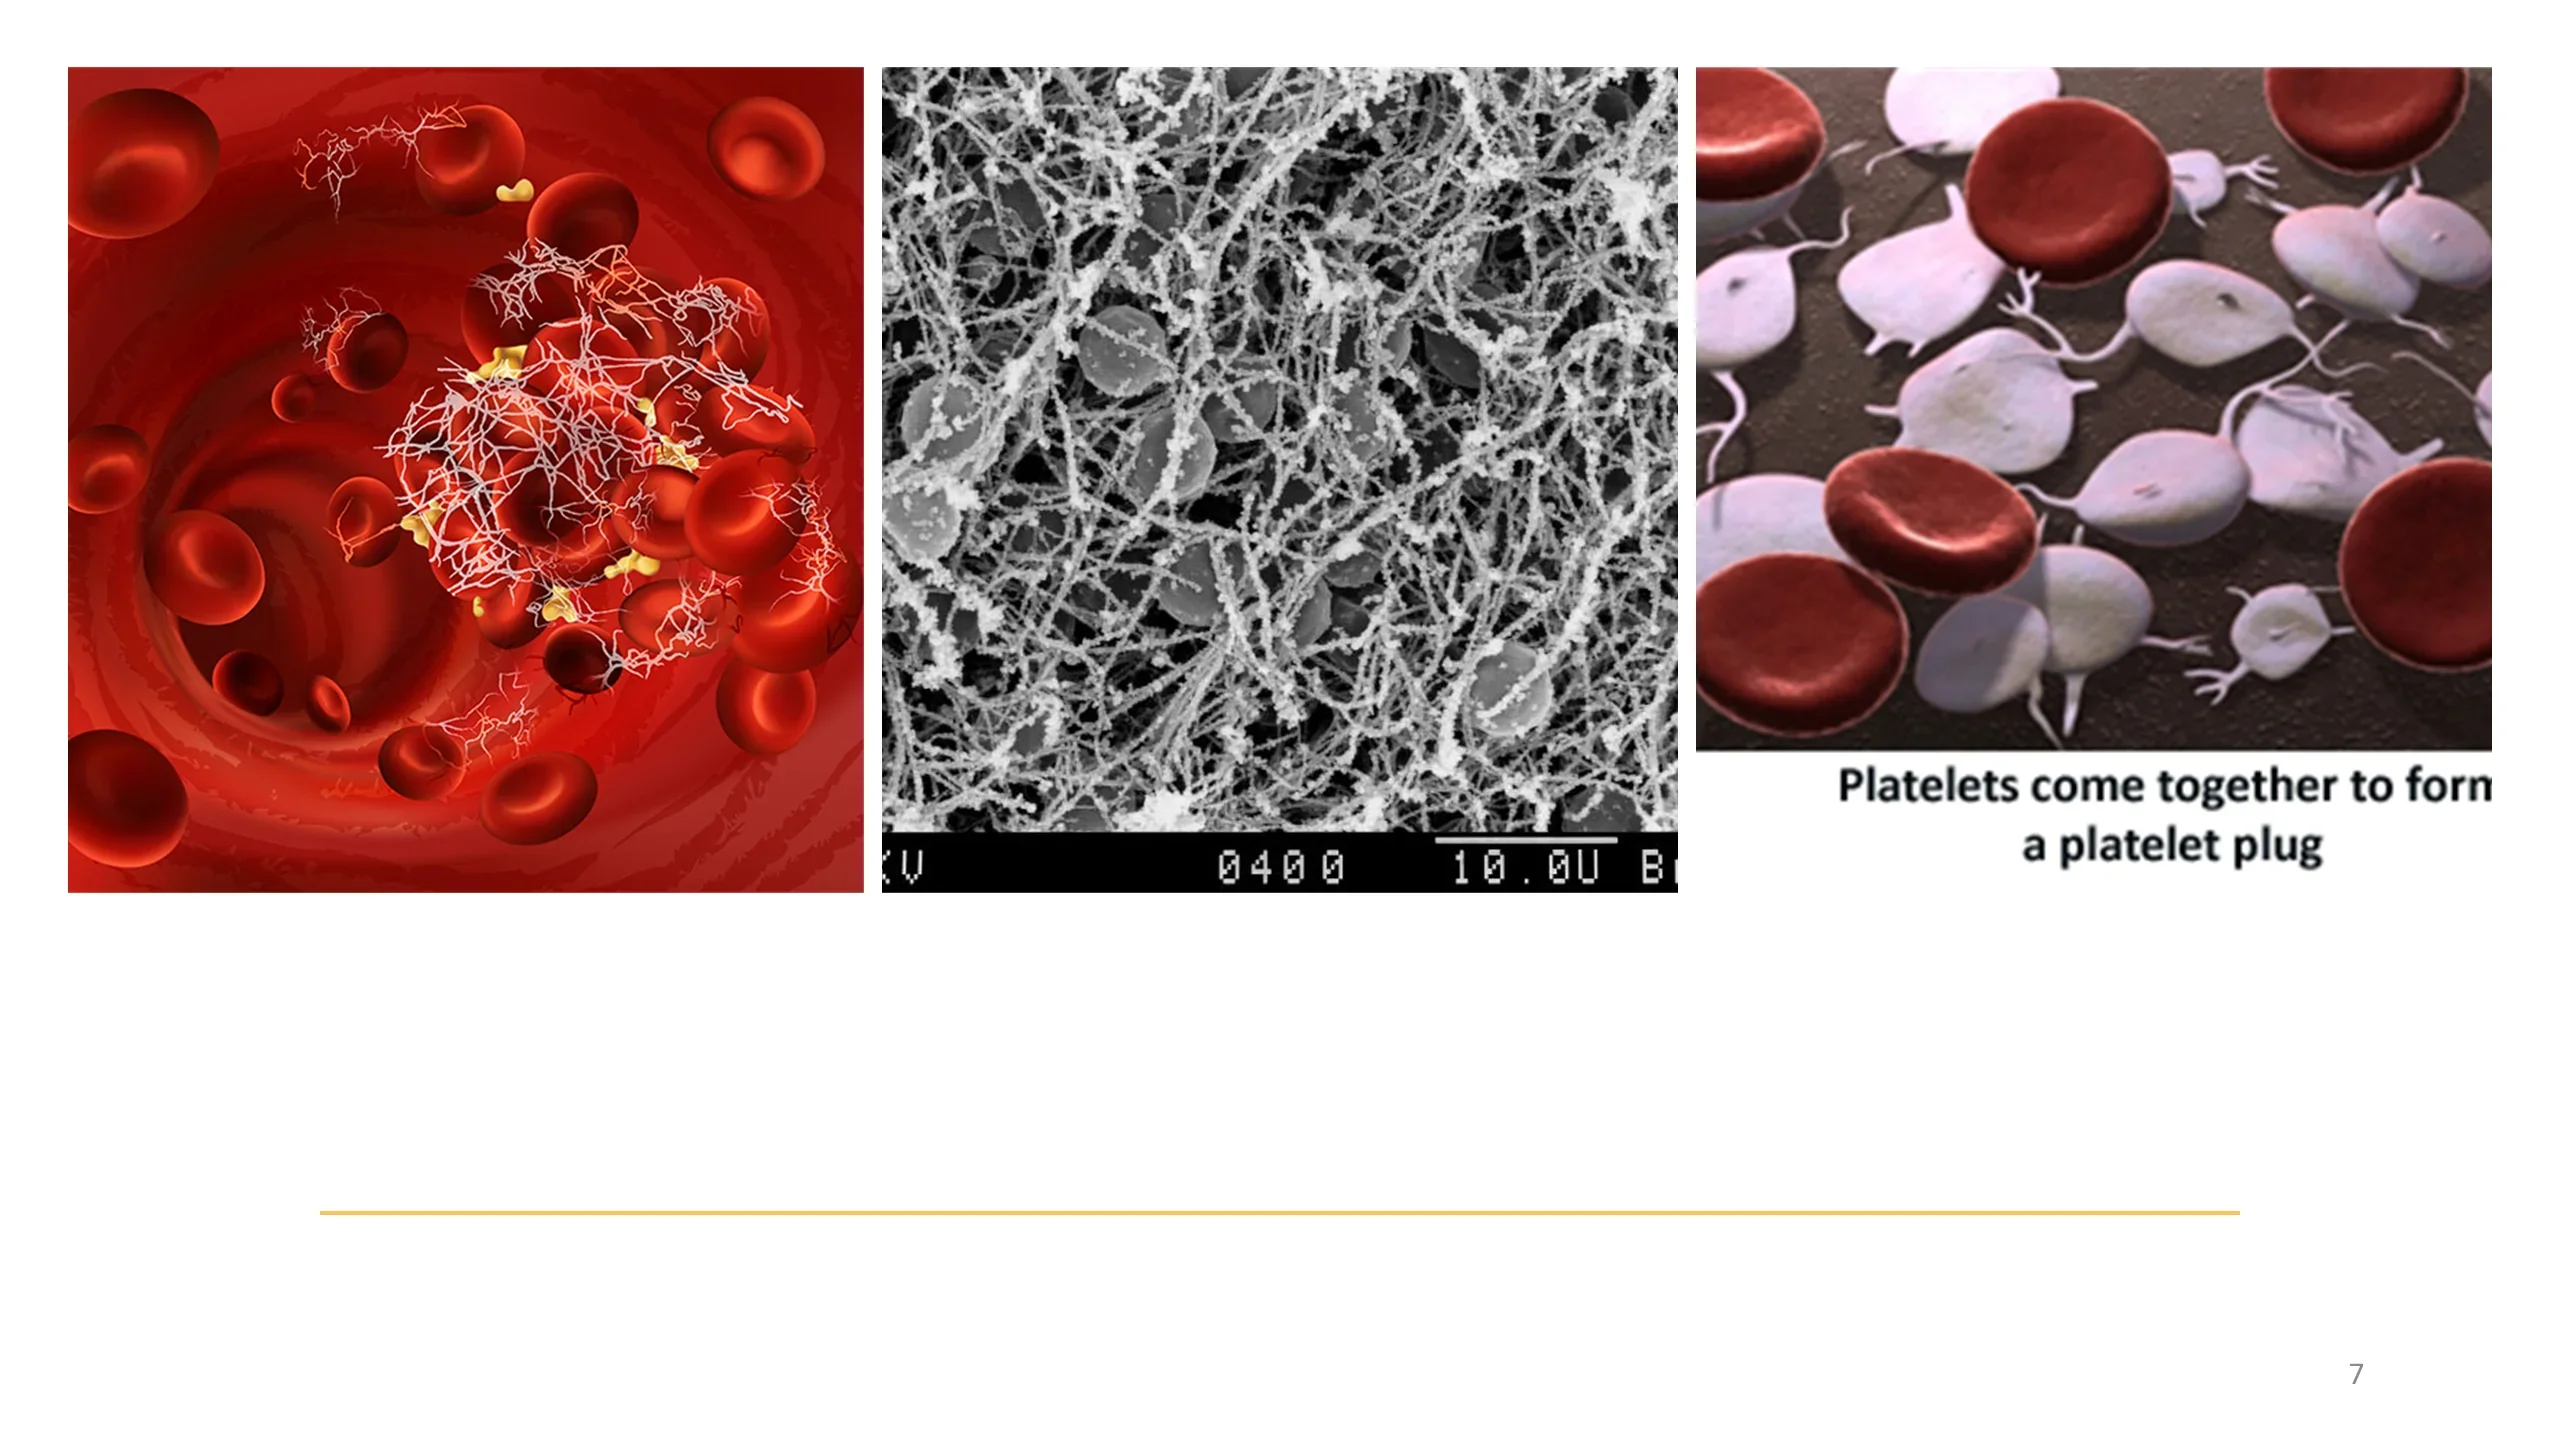
Three visuals of clot formation:
- Illustration of a forming clot with red blood cells trapped in a fibrin network.
- Scanning electron micrograph of a fibrin mesh entrapping blood cells (scale bar 10.0U).
- Photomicrograph captioned: "Platelets come together to form a platelet plug".
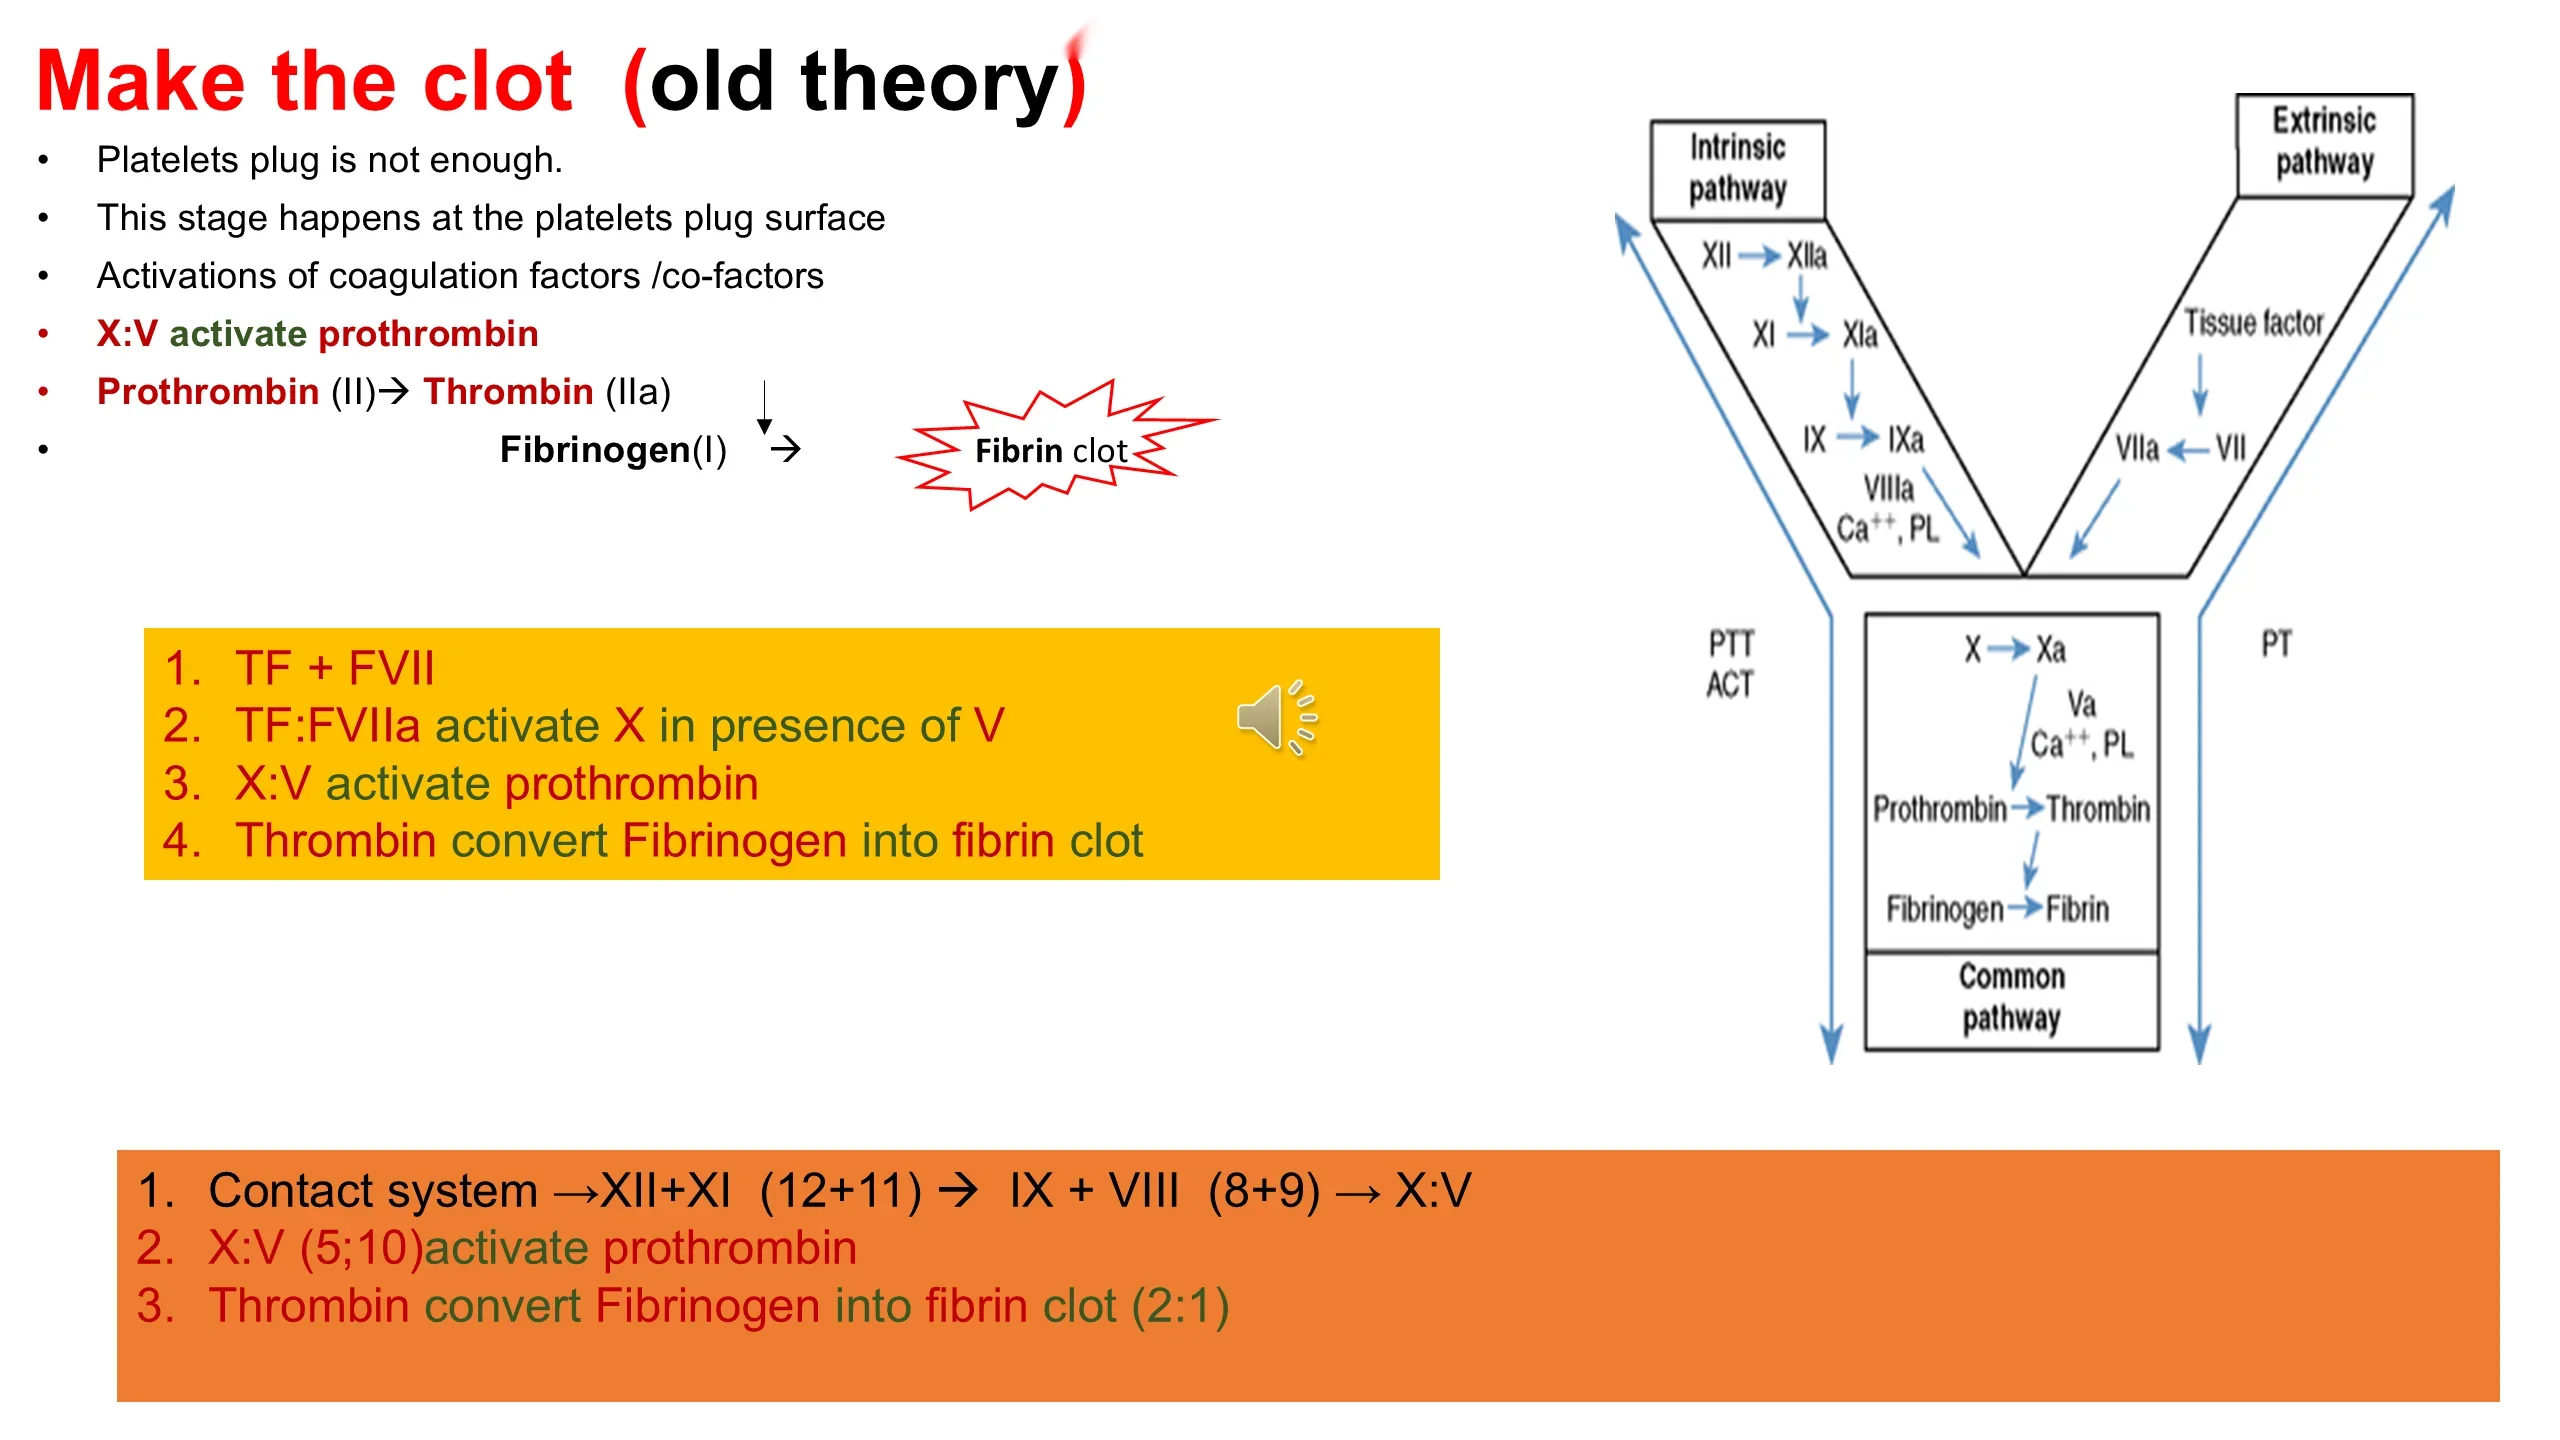
Make the clot (old theory)
- Platelets plug is not enough.
- This stage happens at the platelets plug surface
- Activations of coagulation factors /co-factors
- X:V activate prothrombin
- Prothrombin (II) → Thrombin (IIa)
- Fibrinogen(I) → Fibrin clot
Yellow box:
- TF + FVII
- TF:FVIIa activate X in presence of V
- X:V activate prothrombin
- Thrombin convert Fibrinogen into fibrin clot
Orange box:
- Contact system → XII+XI (12+11) → IX + VIII (8+9) → X:V
- X:V (5;10) activate prothrombin
- Thrombin convert Fibrinogen into fibrin clot (2:1)
Cascade diagram logic: Intrinsic pathway (measured by PTT / ACT): XII → XIIa → XI → XIa → IX → IXa (with VIIIa, Ca++, PL). Extrinsic pathway (measured by PT): Tissue factor → VII → VIIa. Both converge on the Common pathway: X → Xa (with Va, Ca++, PL) → Prothrombin → Thrombin → Fibrinogen → Fibrin.
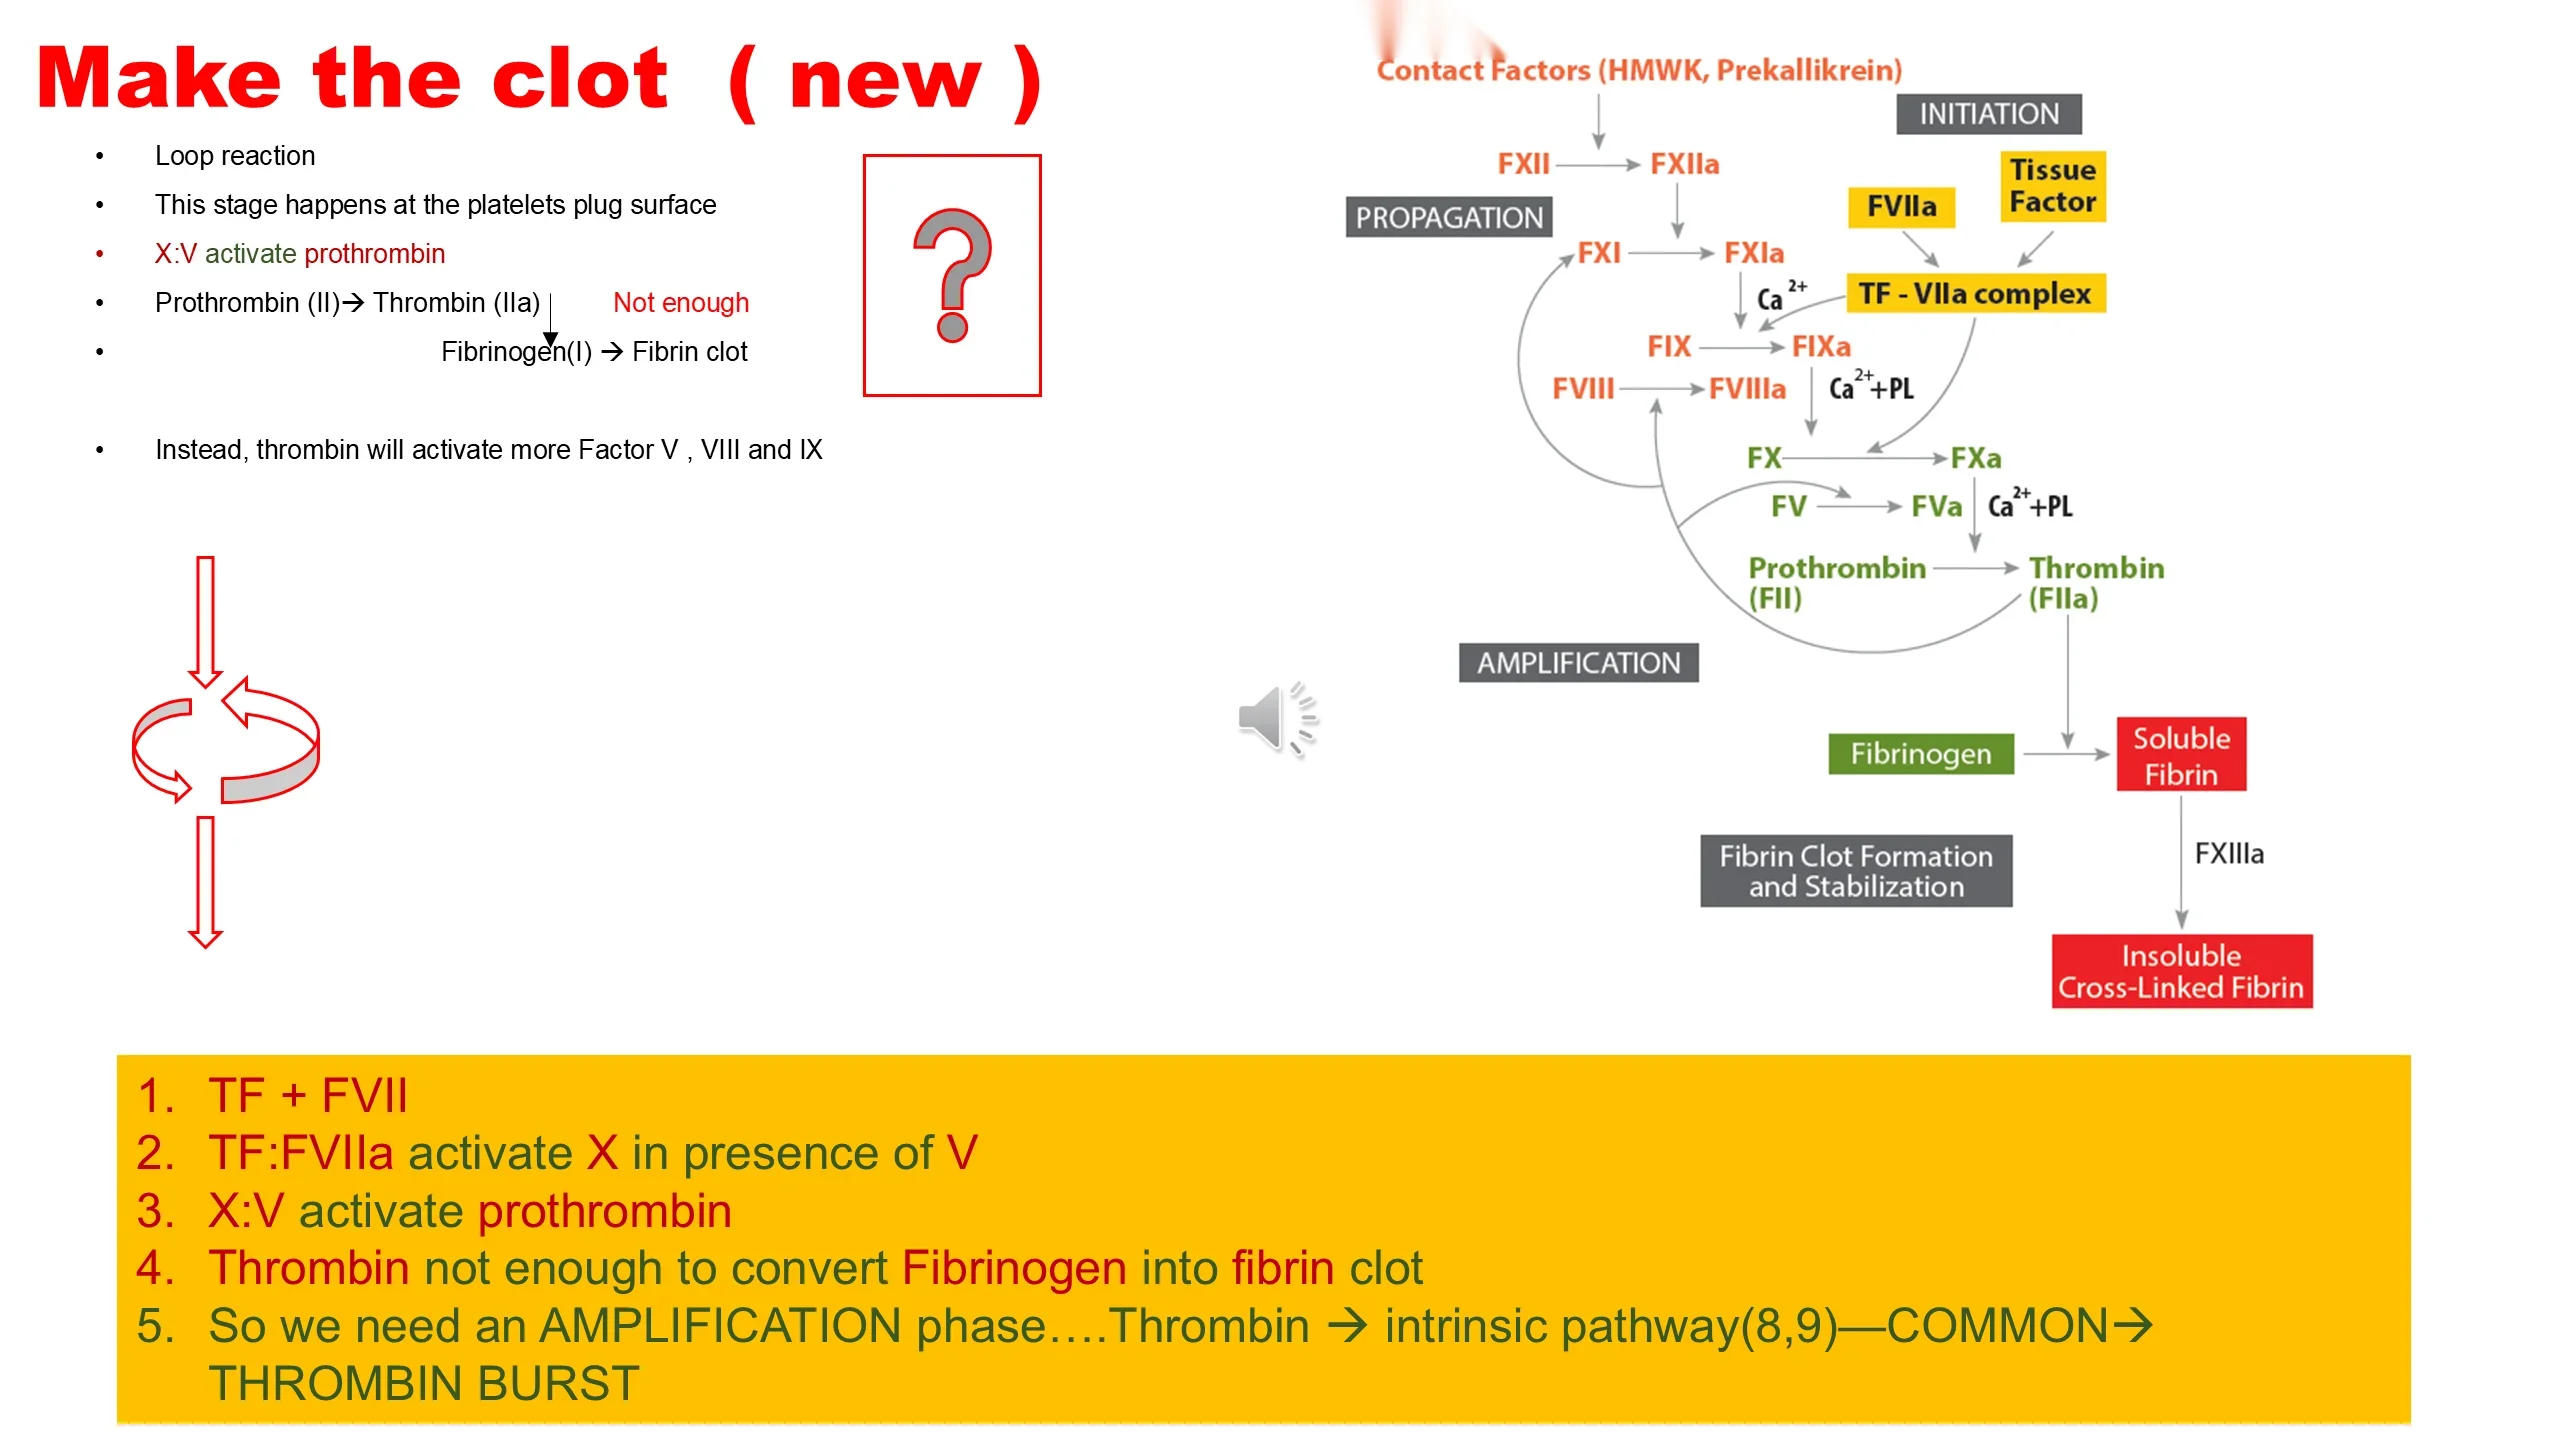
Make the clot ( new )
- Loop reaction
- This stage happens at the platelets plug surface
- X:V activate prothrombin
- Prothrombin (II) → Thrombin (IIa) — Not enough
- Fibrinogen(I) → Fibrin clot
- Instead, thrombin will activate more Factor V , VIII and IX
Yellow box:
- TF + FVII
- TF:FVIIa activate X in presence of V
- X:V activate prothrombin
- Thrombin not enough to convert Fibrinogen into fibrin clot
- So we need an AMPLIFICATION phase….Thrombin → intrinsic pathway(8,9)—COMMON→ THROMBIN BURST
Cell-based cascade diagram logic: INITIATION — Tissue Factor + FVIIa form the TF-VIIa complex. PROPAGATION / AMPLIFICATION — Contact Factors (HMWK, Prekallikrein); FXII → FXIIa; FXI → FXIa (Ca2+); FIX → FIXa; FVIII → FVIIIa (Ca2+ + PL); FX → FXa; FV → FVa (Ca2+ + PL); Prothrombin (FII) → Thrombin (FIIa). Thrombin feeds back to amplify FVIII, FIX, FV. Fibrin Clot Formation and Stabilization: Fibrinogen → Soluble Fibrin → (via FXIIIa) Insoluble Cross-Linked Fibrin.
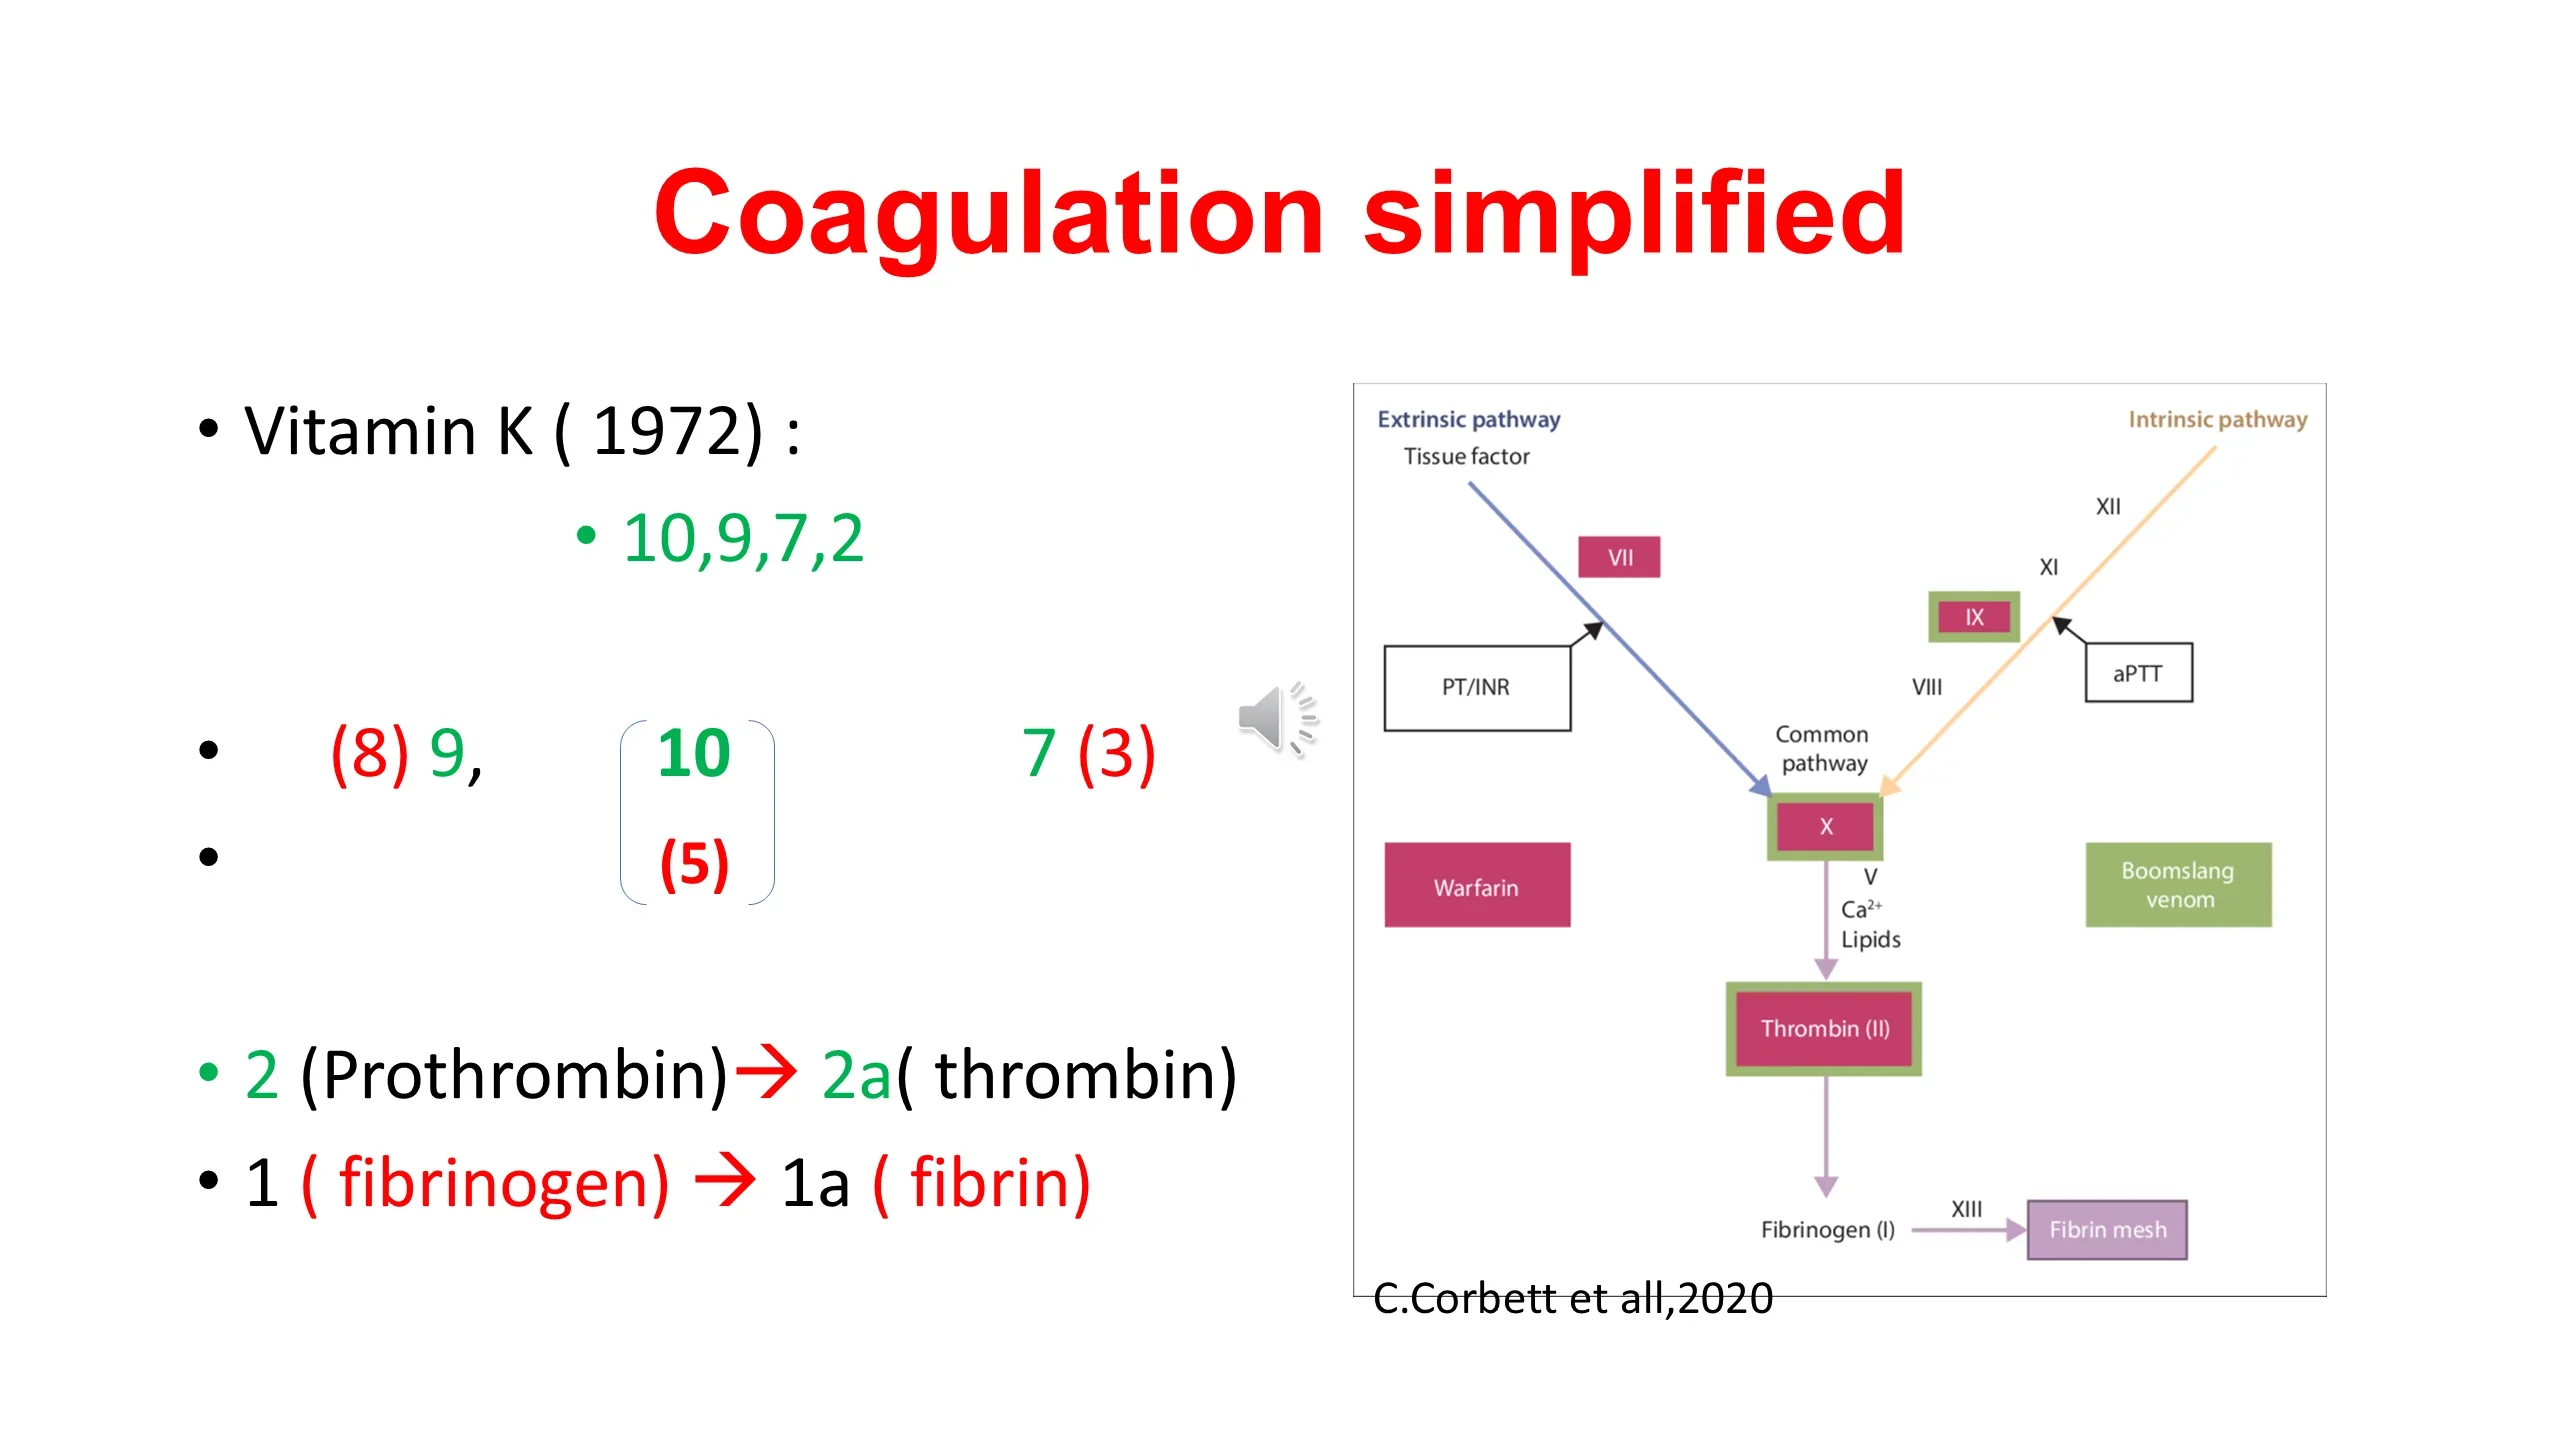
Coagulation simplified
- Vitamin K ( 1972) :
- 10,9,7,2
- (8) 9, 10 [ (5) ] 7 (3)
- 2 (Prothrombin) → 2a ( thrombin)
- 1 ( fibrinogen) → 1a ( fibrin)
Cascade diagram (C. Corbett et all, 2020) logic: Extrinsic pathway — Tissue factor → VII (measured by PT/INR; Warfarin acts here). Intrinsic pathway — XII → XI → IX (with VIII) (measured by aPTT). Both converge on the Common pathway: X (with V, Ca2+, Lipids) → Thrombin (II) → Fibrinogen (I) → (via XIII) Fibrin mesh. Boomslang venom acts on Factor X.
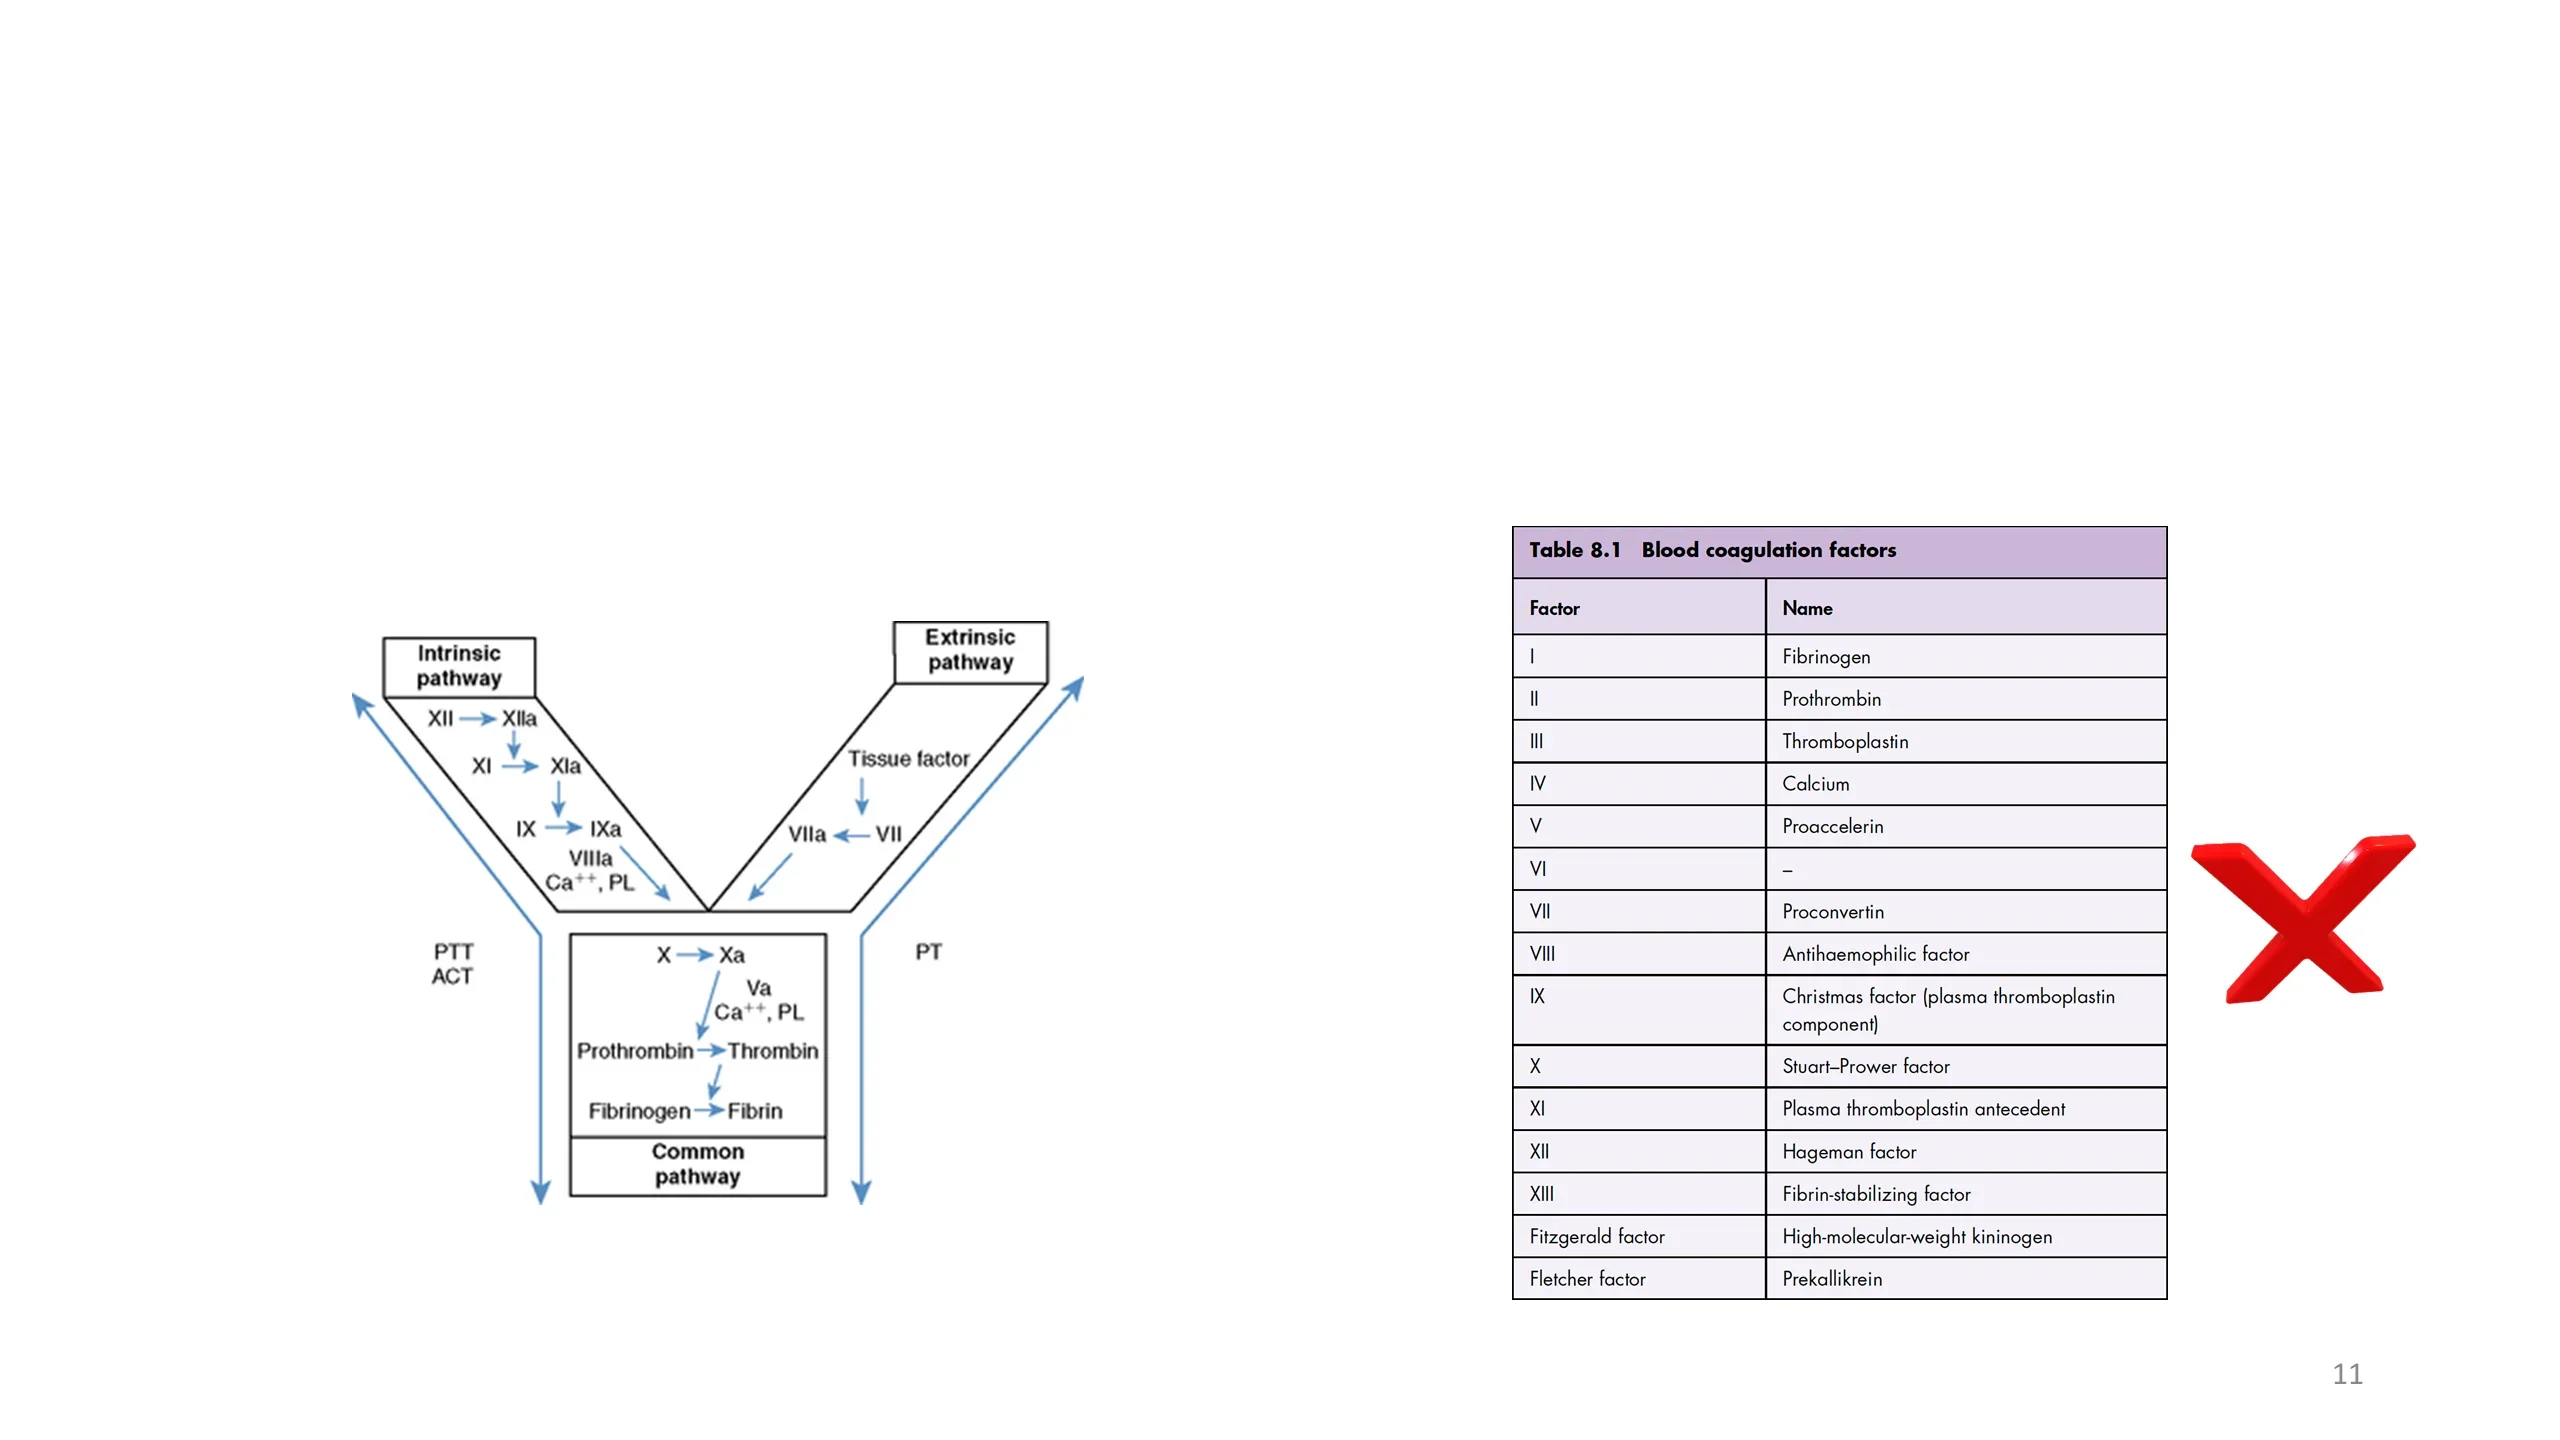
Coagulation cascade (Table 8.1 Blood coagulation factors)
Cascade diagram logic: Intrinsic pathway (PTT / ACT): XII → XIIa → XI → XIa → IX → IXa (with VIIIa, Ca++, PL). Extrinsic pathway (PT): Tissue factor → VII → VIIa. Common pathway: X → Xa (with Va, Ca++, PL) → Prothrombin → Thrombin → Fibrinogen → Fibrin.
| Factor | Name |
|---|---|
| I | Fibrinogen |
| II | Prothrombin |
| III | Thromboplastin |
| IV | Calcium |
| V | Proaccelerin |
| VI | – |
| VII | Proconvertin |
| VIII | Antihaemophilic factor |
| IX | Christmas factor (plasma thromboplastin component) |
| X | Stuart–Prower factor |
| XI | Plasma thromboplastin antecedent |
| XII | Hageman factor |
| XIII | Fibrin-stabilizing factor |
| Fitzgerald factor | High-molecular-weight kininogen |
| Fletcher factor | Prekallikrein |
(A large red X mark is placed beside the table.)
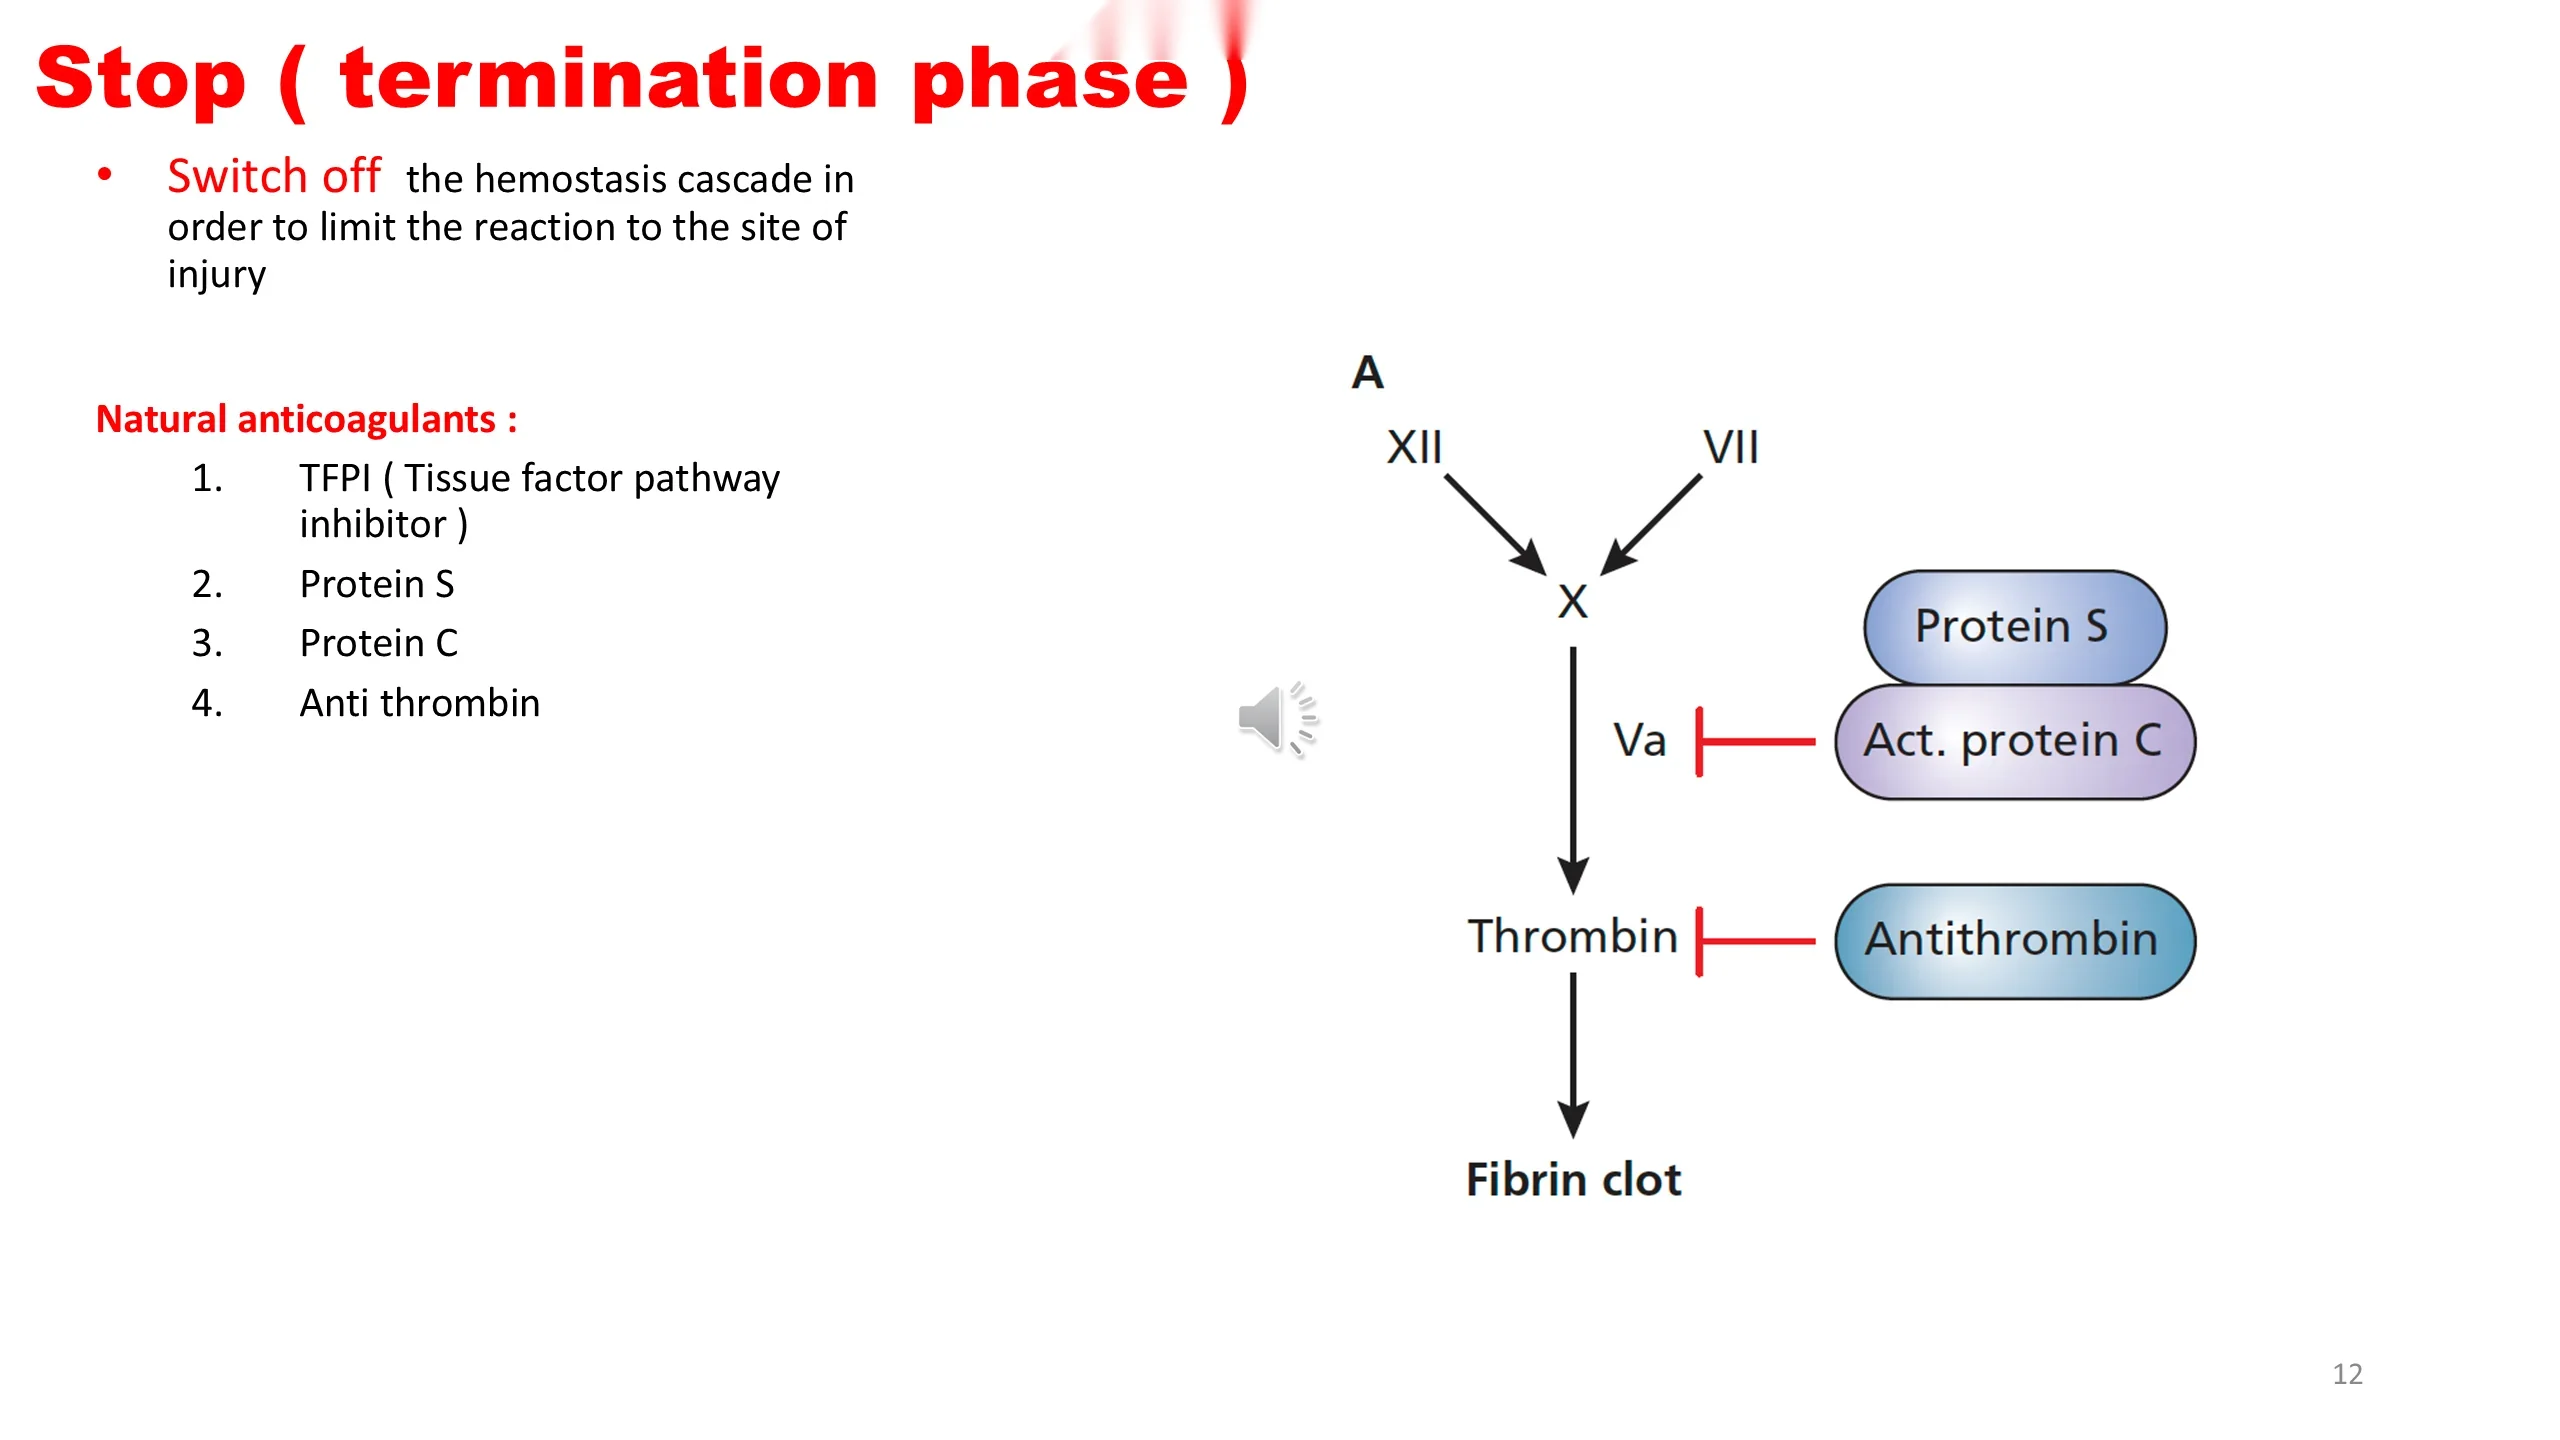
Stop ( termination phase )
- Switch off the hemostasis cascade in order to limit the reaction to the site of injury
Natural anticoagulants :
- TFPI ( Tissue factor pathway inhibitor )
- Protein S
- Protein C
- Anti thrombin
Diagram A logic: XII and VII converge on X → Va → Thrombin → Fibrin clot. Inhibition points: Act. protein C (with Protein S) inhibits Va; Antithrombin inhibits Thrombin.
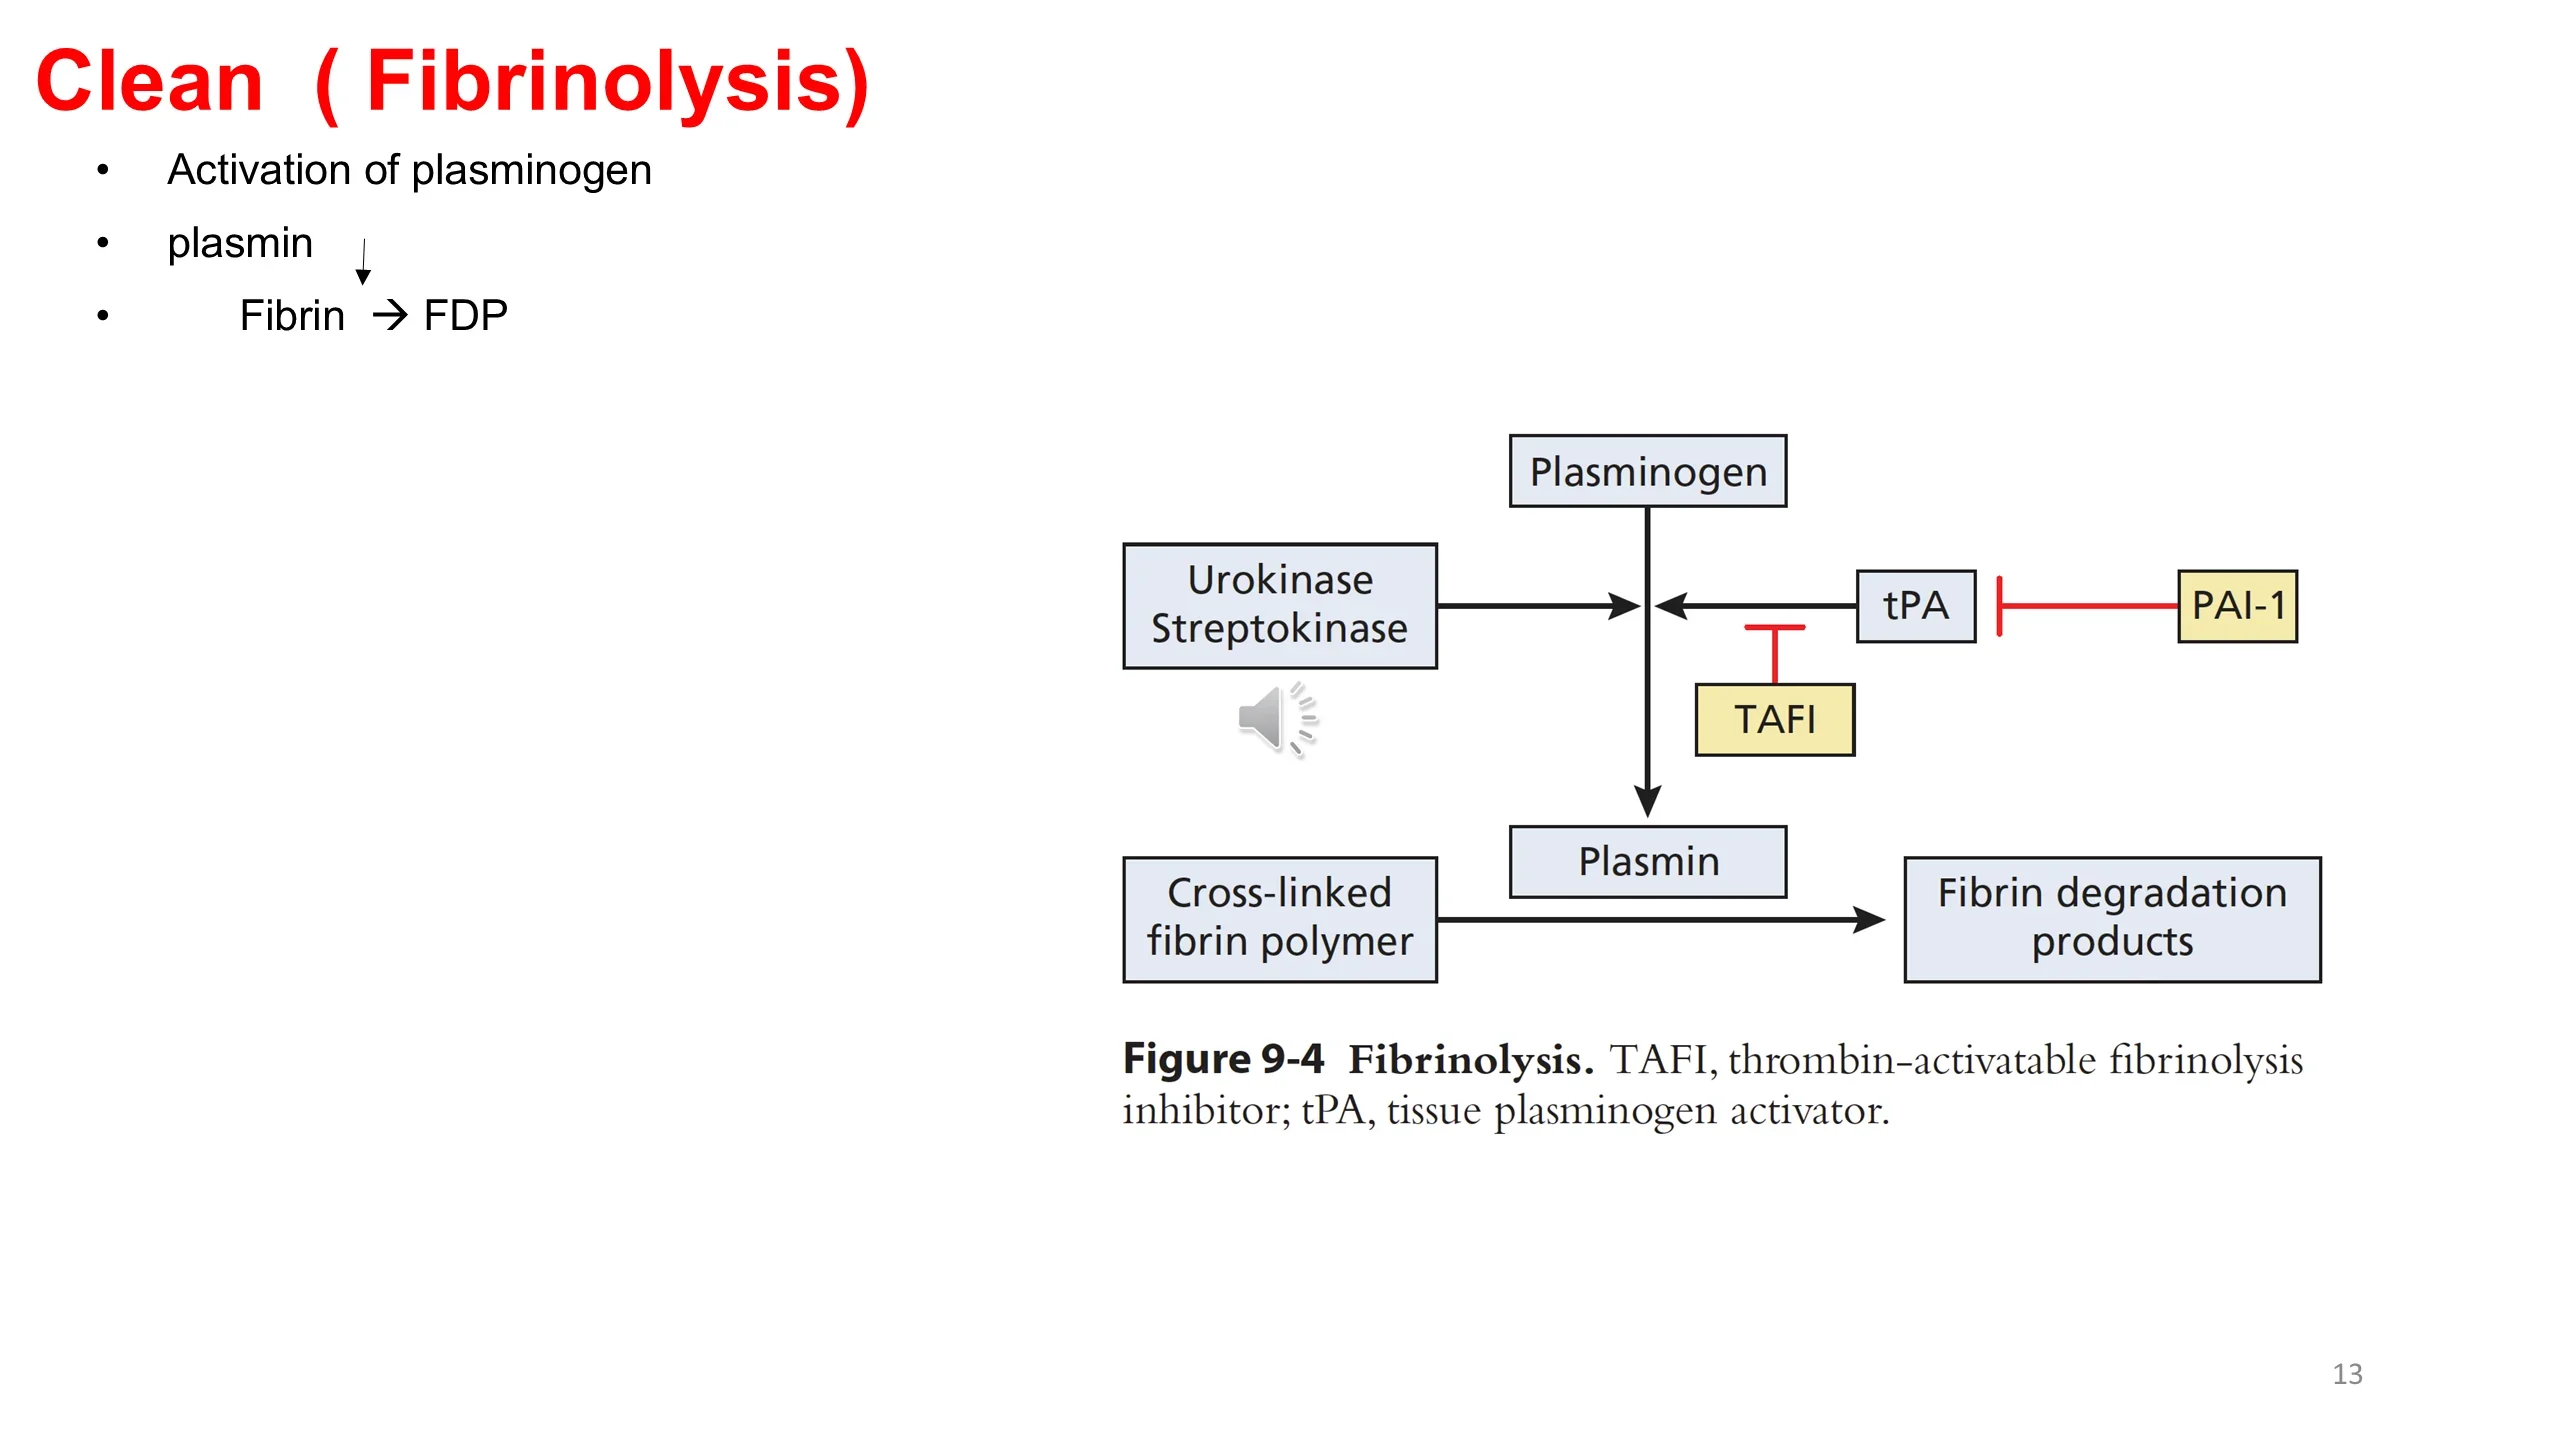
Clean ( Fibrinolysis)
- Activation of plasminogen
- plasmin
- Fibrin → FDP
Diagram logic: Plasminogen is activated to Plasmin by Urokinase / Streptokinase and by tPA. Plasmin degrades Cross-linked fibrin polymer into Fibrin degradation products. Inhibitors: TAFI inhibits the activation step; PAI-1 inhibits tPA.
Figure 9-4 Fibrinolysis. TAFI, thrombin–activatable fibrinolysis inhibitor; tPA, tissue plasminogen activator.
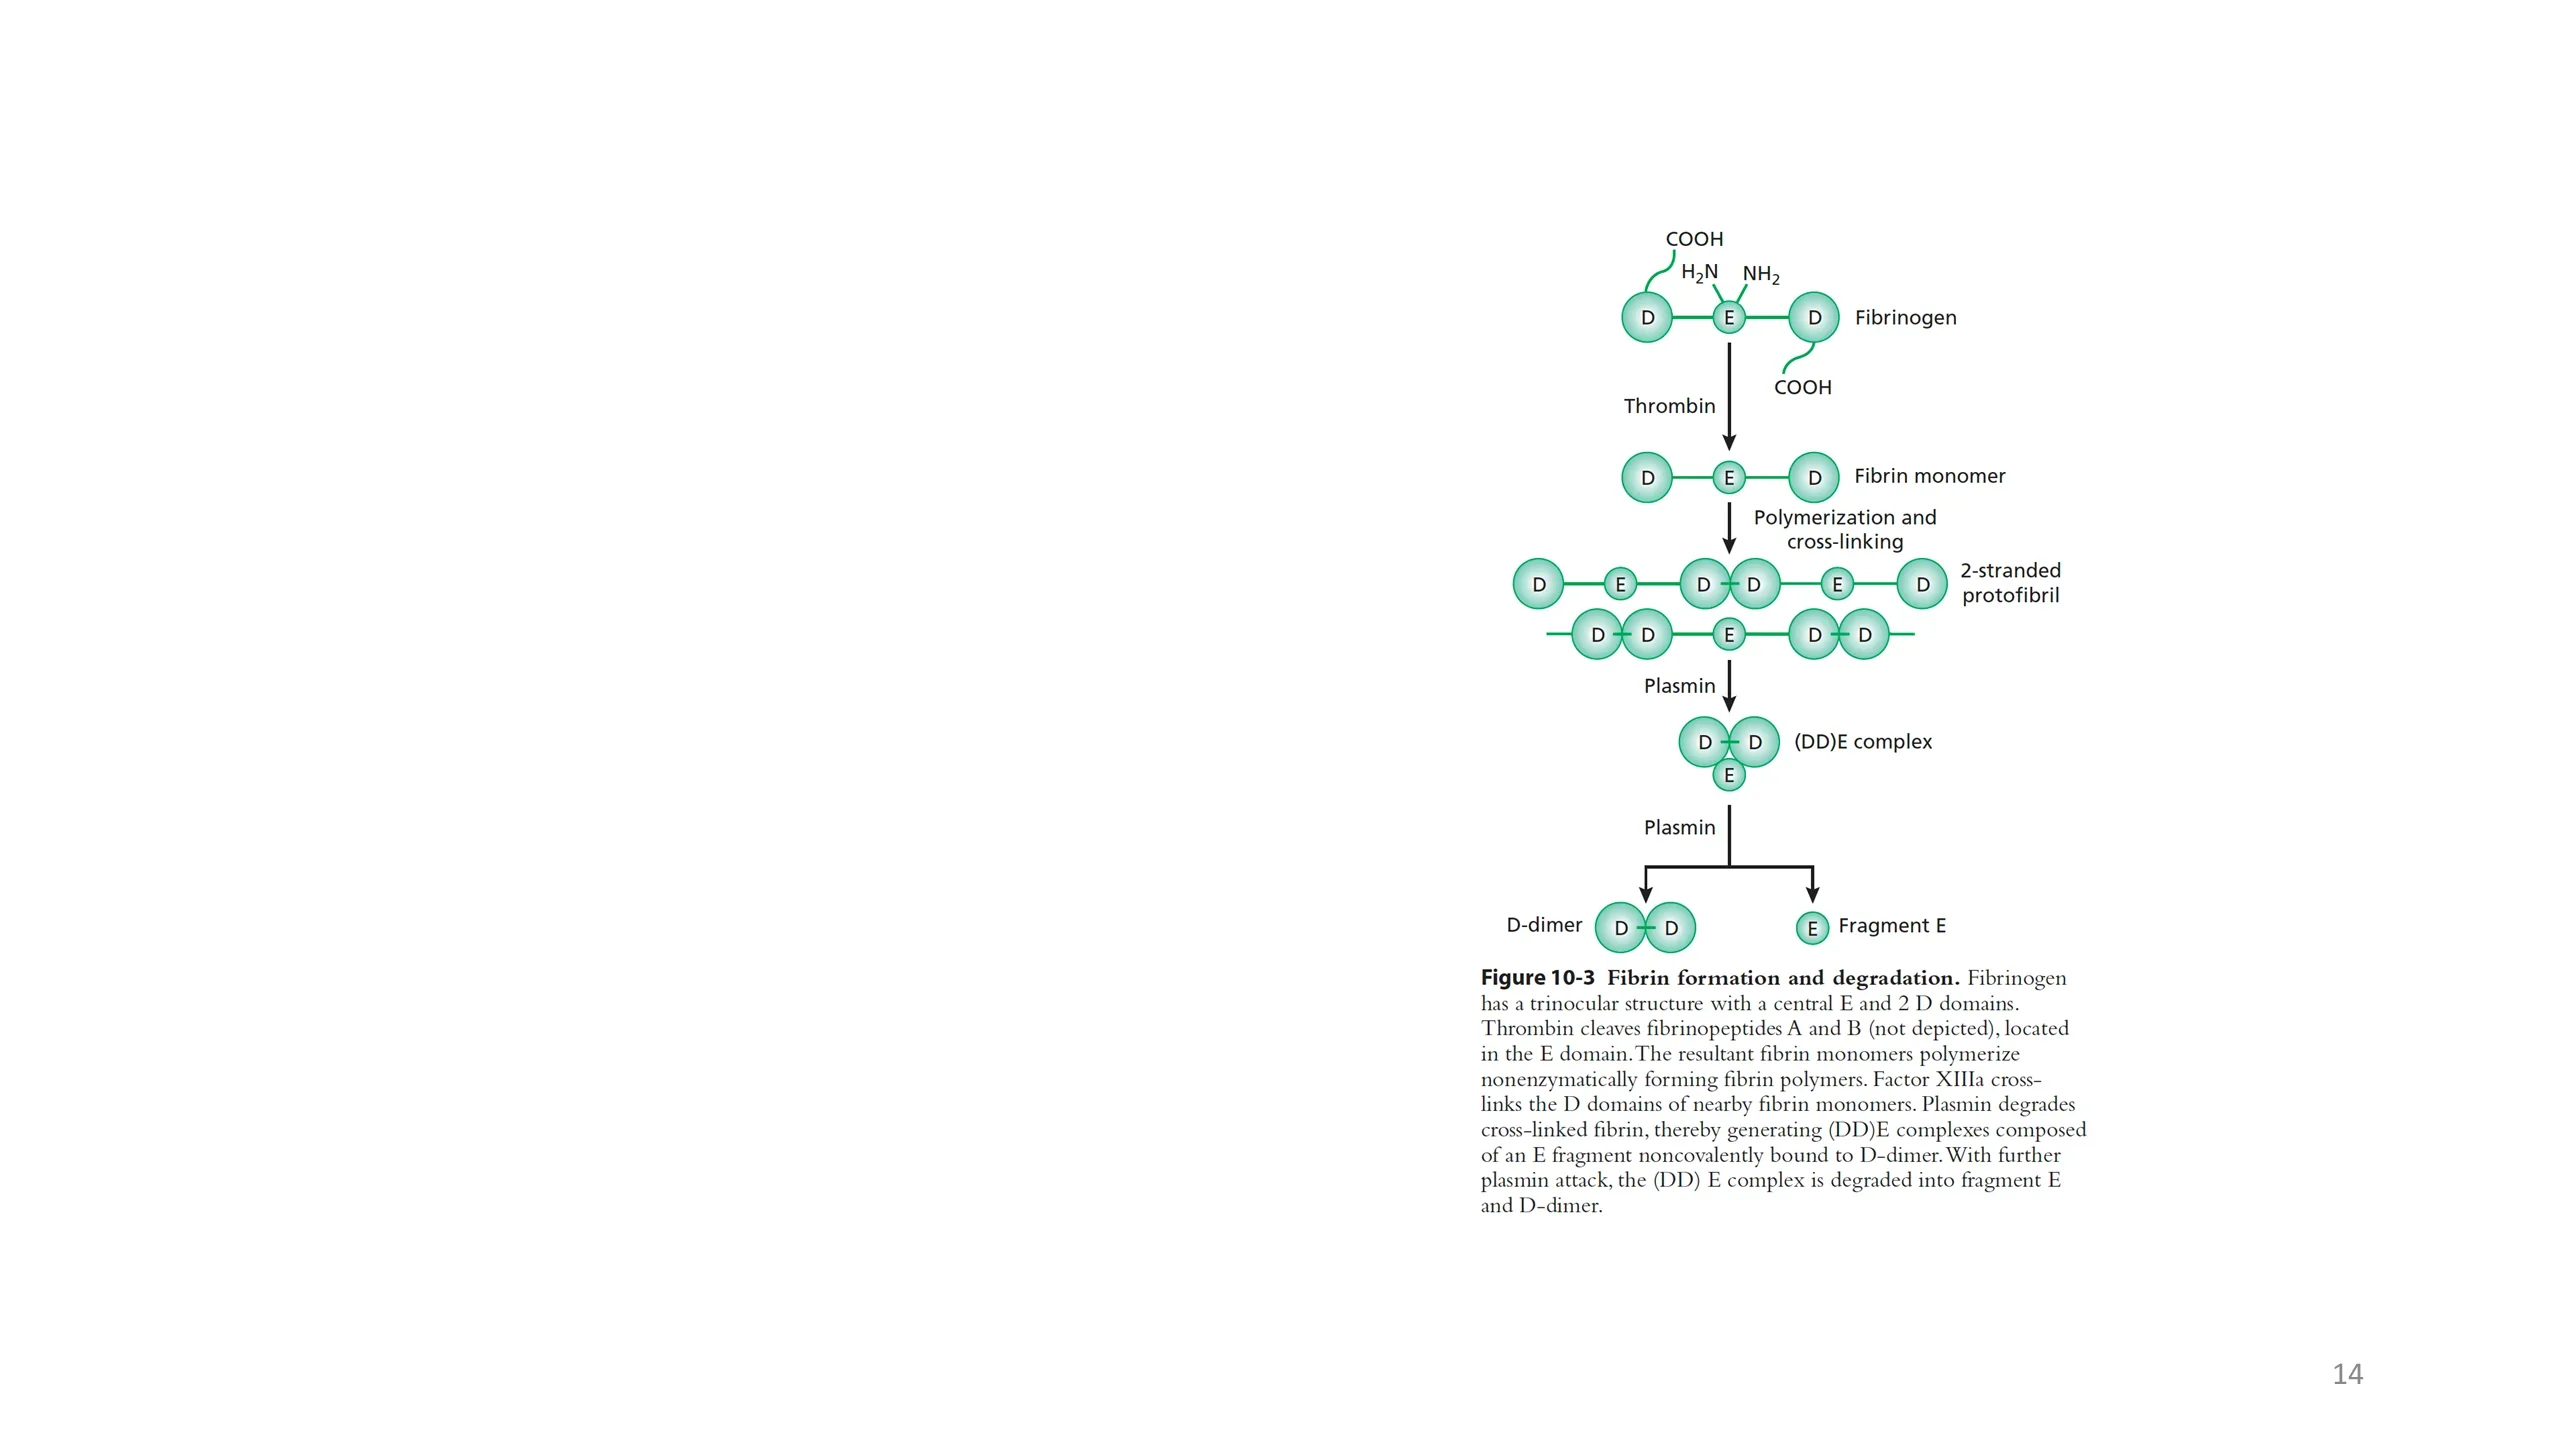
Fibrin formation and degradation
Diagram logic: Fibrinogen (trinodular D–E–D structure with COOH and NH2 termini) → (Thrombin) → Fibrin monomer (D–E–D) → (Polymerization and cross-linking) → 2-stranded protofibril → (Plasmin) → (DD)E complex → (Plasmin) → D-dimer (D–D) and Fragment E.
Figure 10-3 Fibrin formation and degradation. Fibrinogen has a trinocular structure with a central E and 2 D domains. Thrombin cleaves fibrinopeptides A and B (not depicted), located in the E domain. The resultant fibrin monomers polymerize nonenzymatically forming fibrin polymers. Factor XIIIa cross-links the D domains of nearby fibrin monomers. Plasmin degrades cross-linked fibrin, thereby generating (DD)E complexes composed of an E fragment noncovalently bound to D-dimer. With further plasmin attack, the (DD) E complex is degraded into fragment E and D-dimer.