Multiple Myeloma
From pathogenesis to diagnosis — the plasma-cell clone, CRAB, and the diagnostic triad.
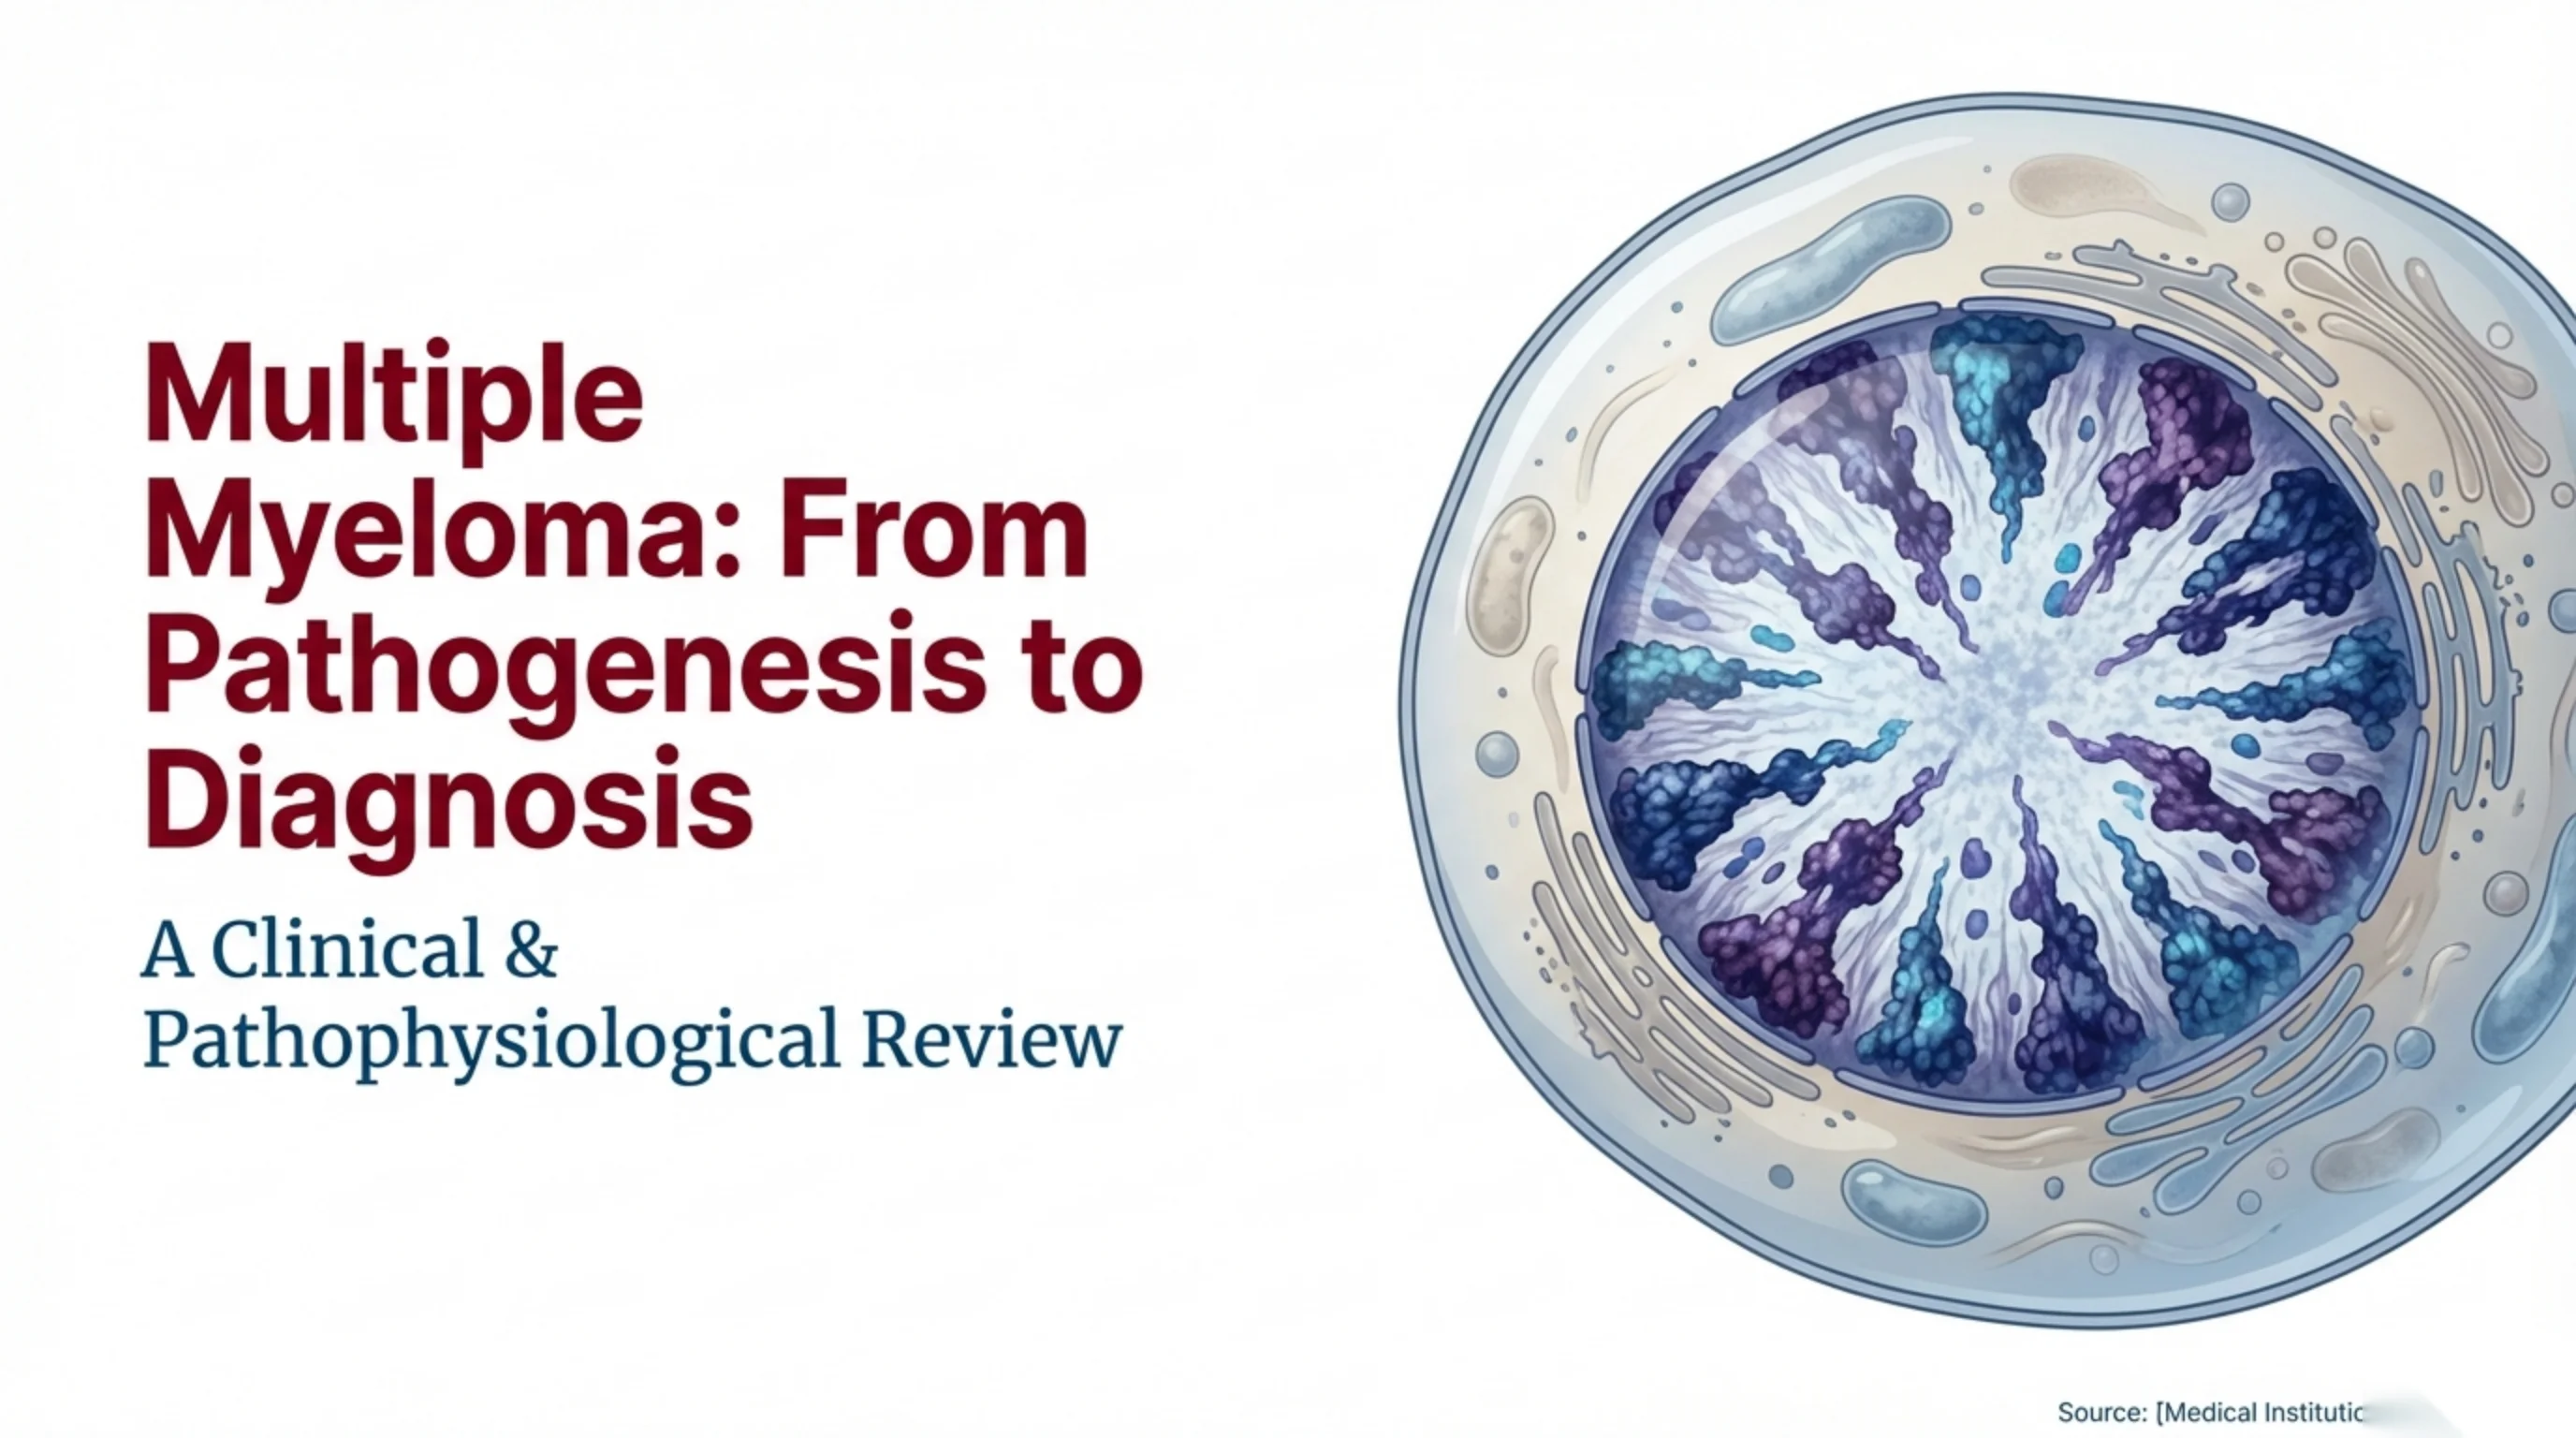
Multiple Myeloma: From Pathogenesis to Diagnosis
A Clinical & Pathophysiological Review
Source: [Medical Institutio… (text cut off at slide edge)
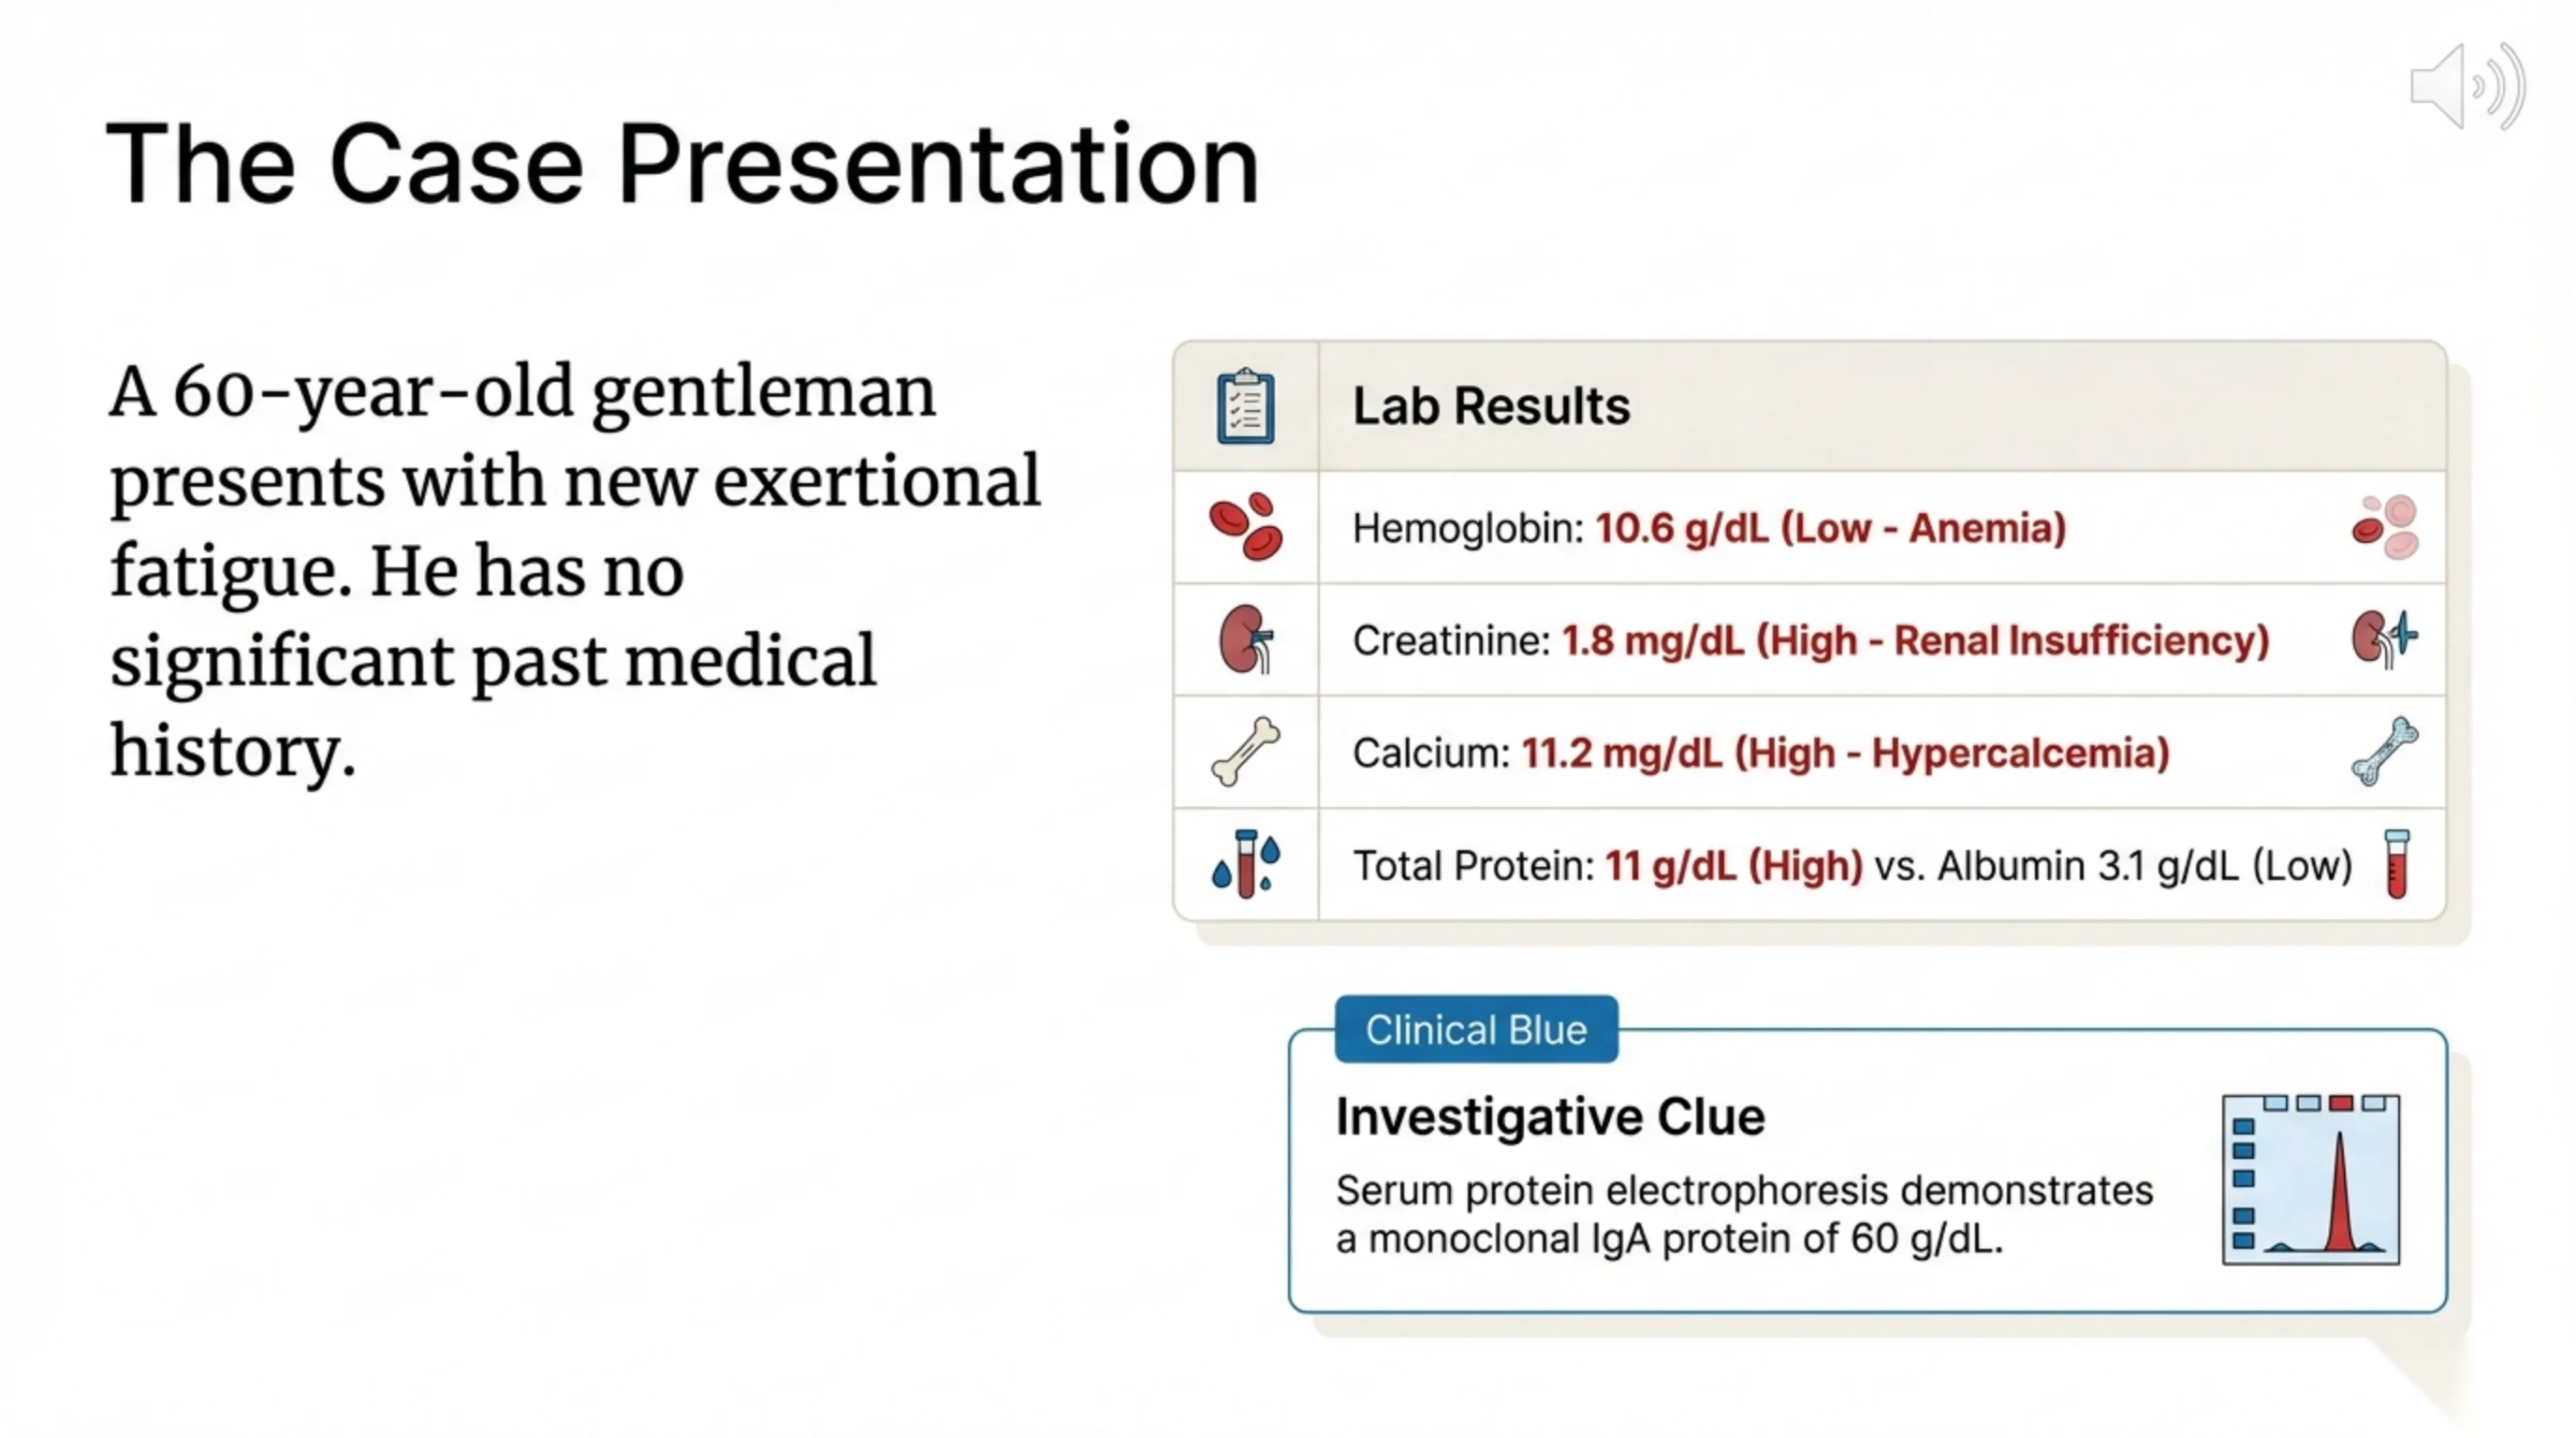
The Case Presentation
A 60-year-old gentleman presents with new exertional fatigue. He has no significant past medical history.
Lab Results
| Test | Value | Interpretation |
|---|---|---|
| Hemoglobin | 10.6 g/dL | Low – Anemia |
| Creatinine | 1.8 mg/dL | High – Renal Insufficiency |
| Calcium | 11.2 mg/dL | High – Hypercalcemia |
| Total Protein | 11 g/dL | High — vs. Albumin 3.1 g/dL (Low) |
Investigative Clue (Clinical Blue)
Serum protein electrophoresis demonstrates a monoclonal IgA protein of 60 g/dL.
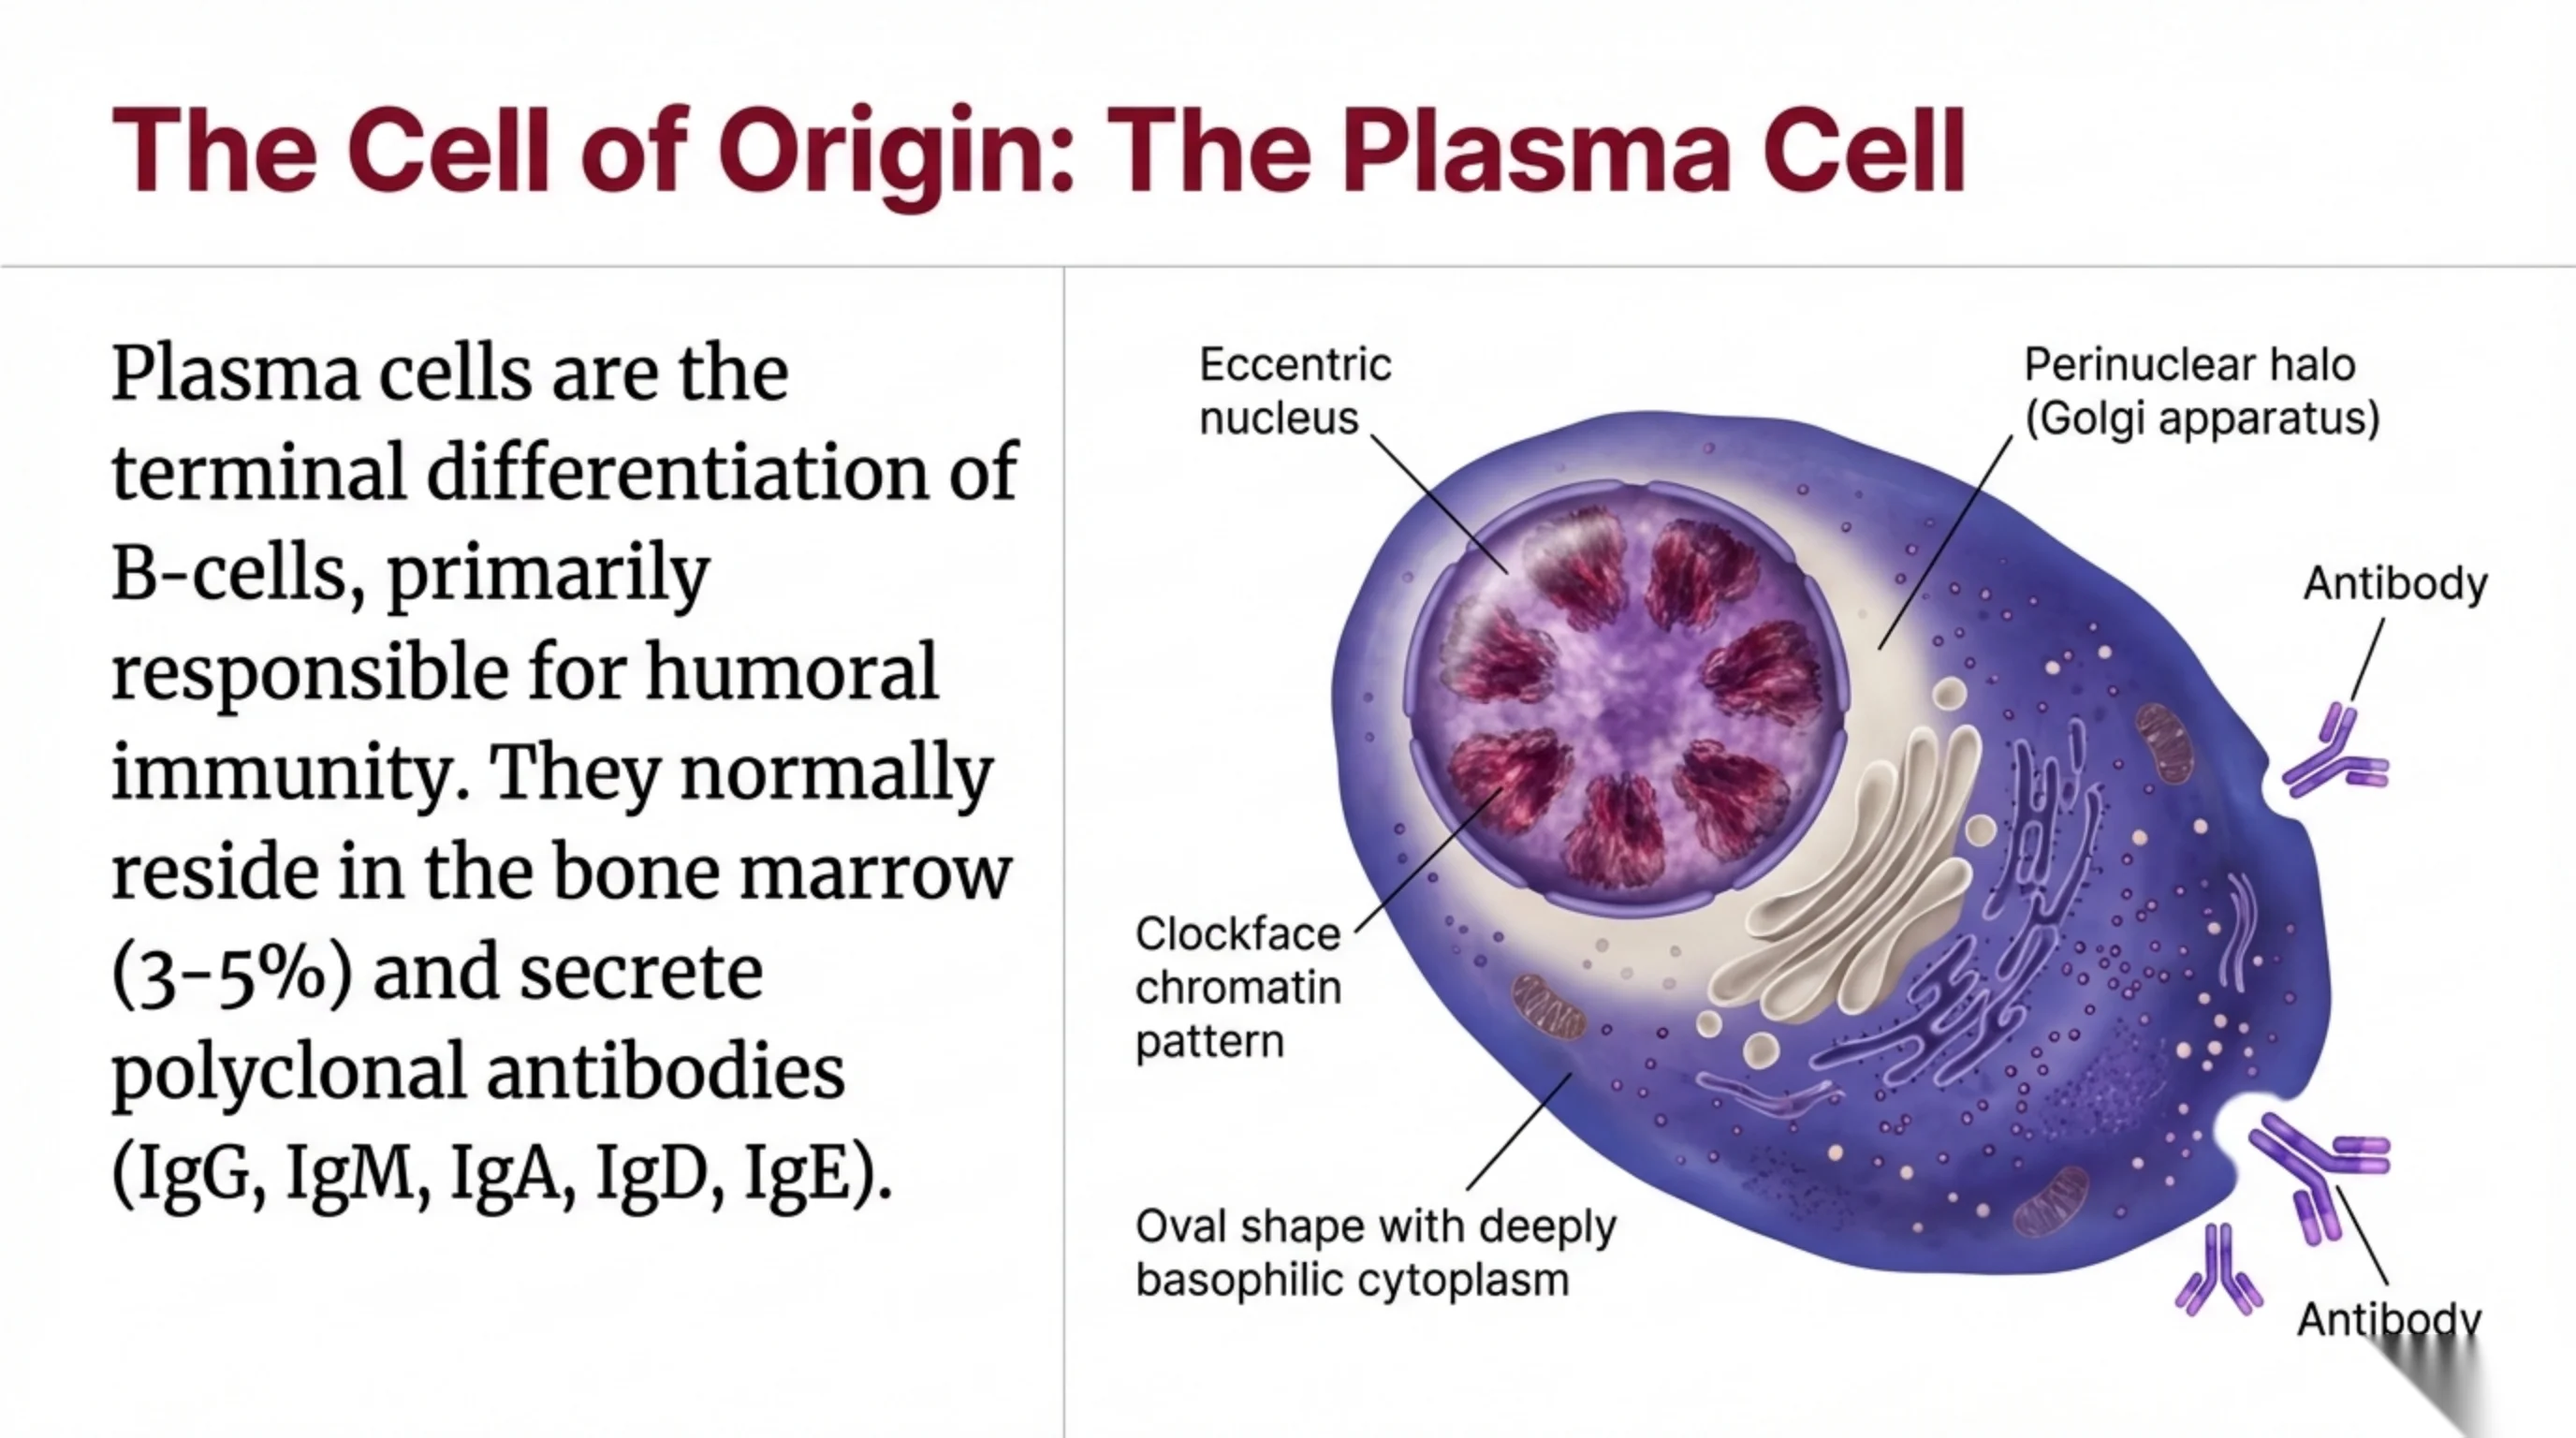
The Cell of Origin: The Plasma Cell
Plasma cells are the terminal differentiation of B-cells, primarily responsible for humoral immunity. They normally reside in the bone marrow (3–5%) and secrete polyclonal antibodies (IgG, IgM, IgA, IgD, IgE).
Labeled cell features:
- Eccentric nucleus
- Clockface chromatin pattern
- Perinuclear halo (Golgi apparatus)
- Oval shape with deeply basophilic cytoplasm
- Antibody (secreted)
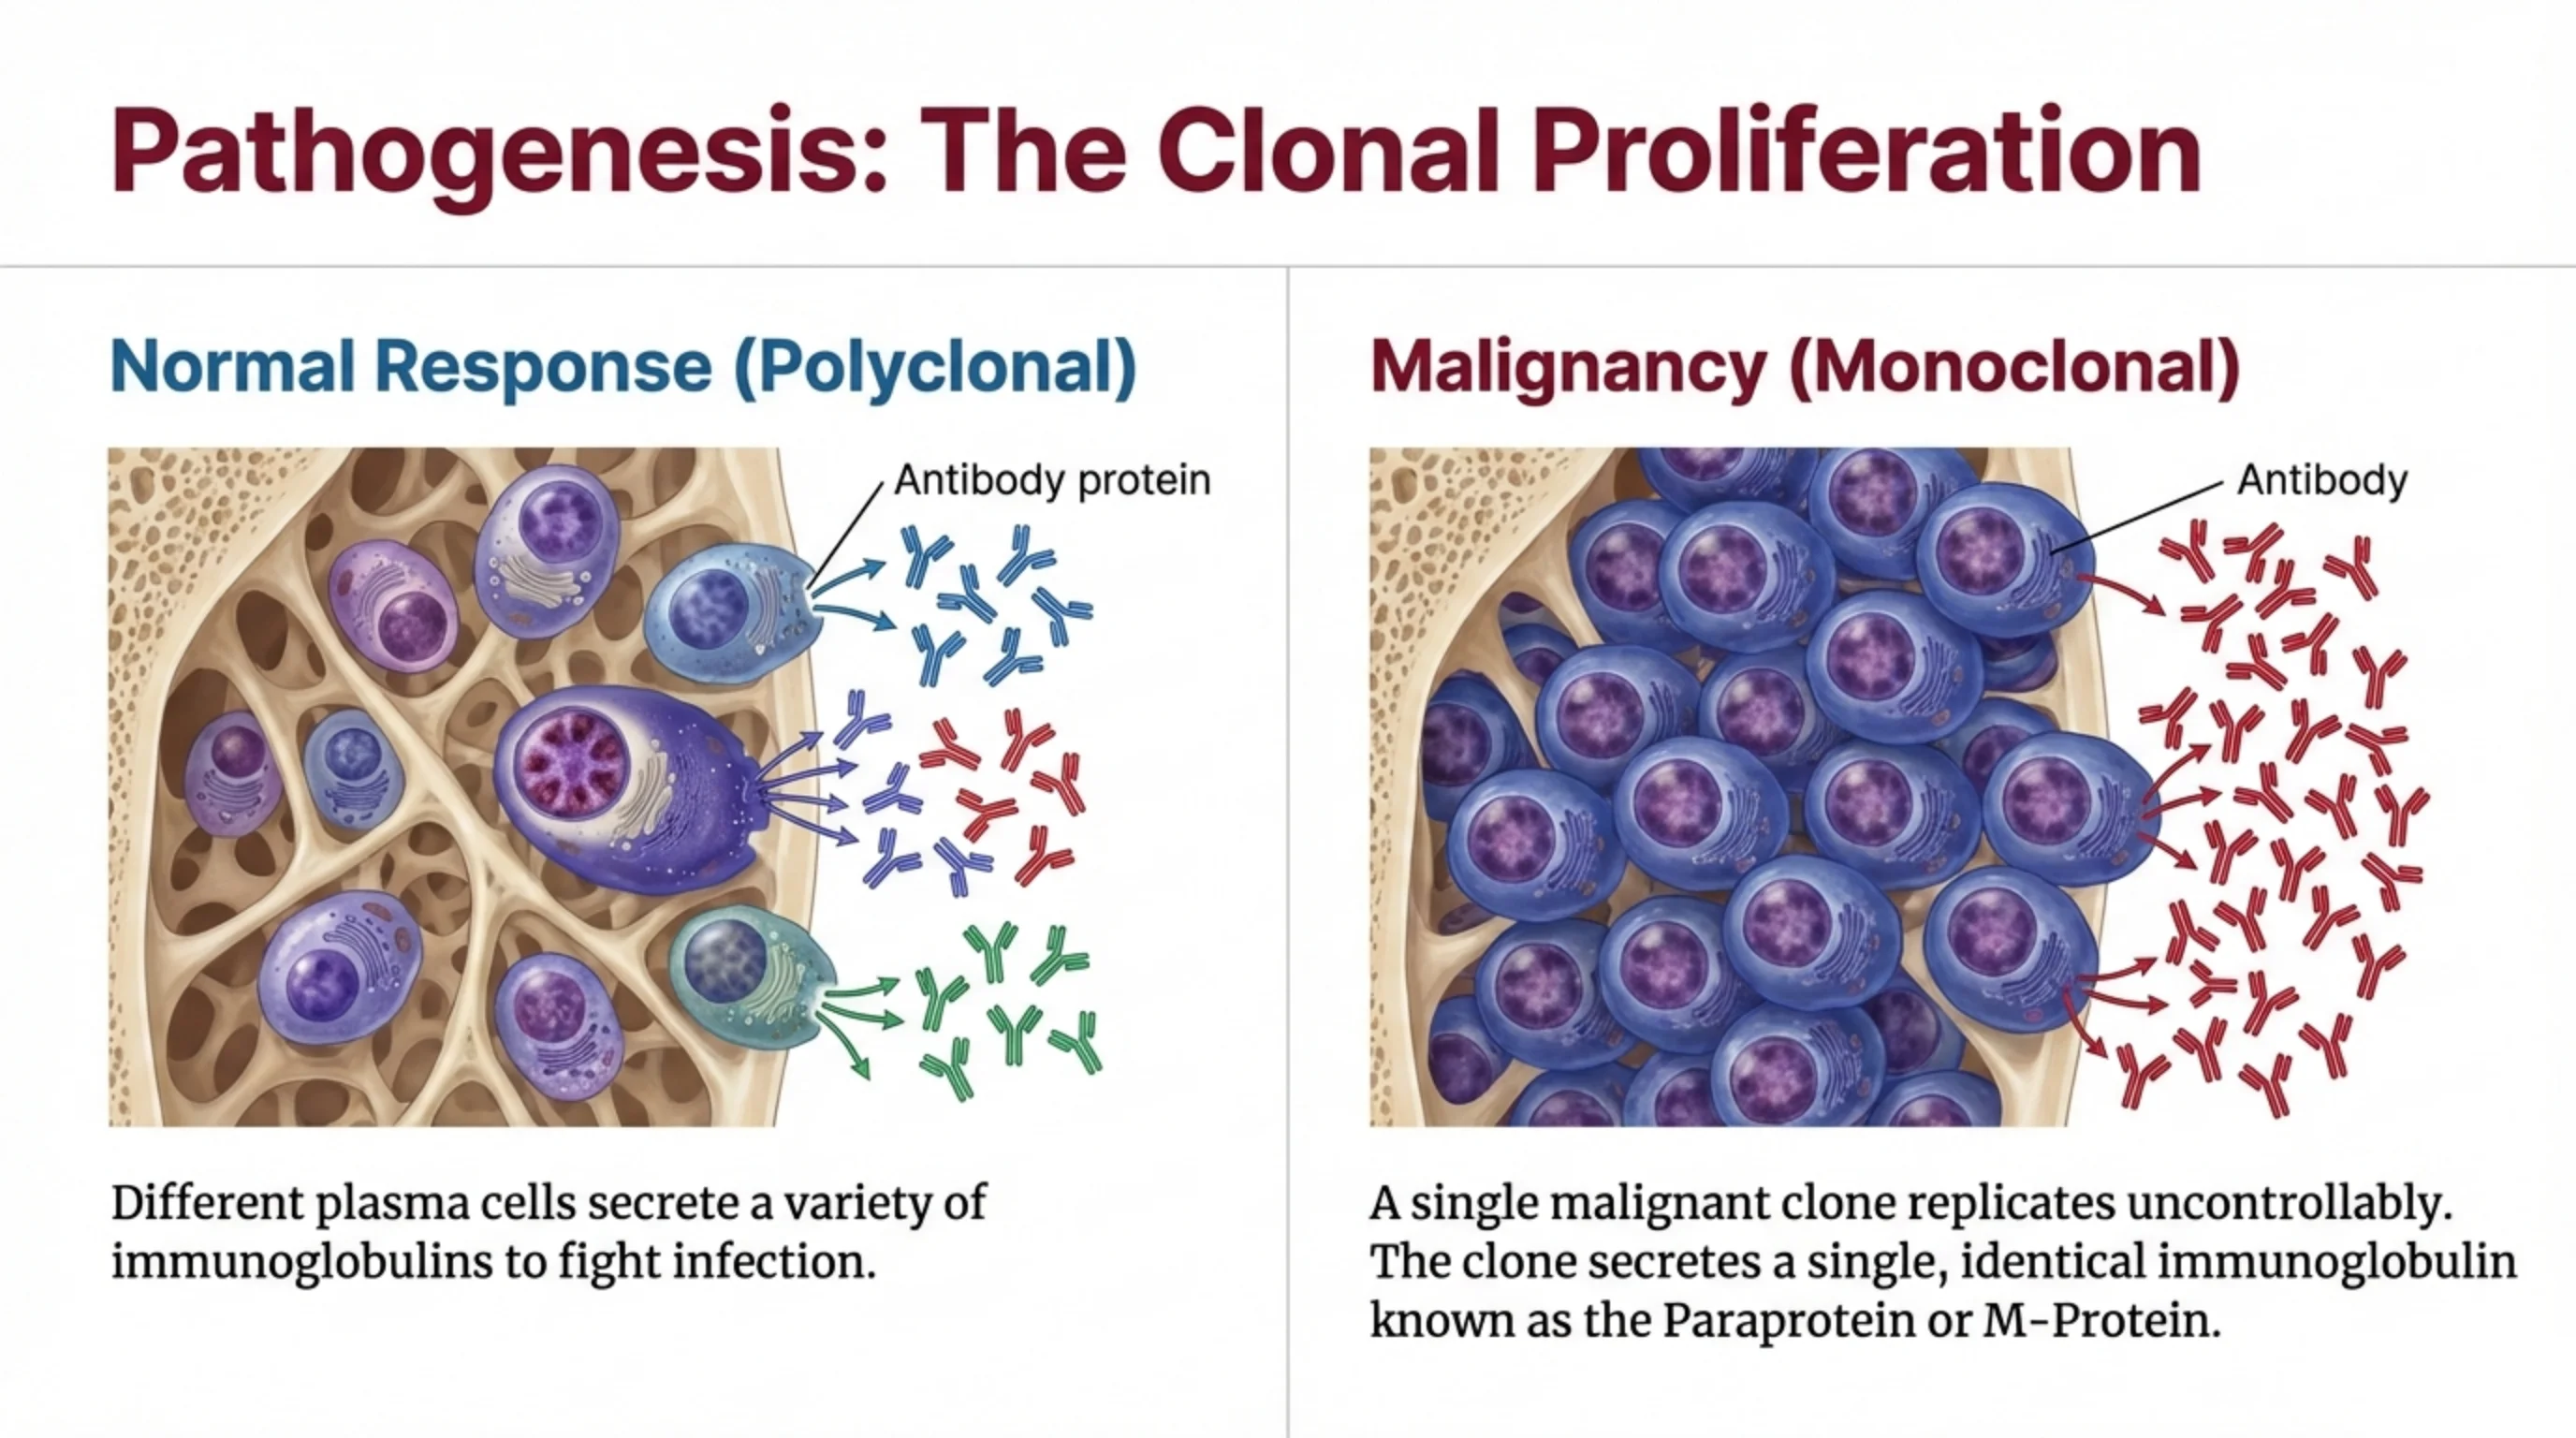
Pathogenesis: The Clonal Proliferation
Normal Response (Polyclonal)
Different plasma cells secrete a variety of immunoglobulins to fight infection.
Malignancy (Monoclonal)
A single malignant clone replicates uncontrollably. The clone secretes a single, identical immunoglobulin known as the Paraprotein or M-Protein.
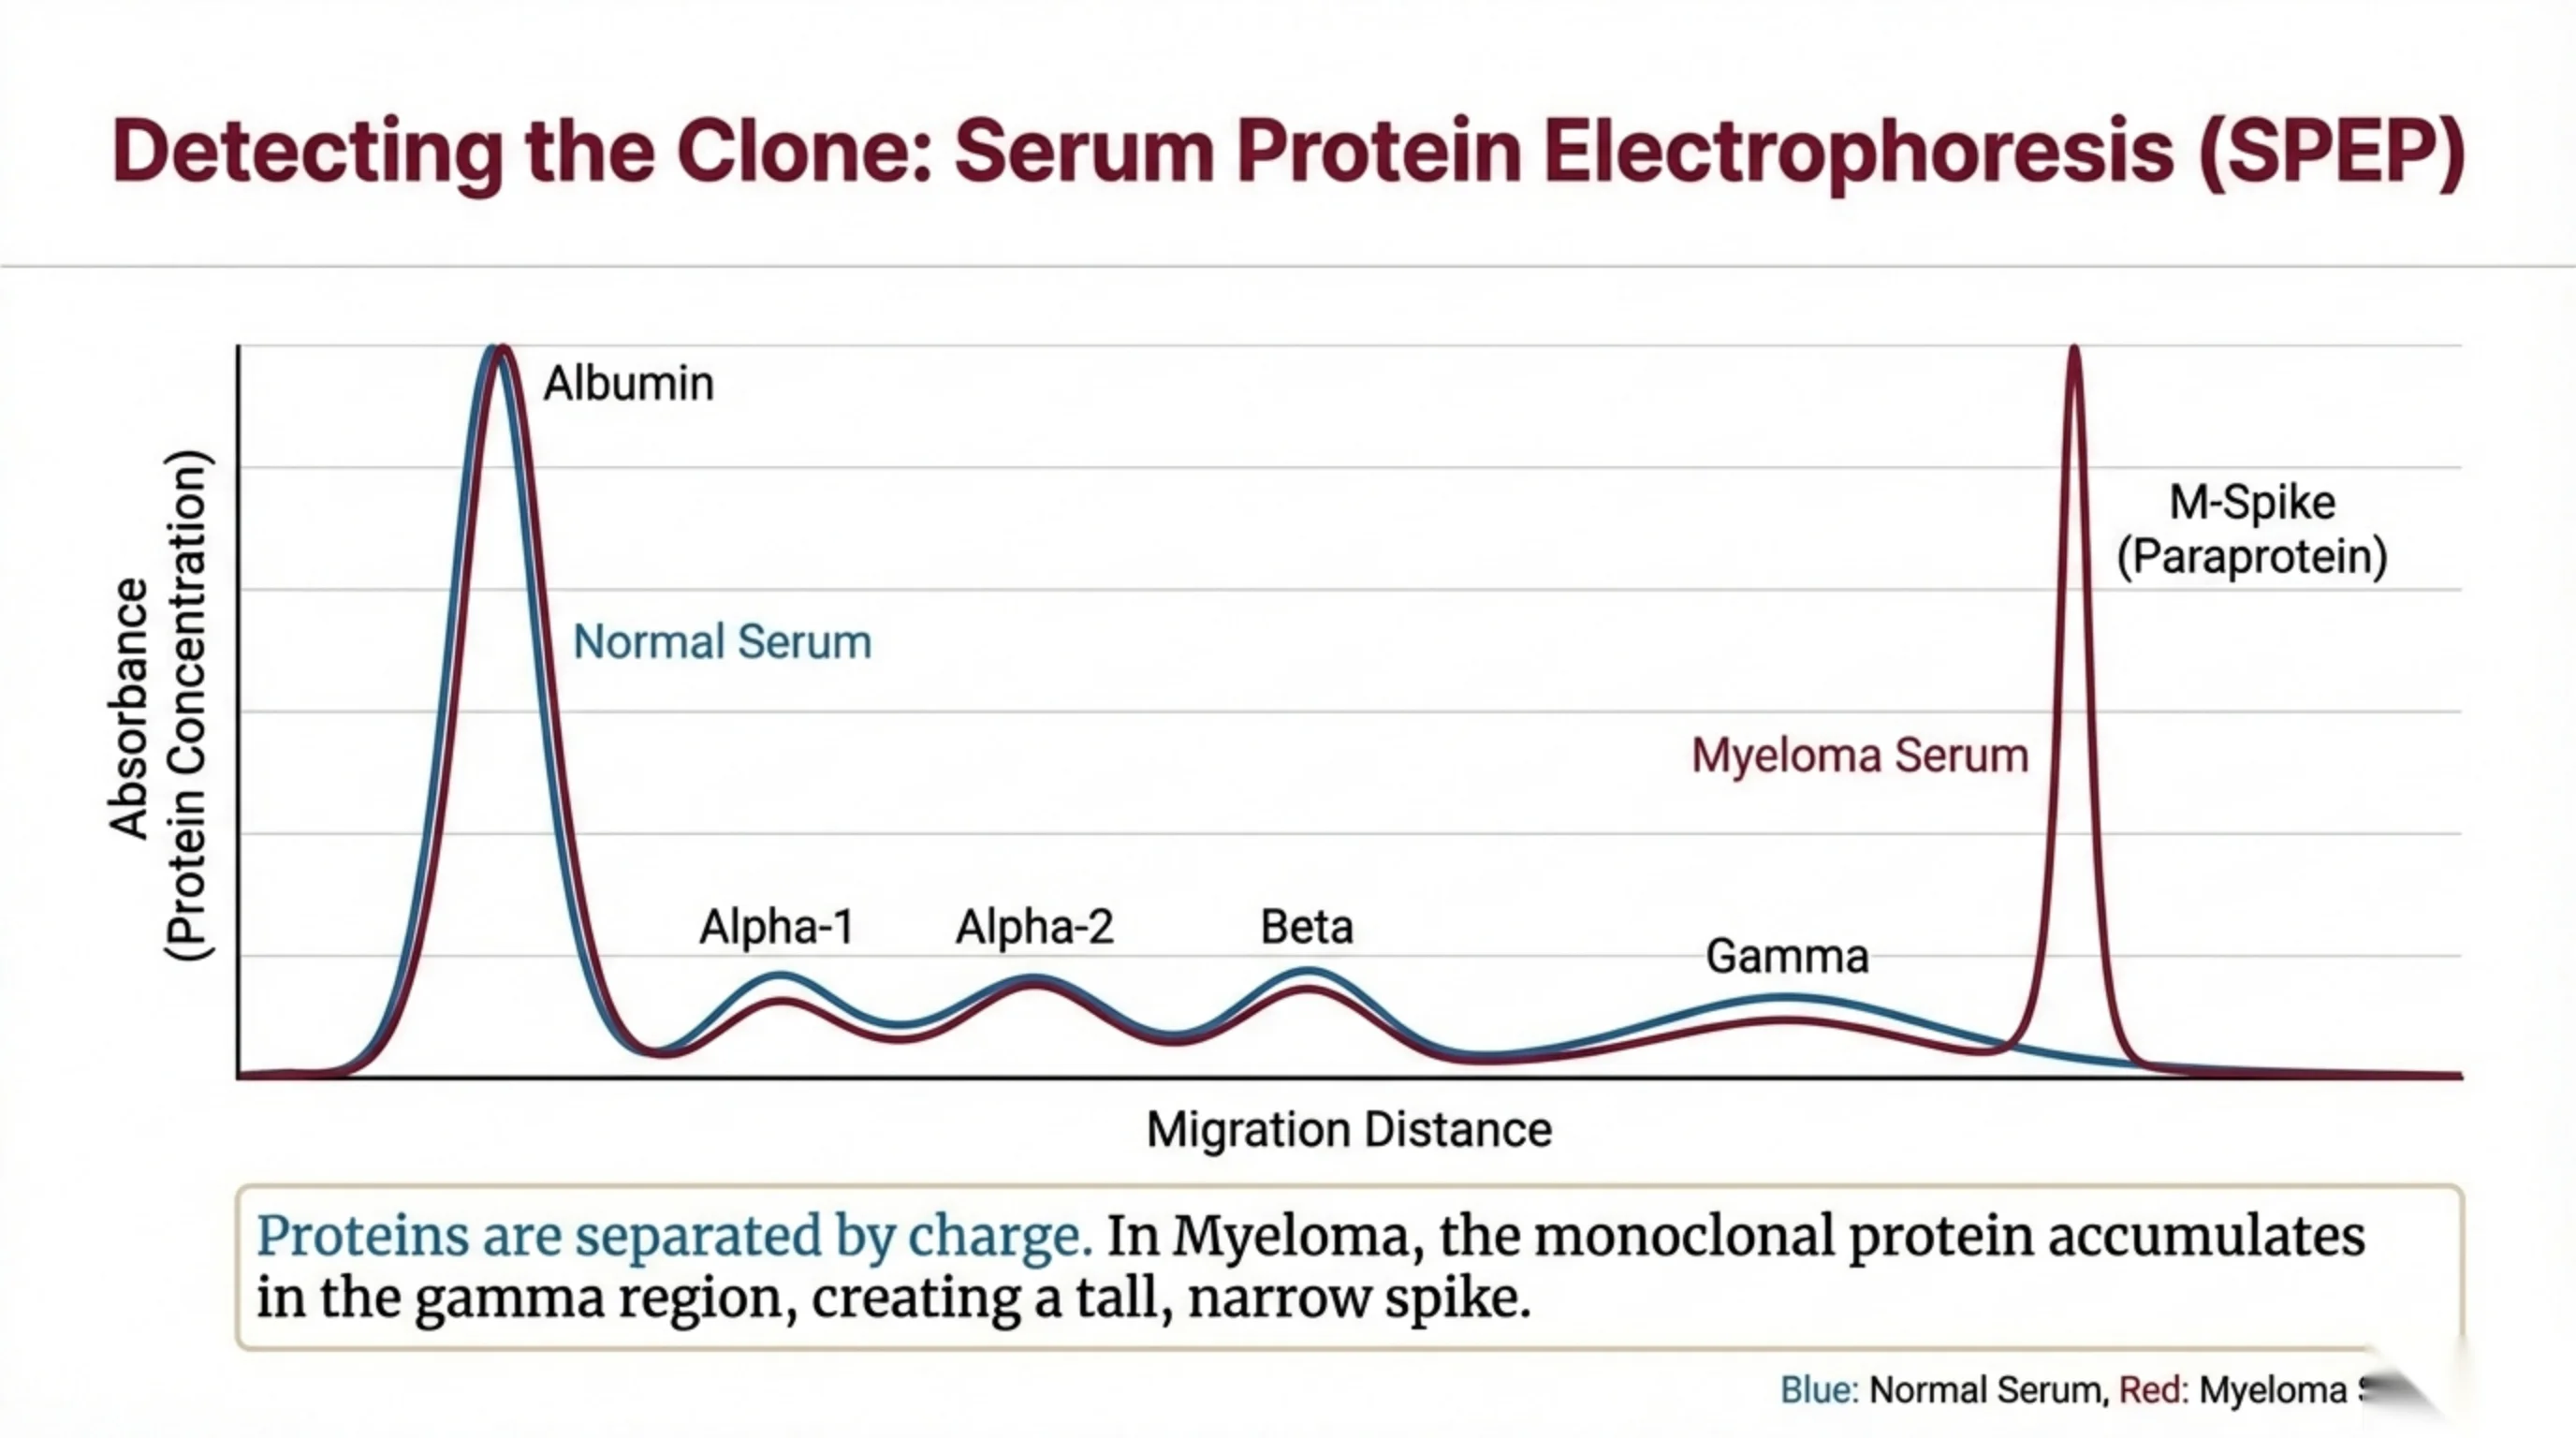
Detecting the Clone: Serum Protein Electrophoresis (SPEP)
Graph axes: Absorbance (Protein Concentration) on the vertical axis versus Migration Distance on the horizontal axis.
Two tracings are overlaid: Normal Serum (blue) and Myeloma Serum (red).
Peaks labeled along the migration axis, from left to right: Albumin, Alpha-1, Alpha-2, Beta, Gamma. The Myeloma Serum shows a tall, narrow M-Spike (Paraprotein) at the far right.
Proteins are separated by charge. In Myeloma, the monoclonal protein accumulates in the gamma region, creating a tall, narrow spike.
Legend: Blue: Normal Serum, Red: Myeloma S… (text cut off at slide edge)
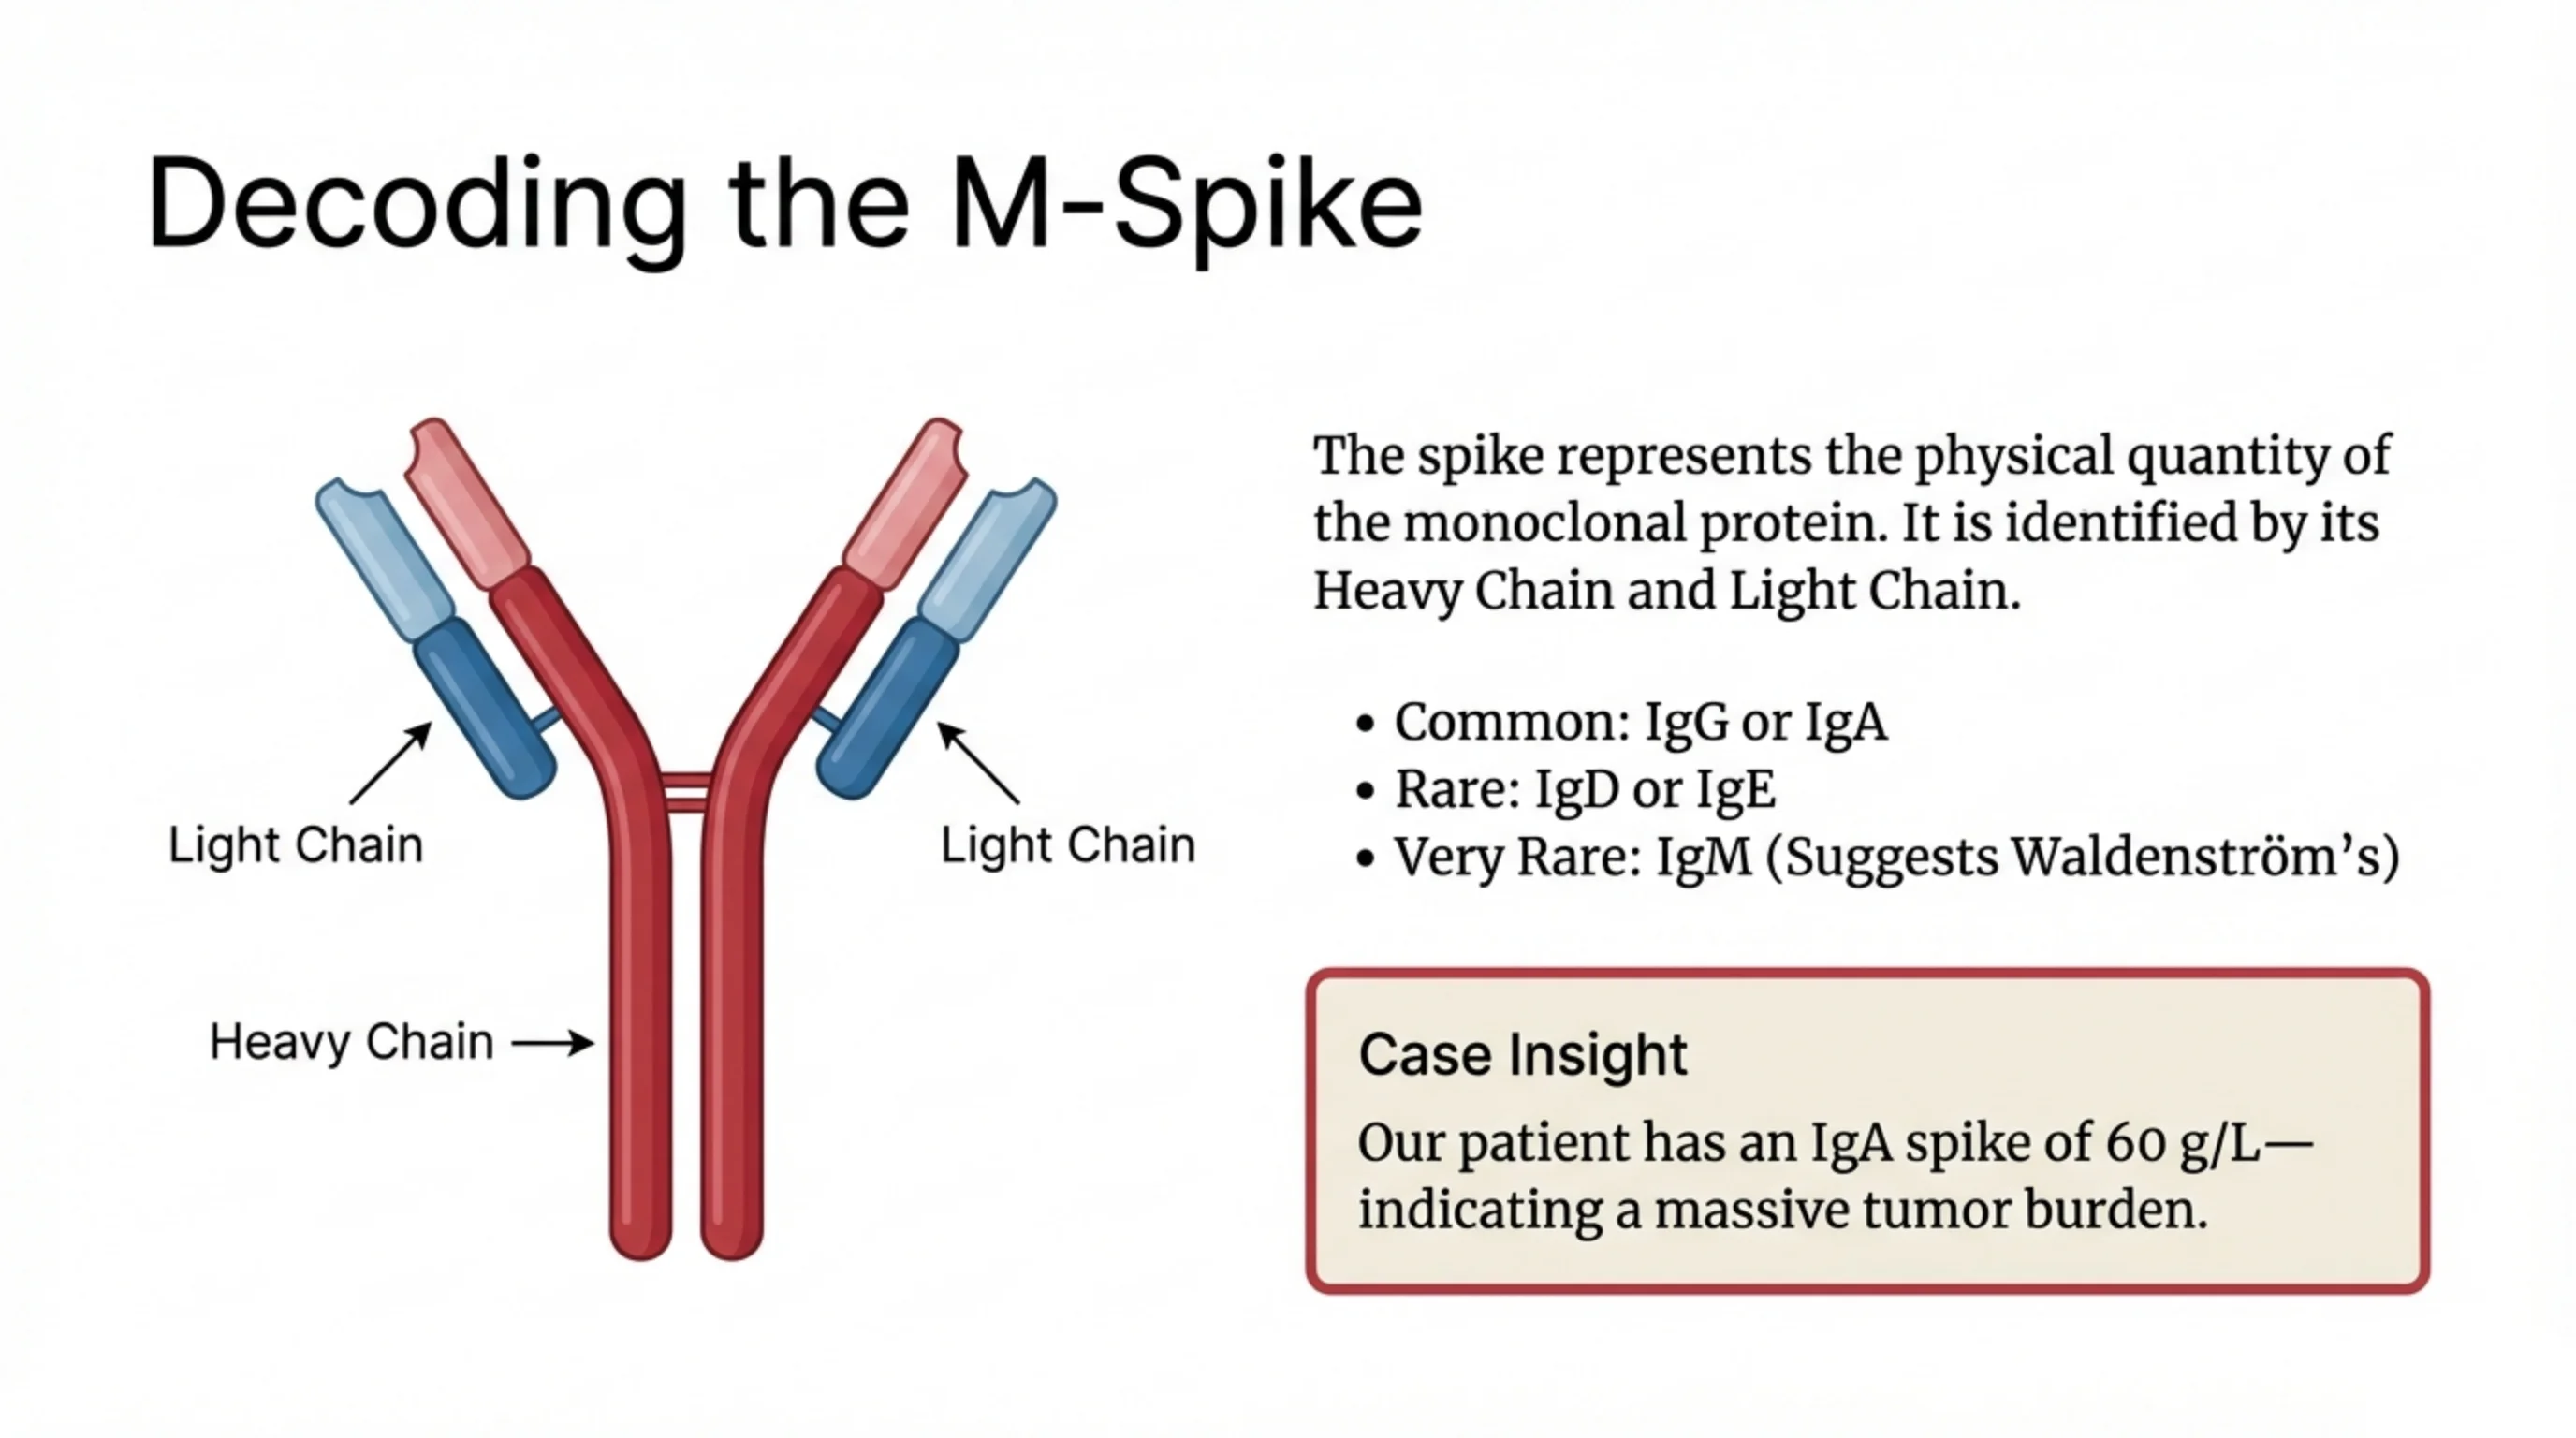
Decoding the M-Spike
The spike represents the physical quantity of the monoclonal protein. It is identified by its Heavy Chain and Light Chain.
- Common: IgG or IgA
- Rare: IgD or IgE
- Very Rare: IgM (Suggests Waldenström's)
Antibody structure labels: Heavy Chain, Light Chain.
Case Insight
Our patient has an IgA spike of 60 g/L—indicating a massive tumor burden.
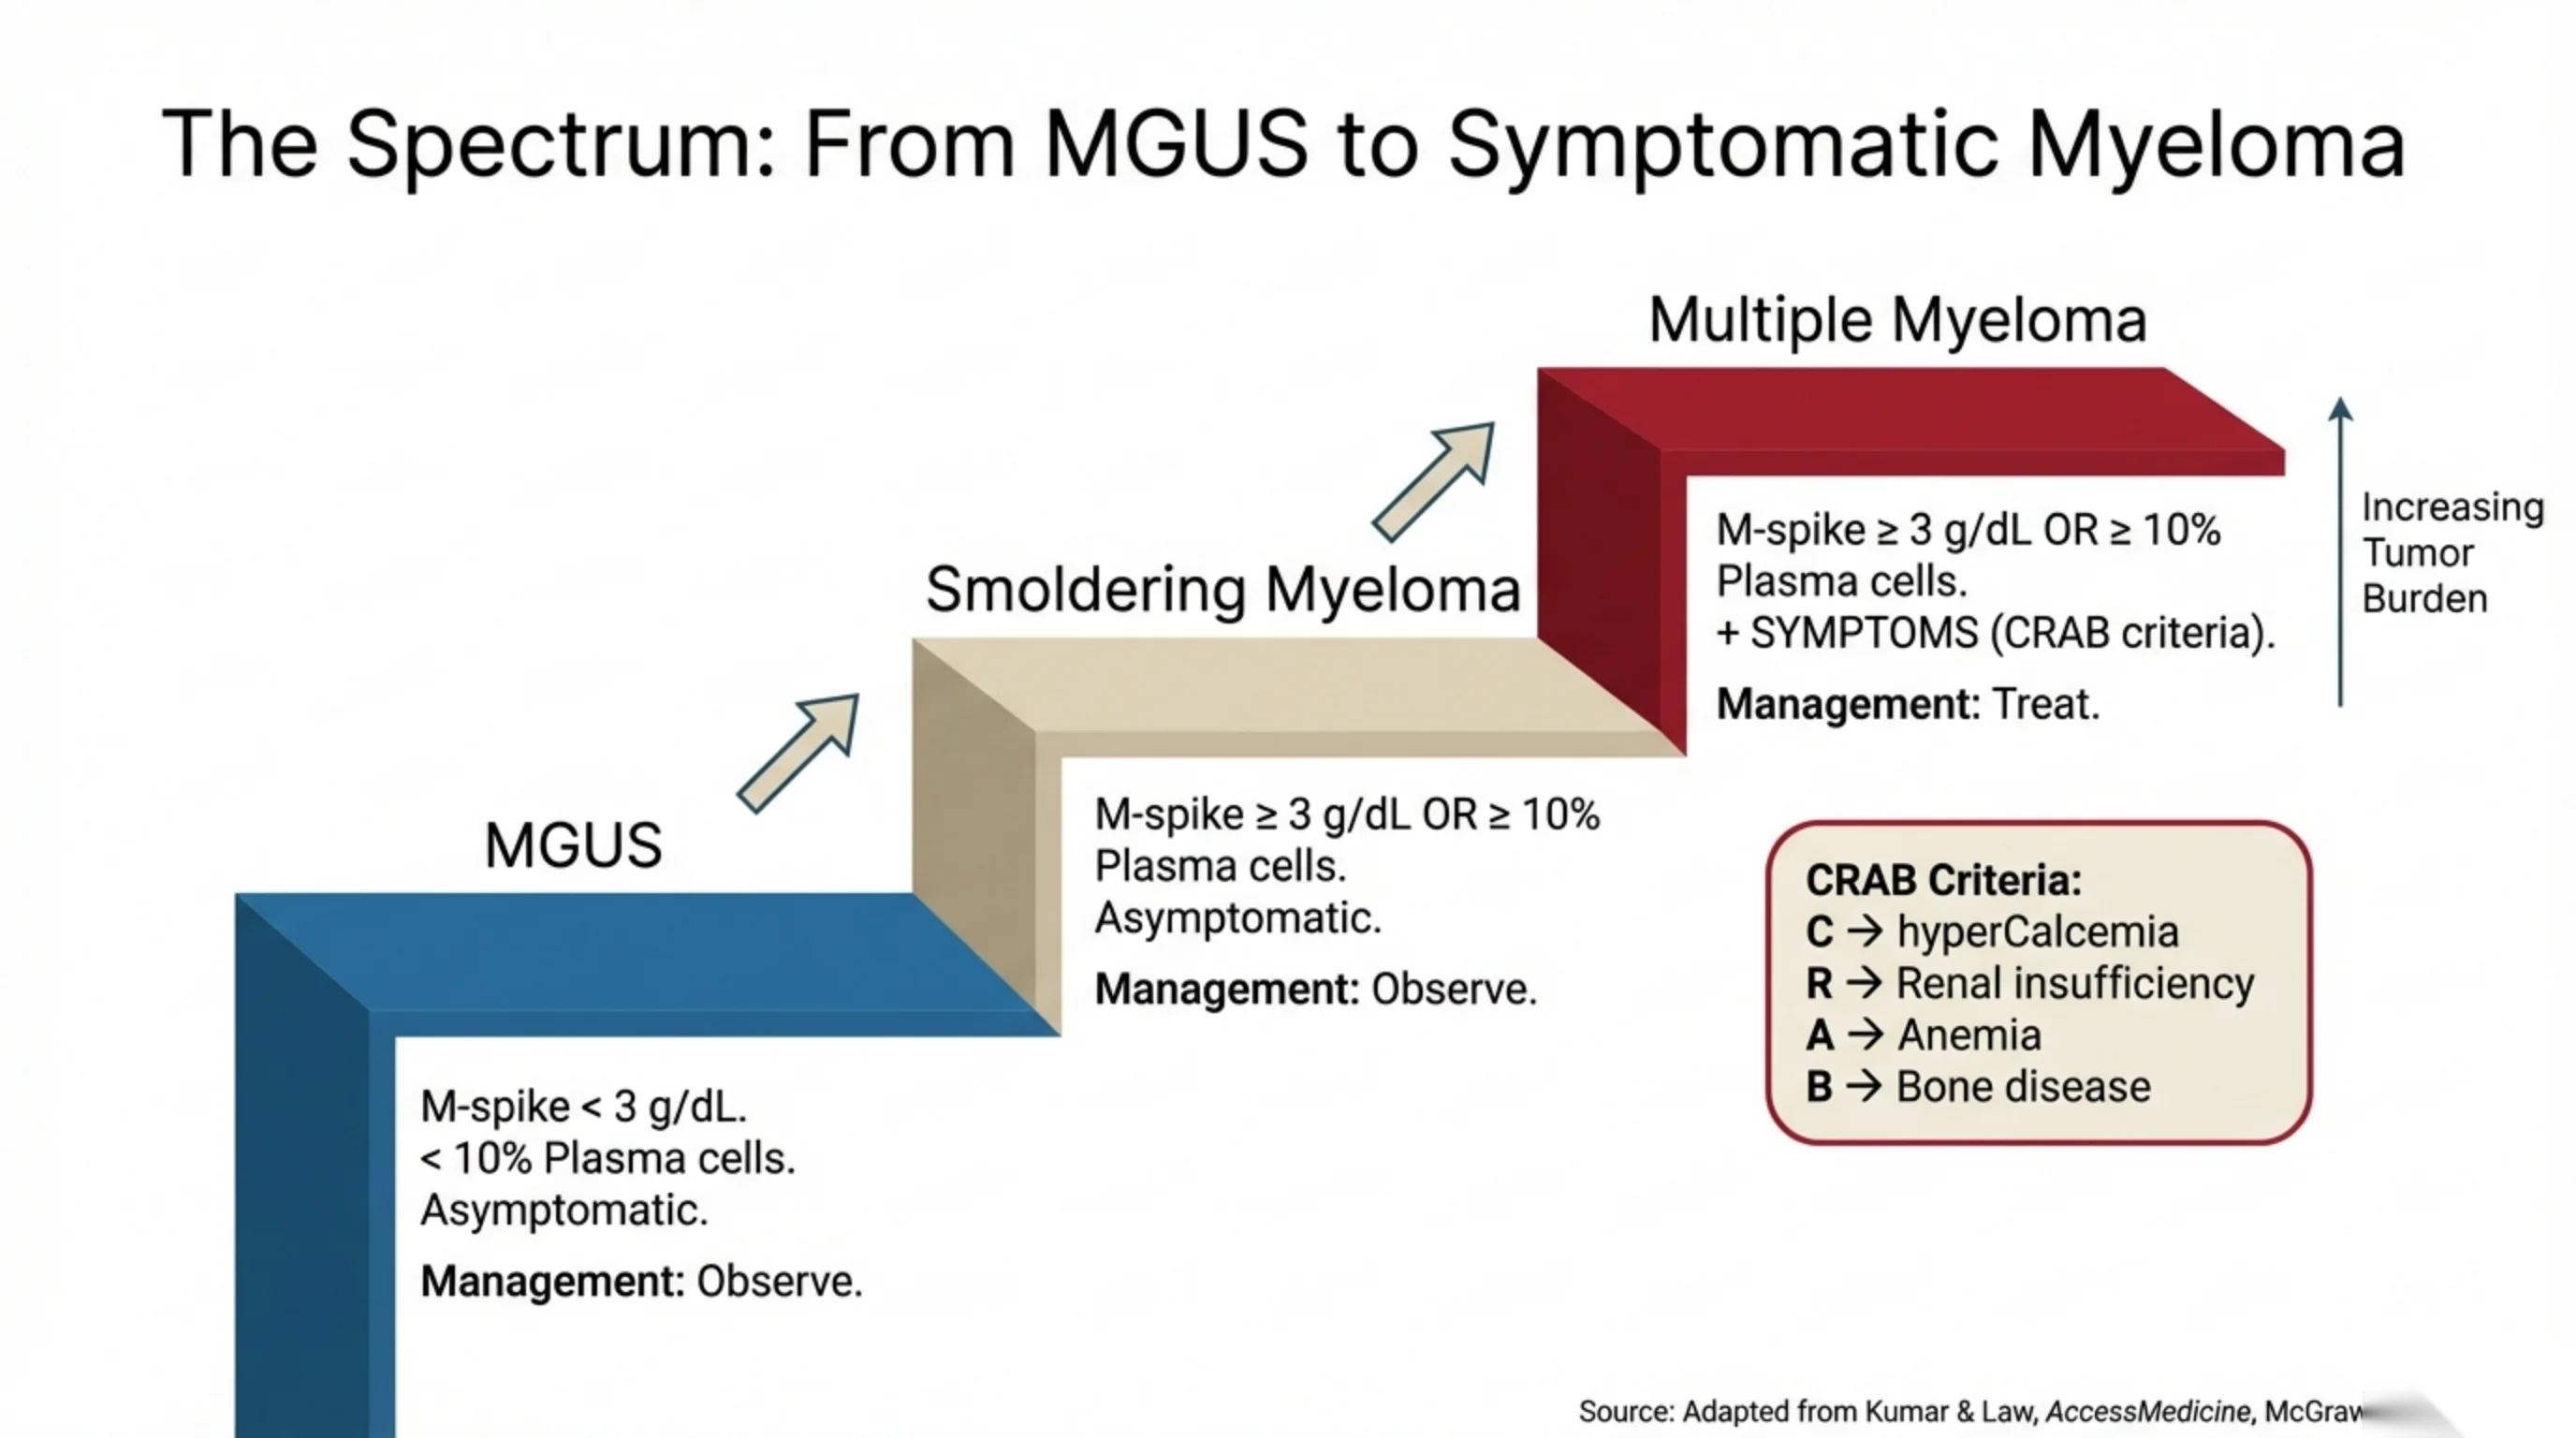
The Spectrum: From MGUS to Symptomatic Myeloma
A three-step progression of increasing tumor burden:
MGUS
- M-spike < 3 g/dL.
- < 10% Plasma cells.
- Asymptomatic.
- Management: Observe.
Smoldering Myeloma
- M-spike ≥ 3 g/dL OR ≥ 10% Plasma cells.
- Asymptomatic.
- Management: Observe.
Multiple Myeloma
- M-spike ≥ 3 g/dL OR ≥ 10% Plasma cells.
- + SYMPTOMS (CRAB criteria).
- Management: Treat.
CRAB Criteria
- C → hyperCalcemia
- R → Renal insufficiency
- A → Anemia
- B → Bone disease
Source: Adapted from Kumar & Law, AccessMedicine, McGraw… (text cut off at slide edge)
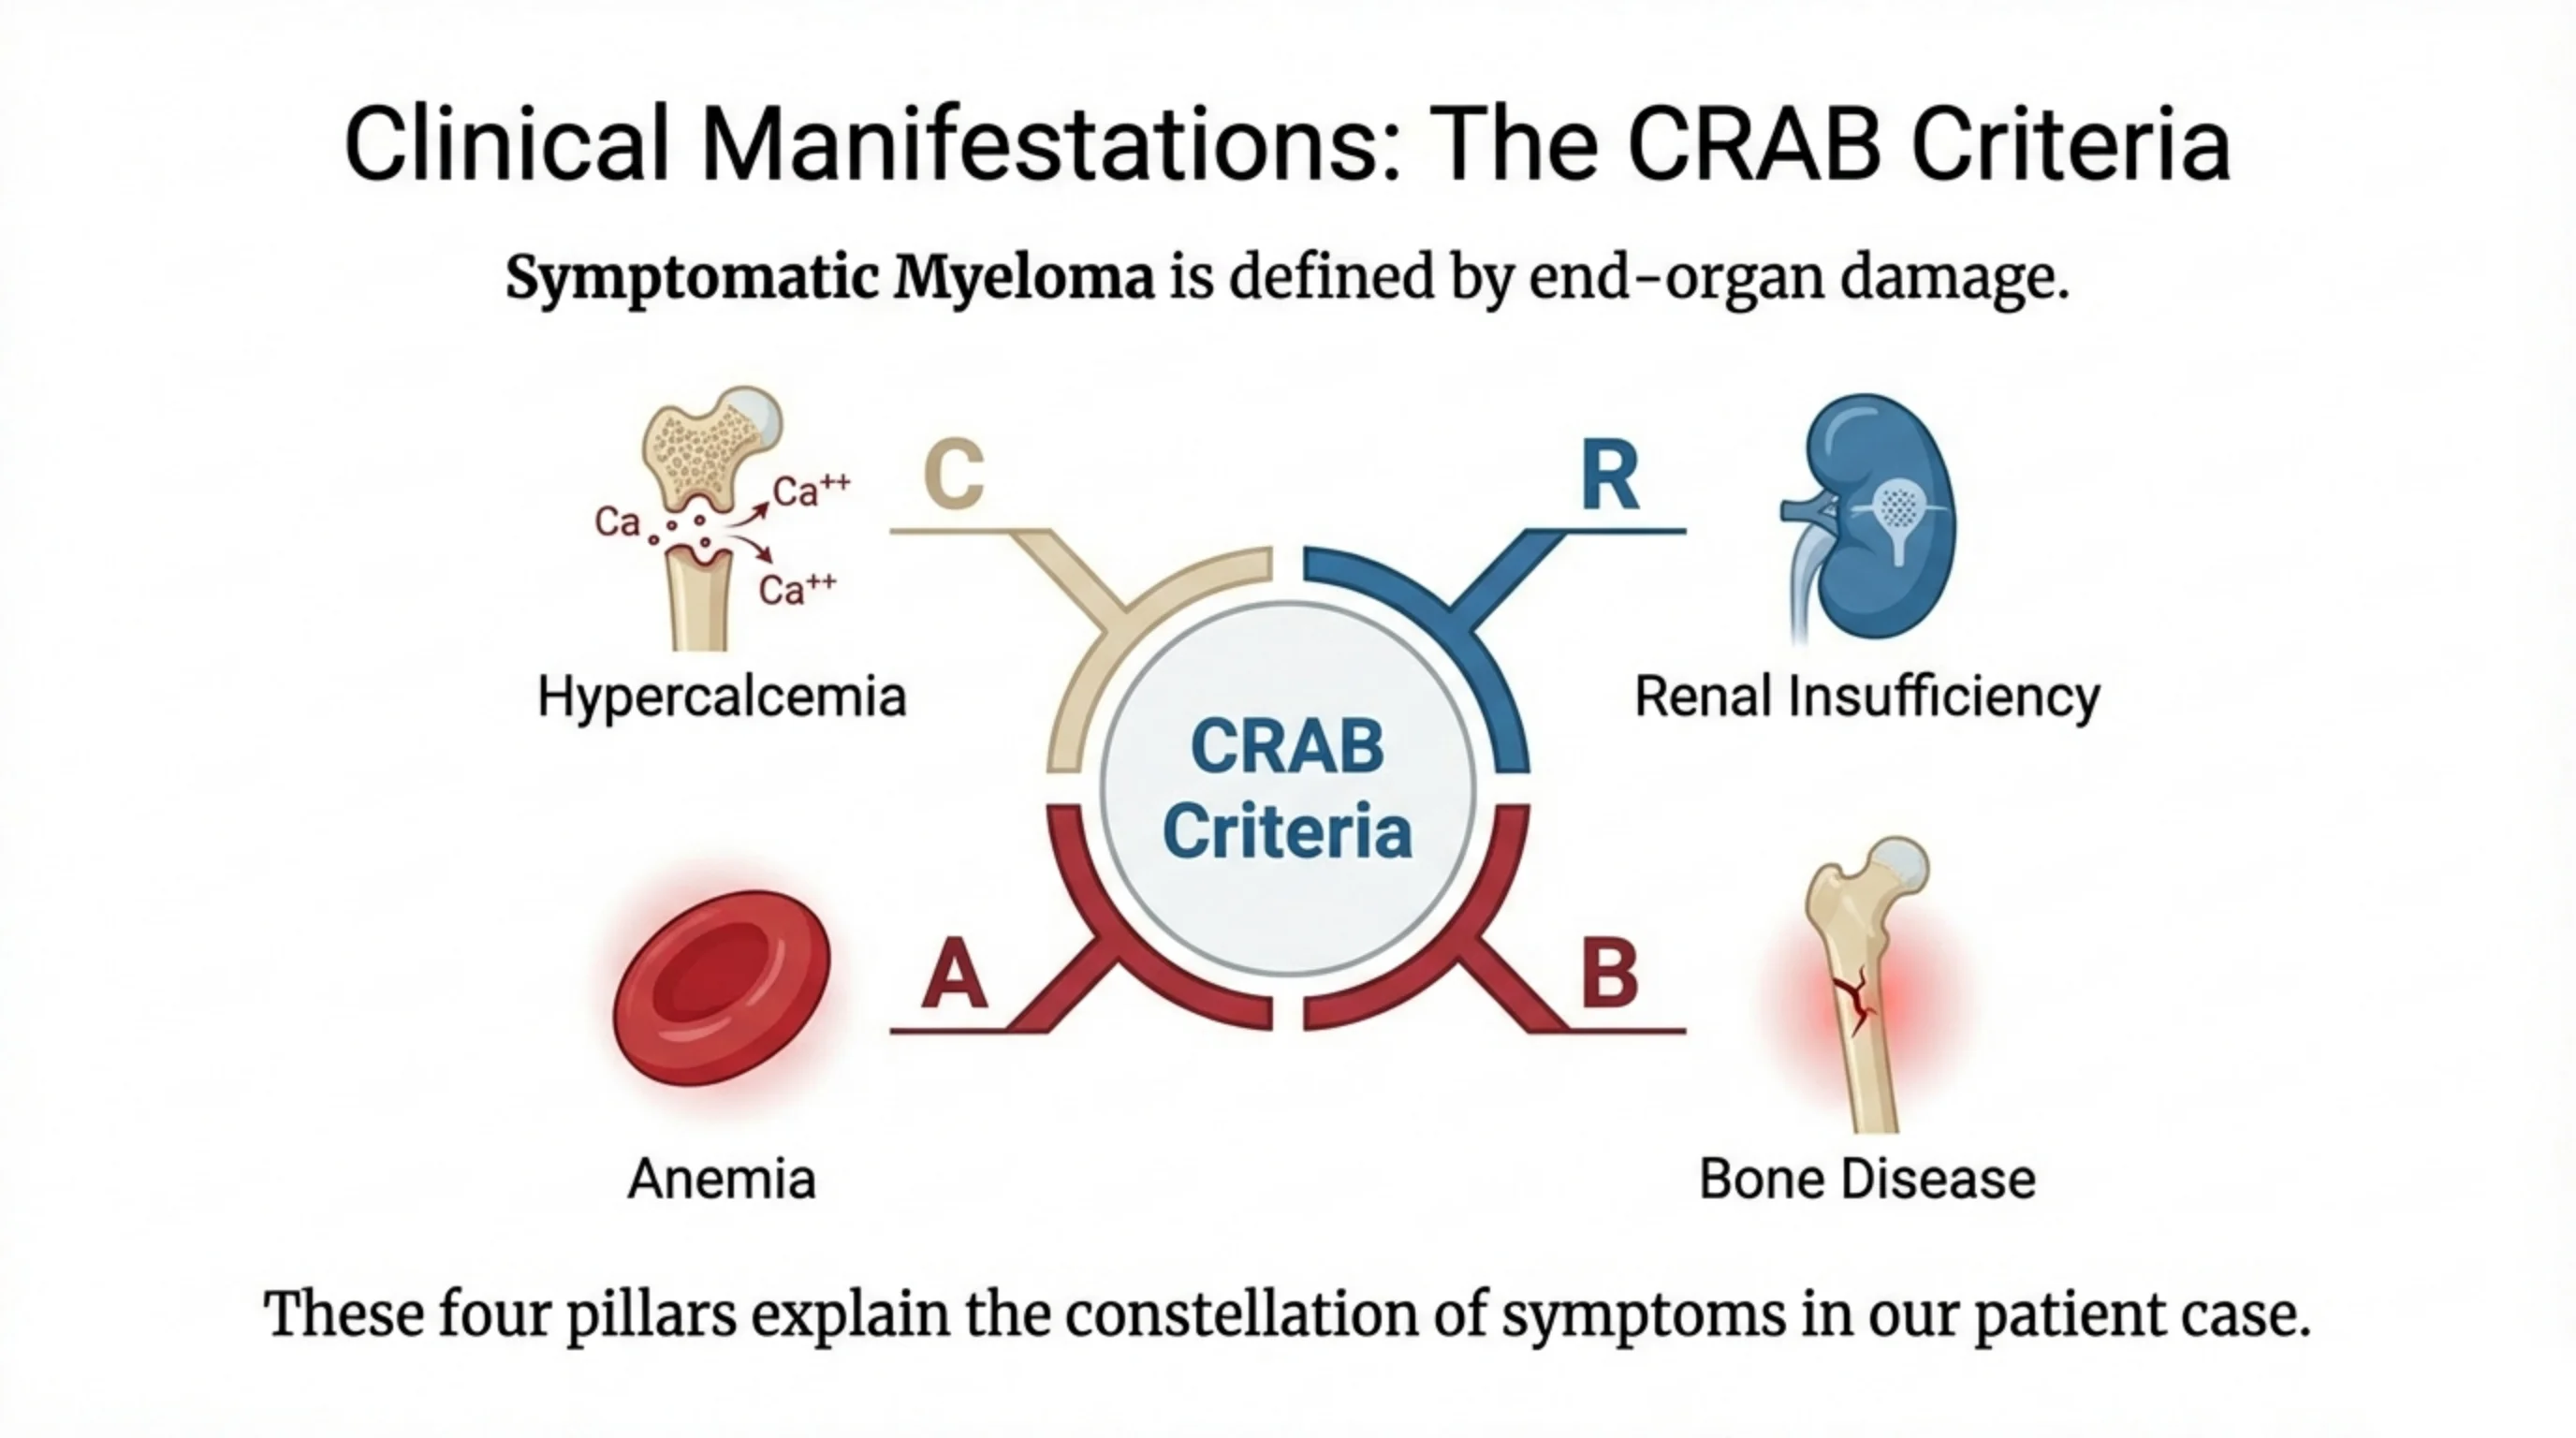
Clinical Manifestations: The CRAB Criteria
Symptomatic Myeloma is defined by end-organ damage.
- C – Hypercalcemia
- R – Renal Insufficiency
- A – Anemia
- B – Bone Disease
These four pillars explain the constellation of symptoms in our patient case.
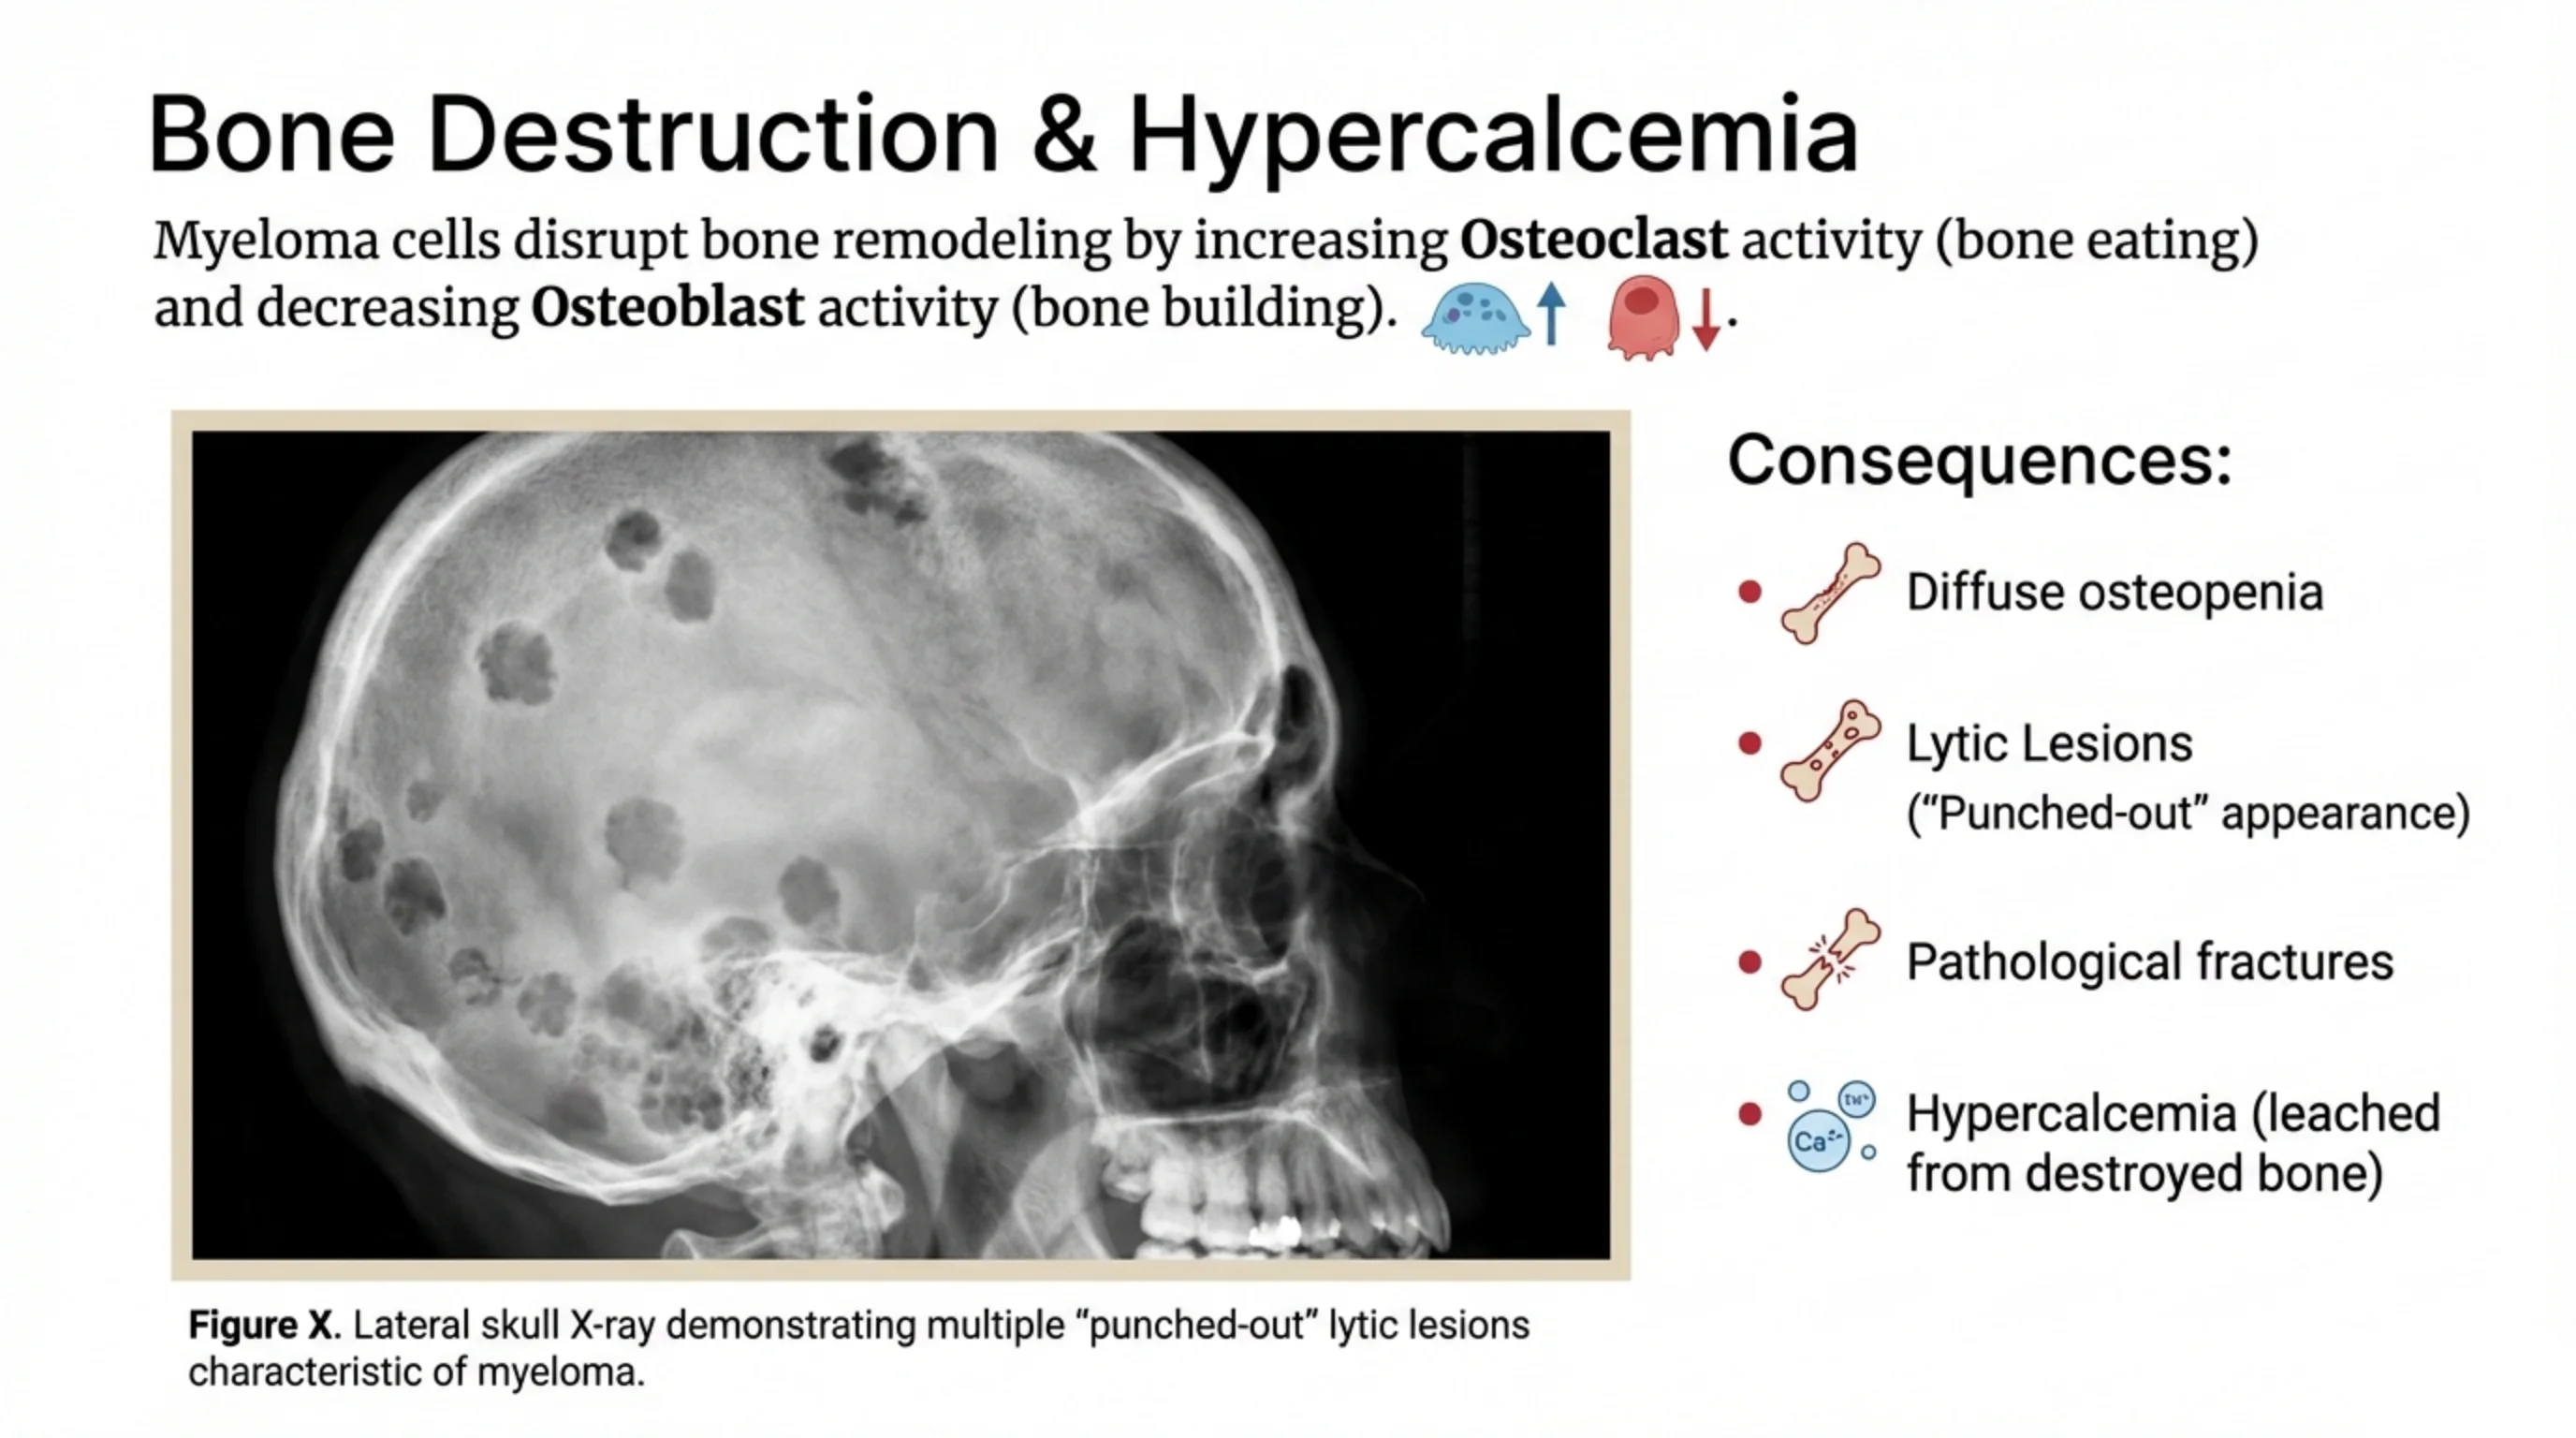
Bone Destruction & Hypercalcemia
Myeloma cells disrupt bone remodeling by increasing Osteoclast activity (bone eating) and decreasing Osteoblast activity (bone building).
Consequences:
- Diffuse osteopenia
- Lytic Lesions ("Punched-out" appearance)
- Pathological fractures
- Hypercalcemia (leached from destroyed bone)
Figure X. Lateral skull X-ray demonstrating multiple "punched-out" lytic lesions characteristic of myeloma.
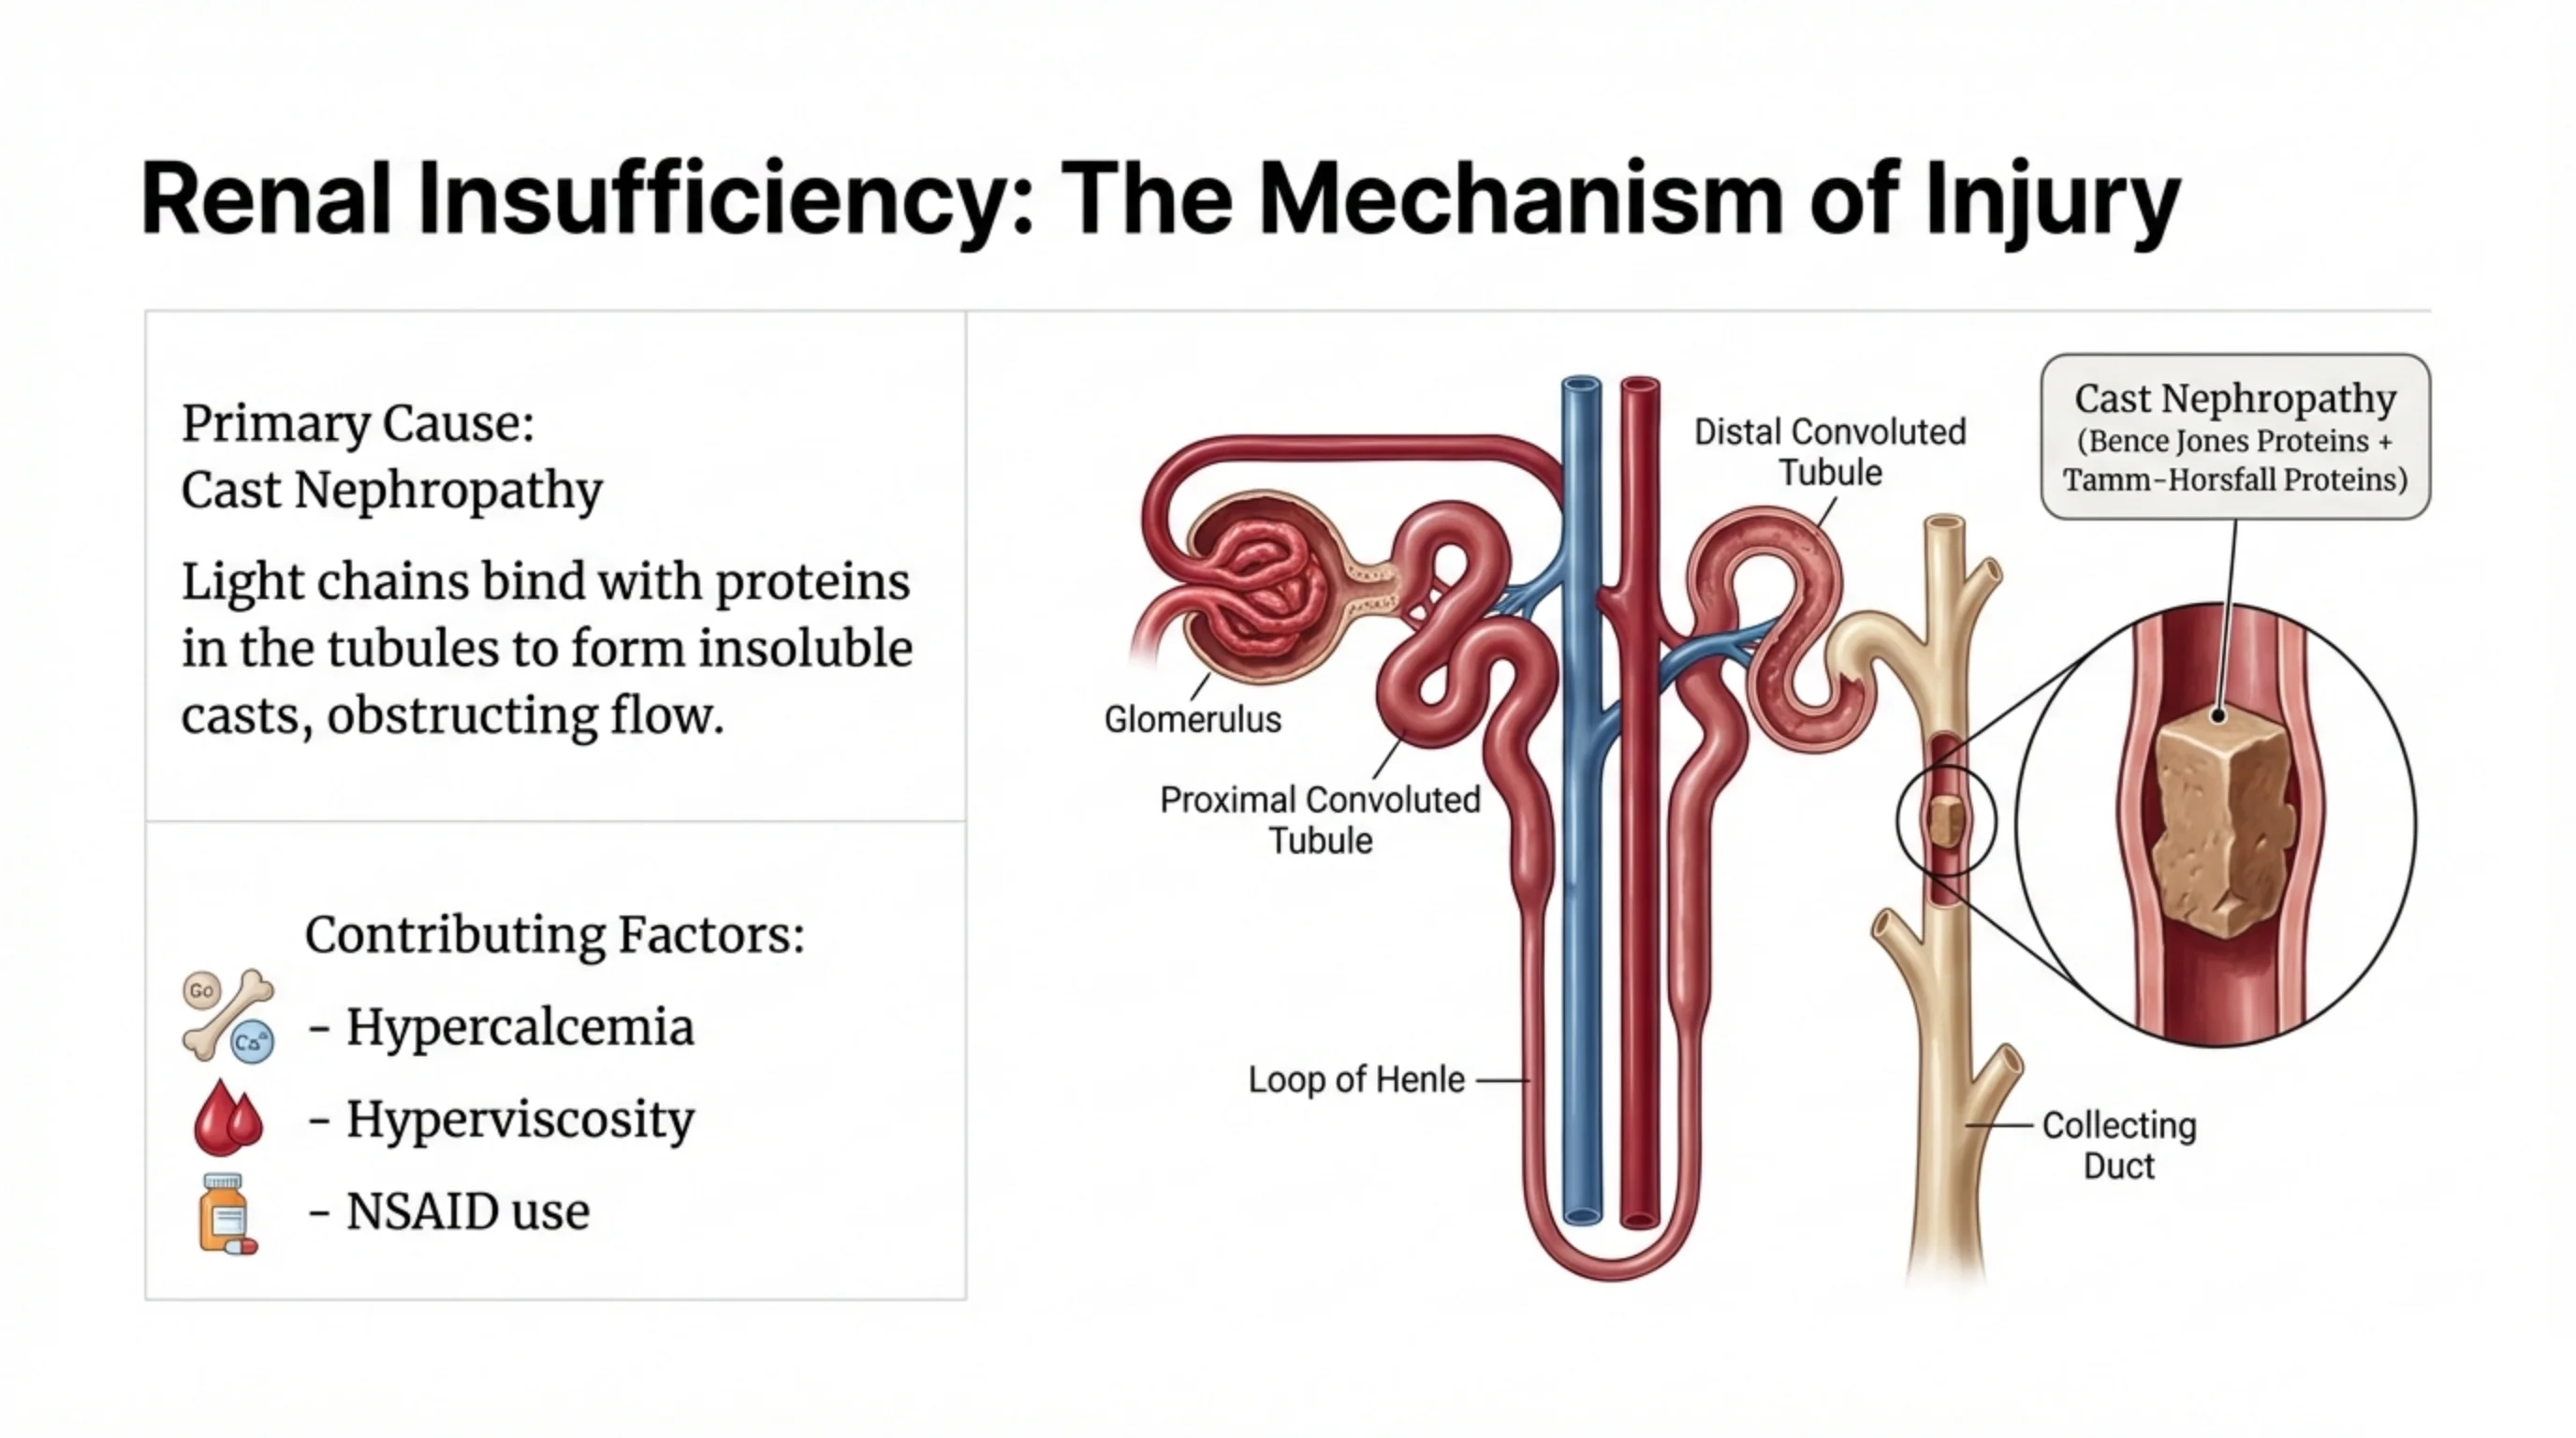
Renal Insufficiency: The Mechanism of Injury
Primary Cause: Cast Nephropathy
Light chains bind with proteins in the tubules to form insoluble casts, obstructing flow.
Contributing Factors:
- Hypercalcemia
- Hyperviscosity
- NSAID use
Nephron diagram labels: Glomerulus, Proximal Convoluted Tubule, Distal Convoluted Tubule, Loop of Henle, Collecting Duct.
Inset label: Cast Nephropathy (Bence Jones Proteins + Tamm–Horsfall Proteins).
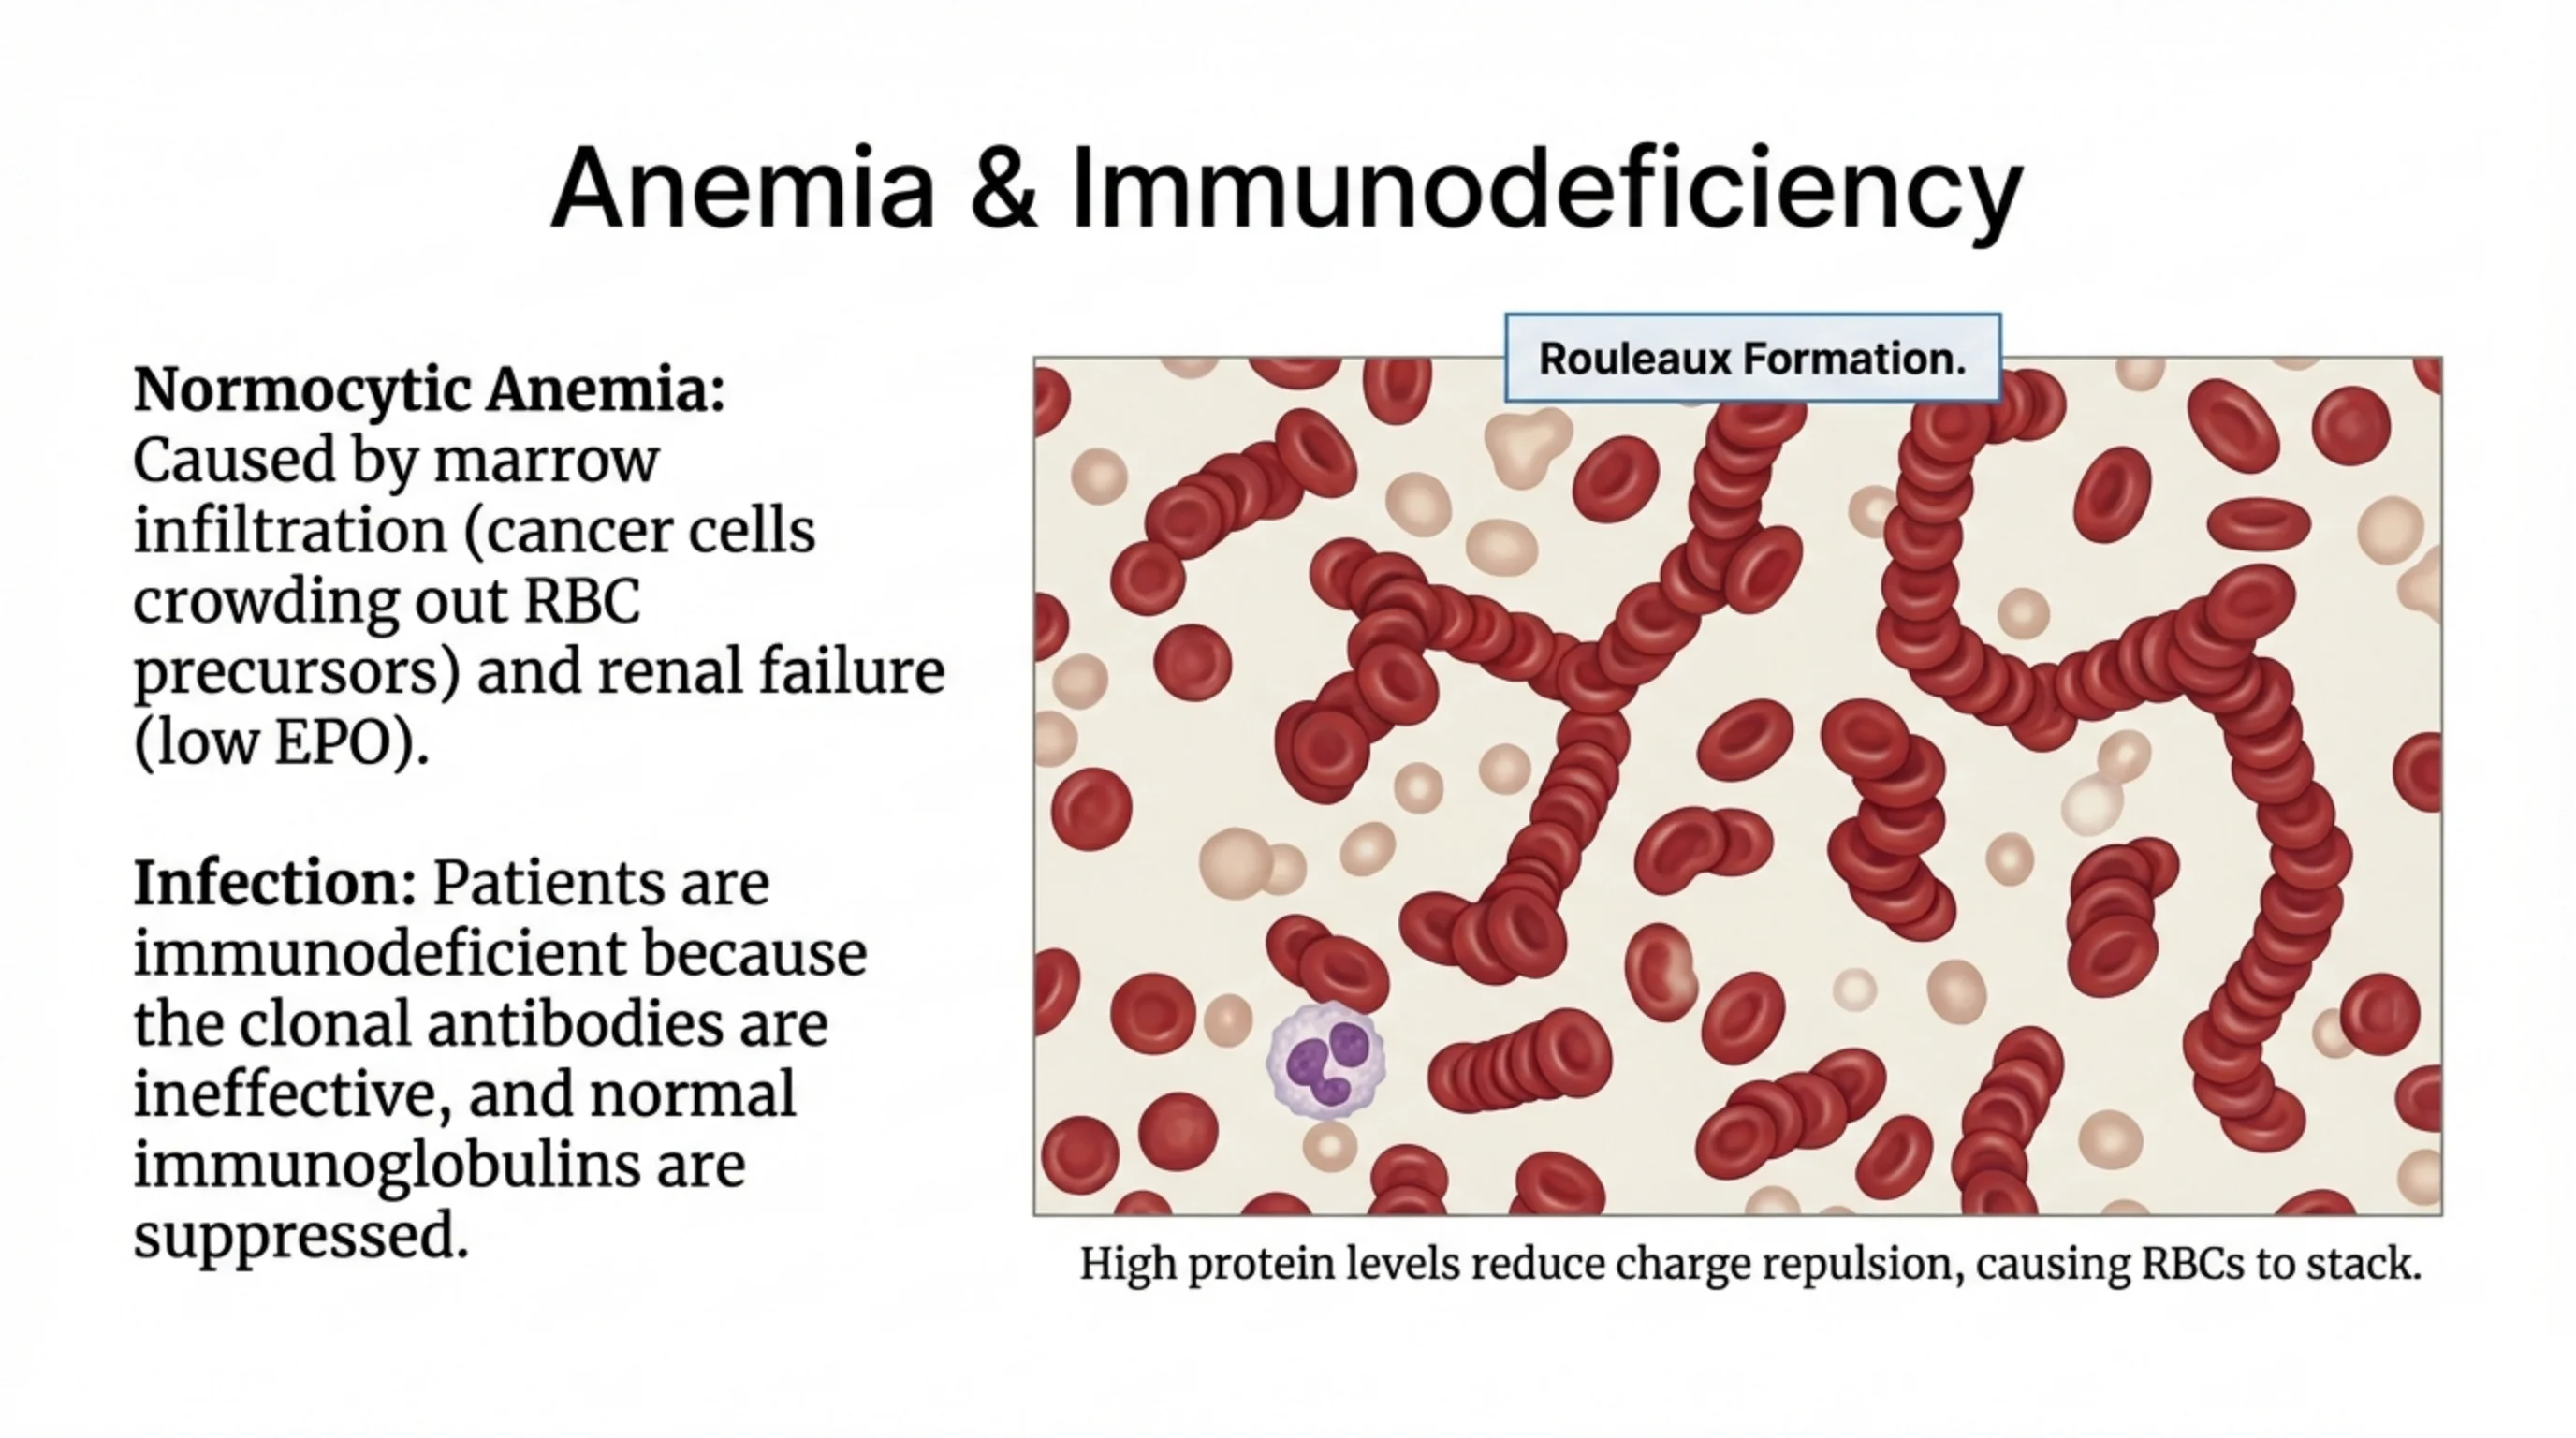
Anemia & Immunodeficiency
Normocytic Anemia: Caused by marrow infiltration (cancer cells crowding out RBC precursors) and renal failure (low EPO).
Infection: Patients are immunodeficient because the clonal antibodies are ineffective, and normal immunoglobulins are suppressed.
Blood smear label: Rouleaux Formation.
High protein levels reduce charge repulsion, causing RBCs to stack.
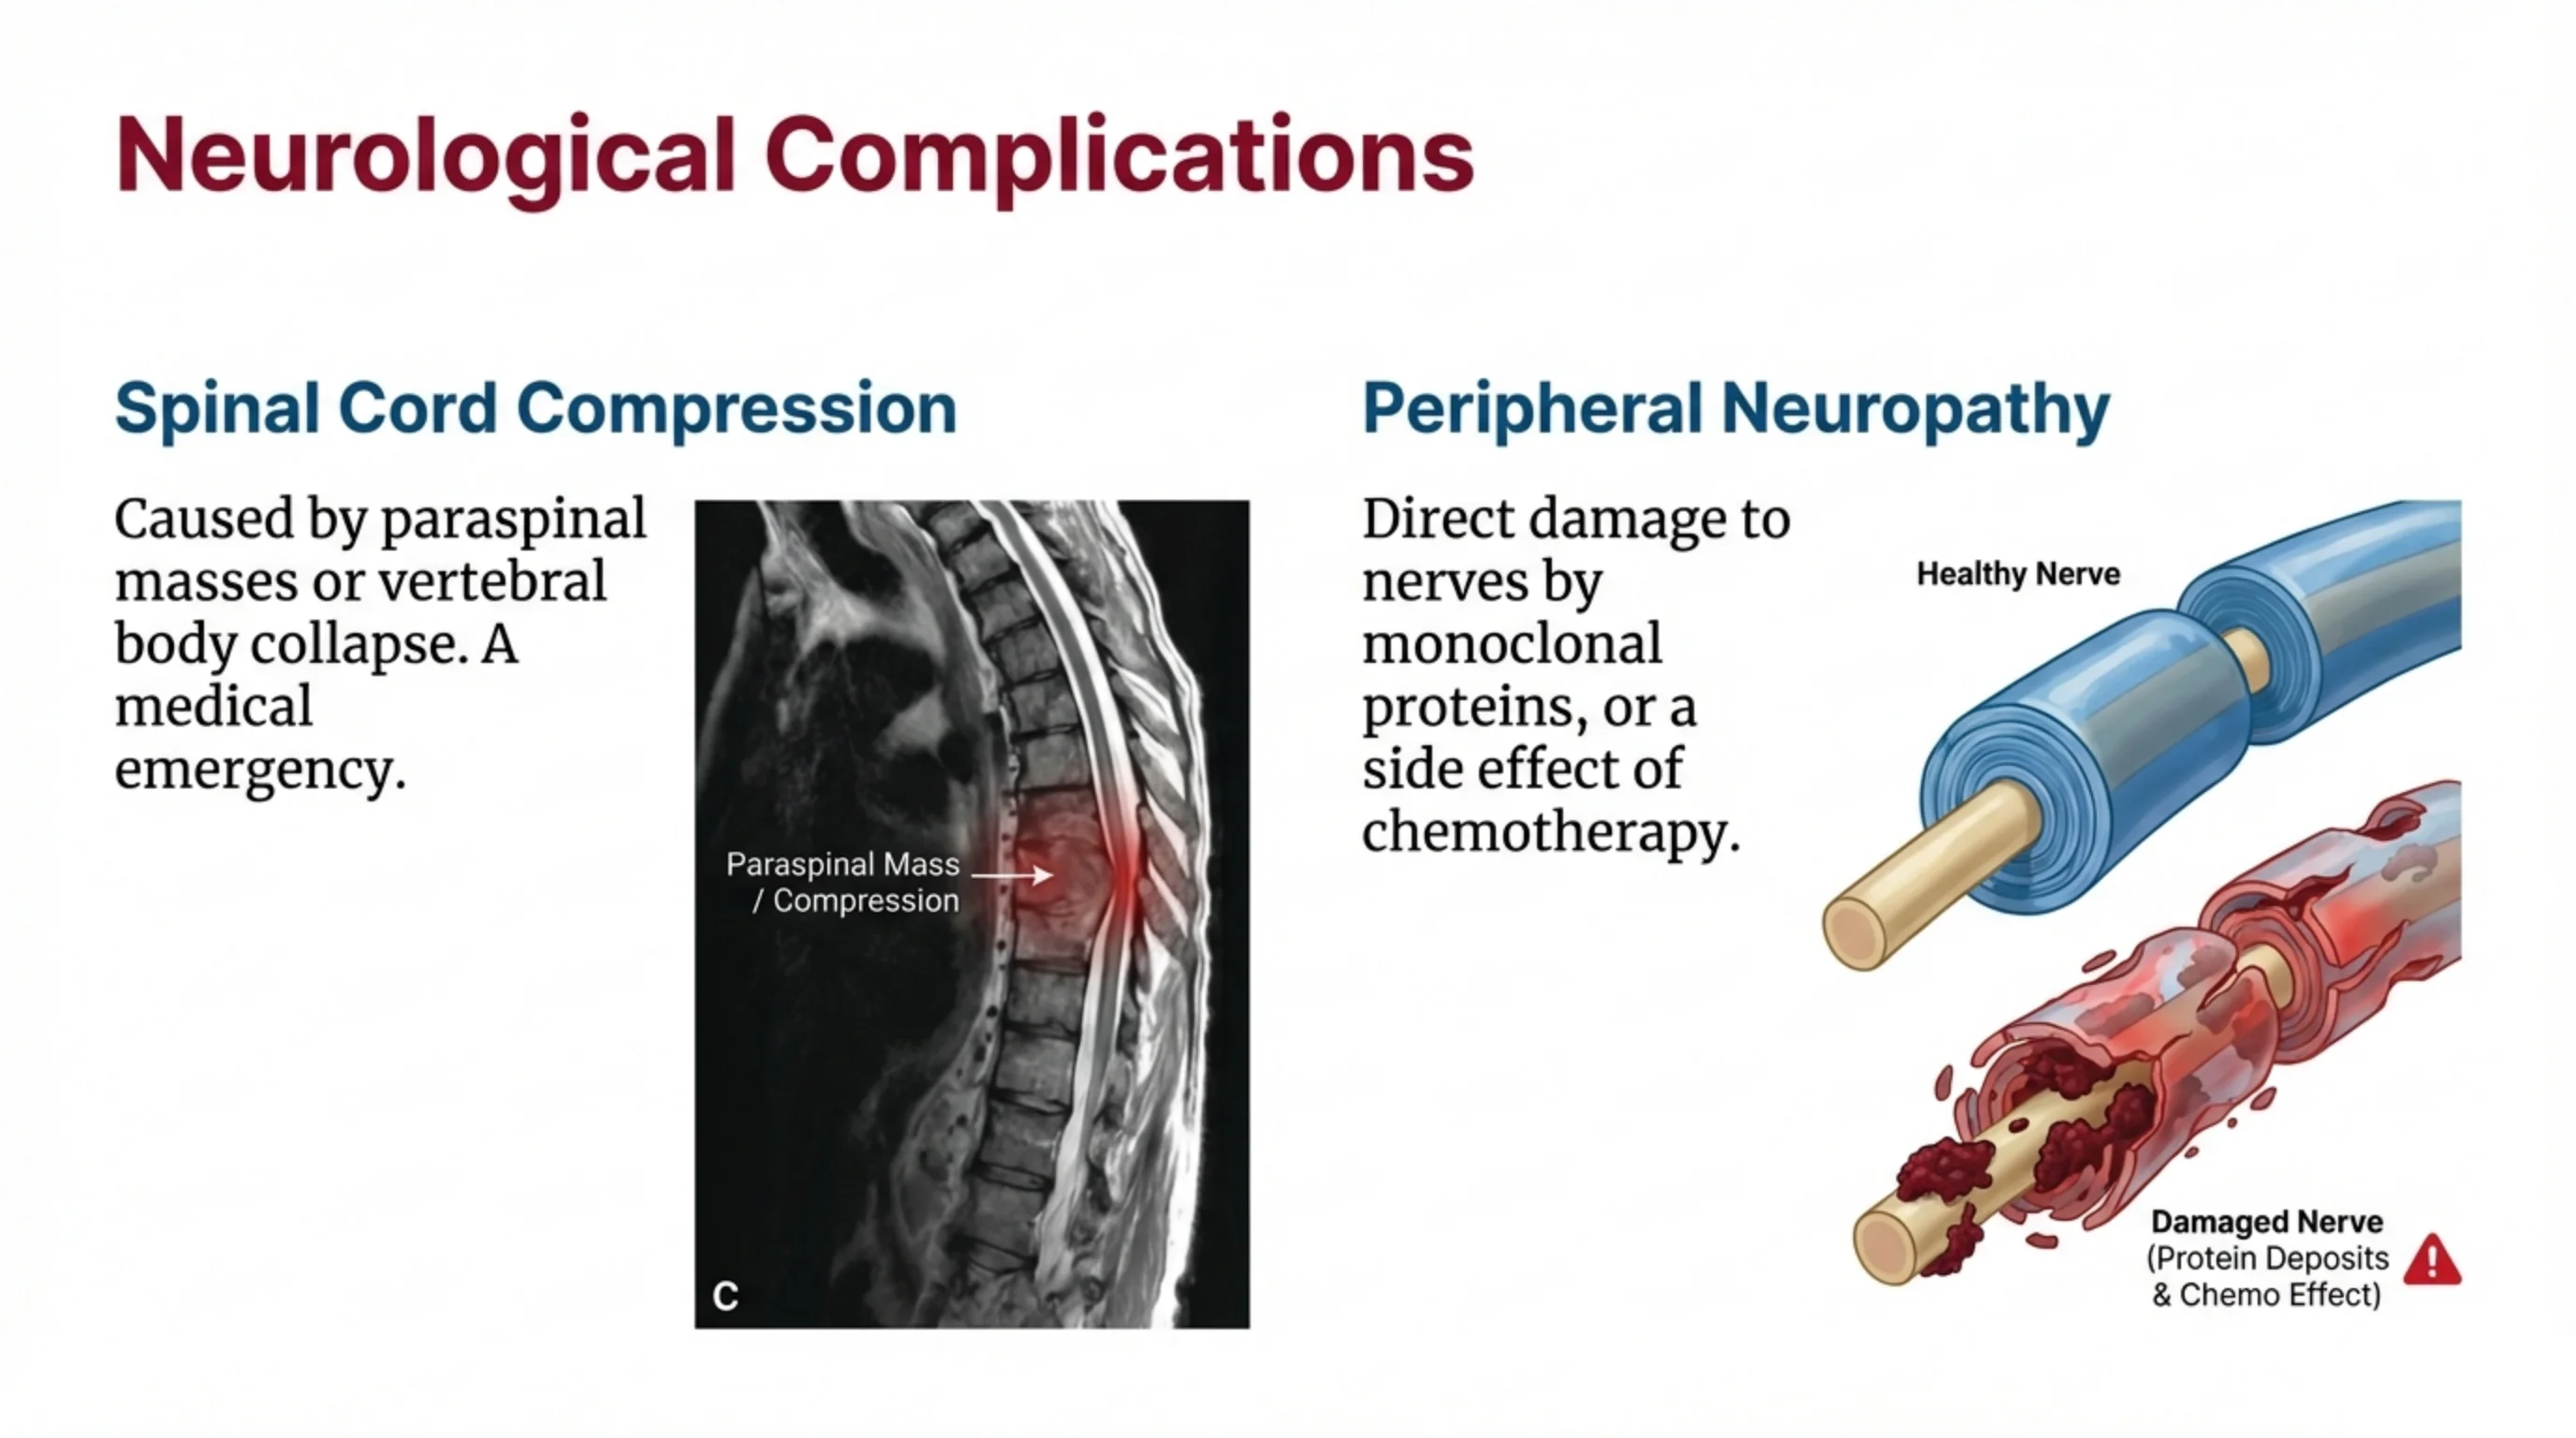
Neurological Complications
Spinal Cord Compression
Caused by paraspinal masses or vertebral body collapse. A medical emergency.
MRI label: Paraspinal Mass / Compression.
Peripheral Neuropathy
Direct damage to nerves by monoclonal proteins, or a side effect of chemotherapy.
Illustration labels: Healthy Nerve; Damaged Nerve (Protein Deposits & Chemo Effect).
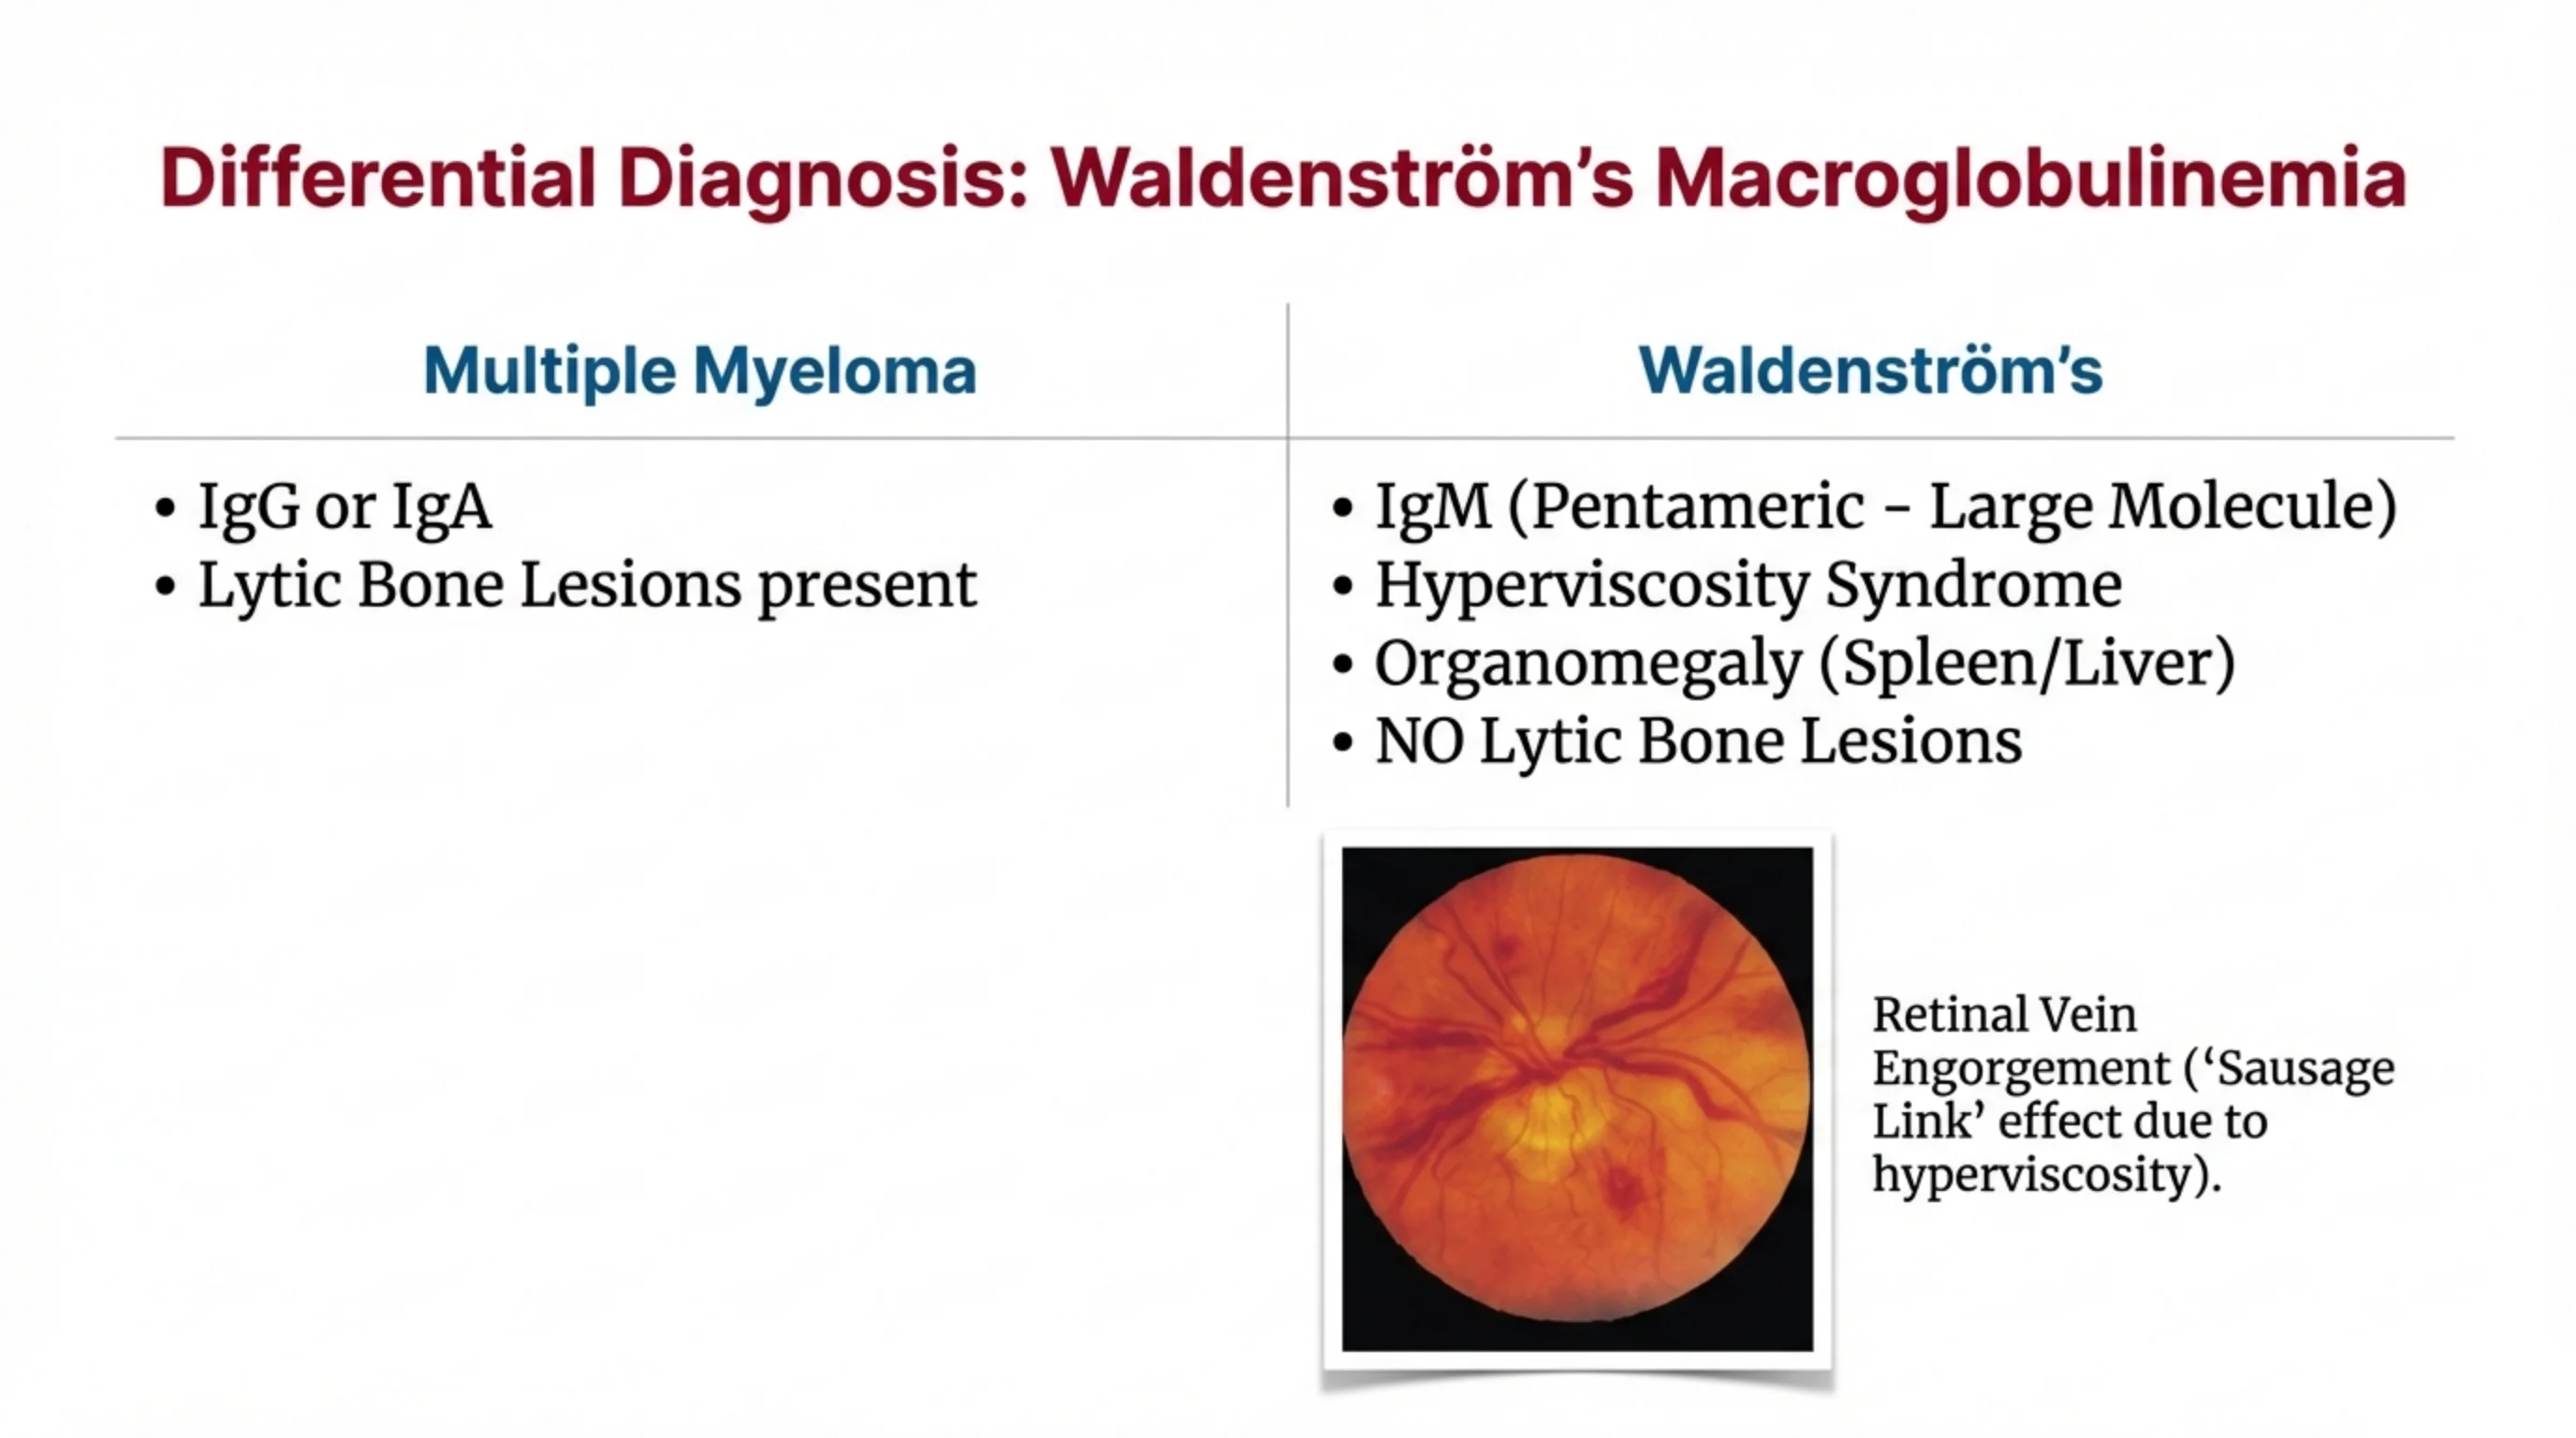
Differential Diagnosis: Waldenström's Macroglobulinemia
| Multiple Myeloma | Waldenström's |
|---|---|
| IgG or IgA | IgM (Pentameric – Large Molecule) |
| Lytic Bone Lesions present | Hyperviscosity Syndrome |
| Organomegaly (Spleen/Liver) | |
| NO Lytic Bone Lesions |
Fundus image: Retinal Vein Engorgement ('Sausage Link' effect due to hyperviscosity).
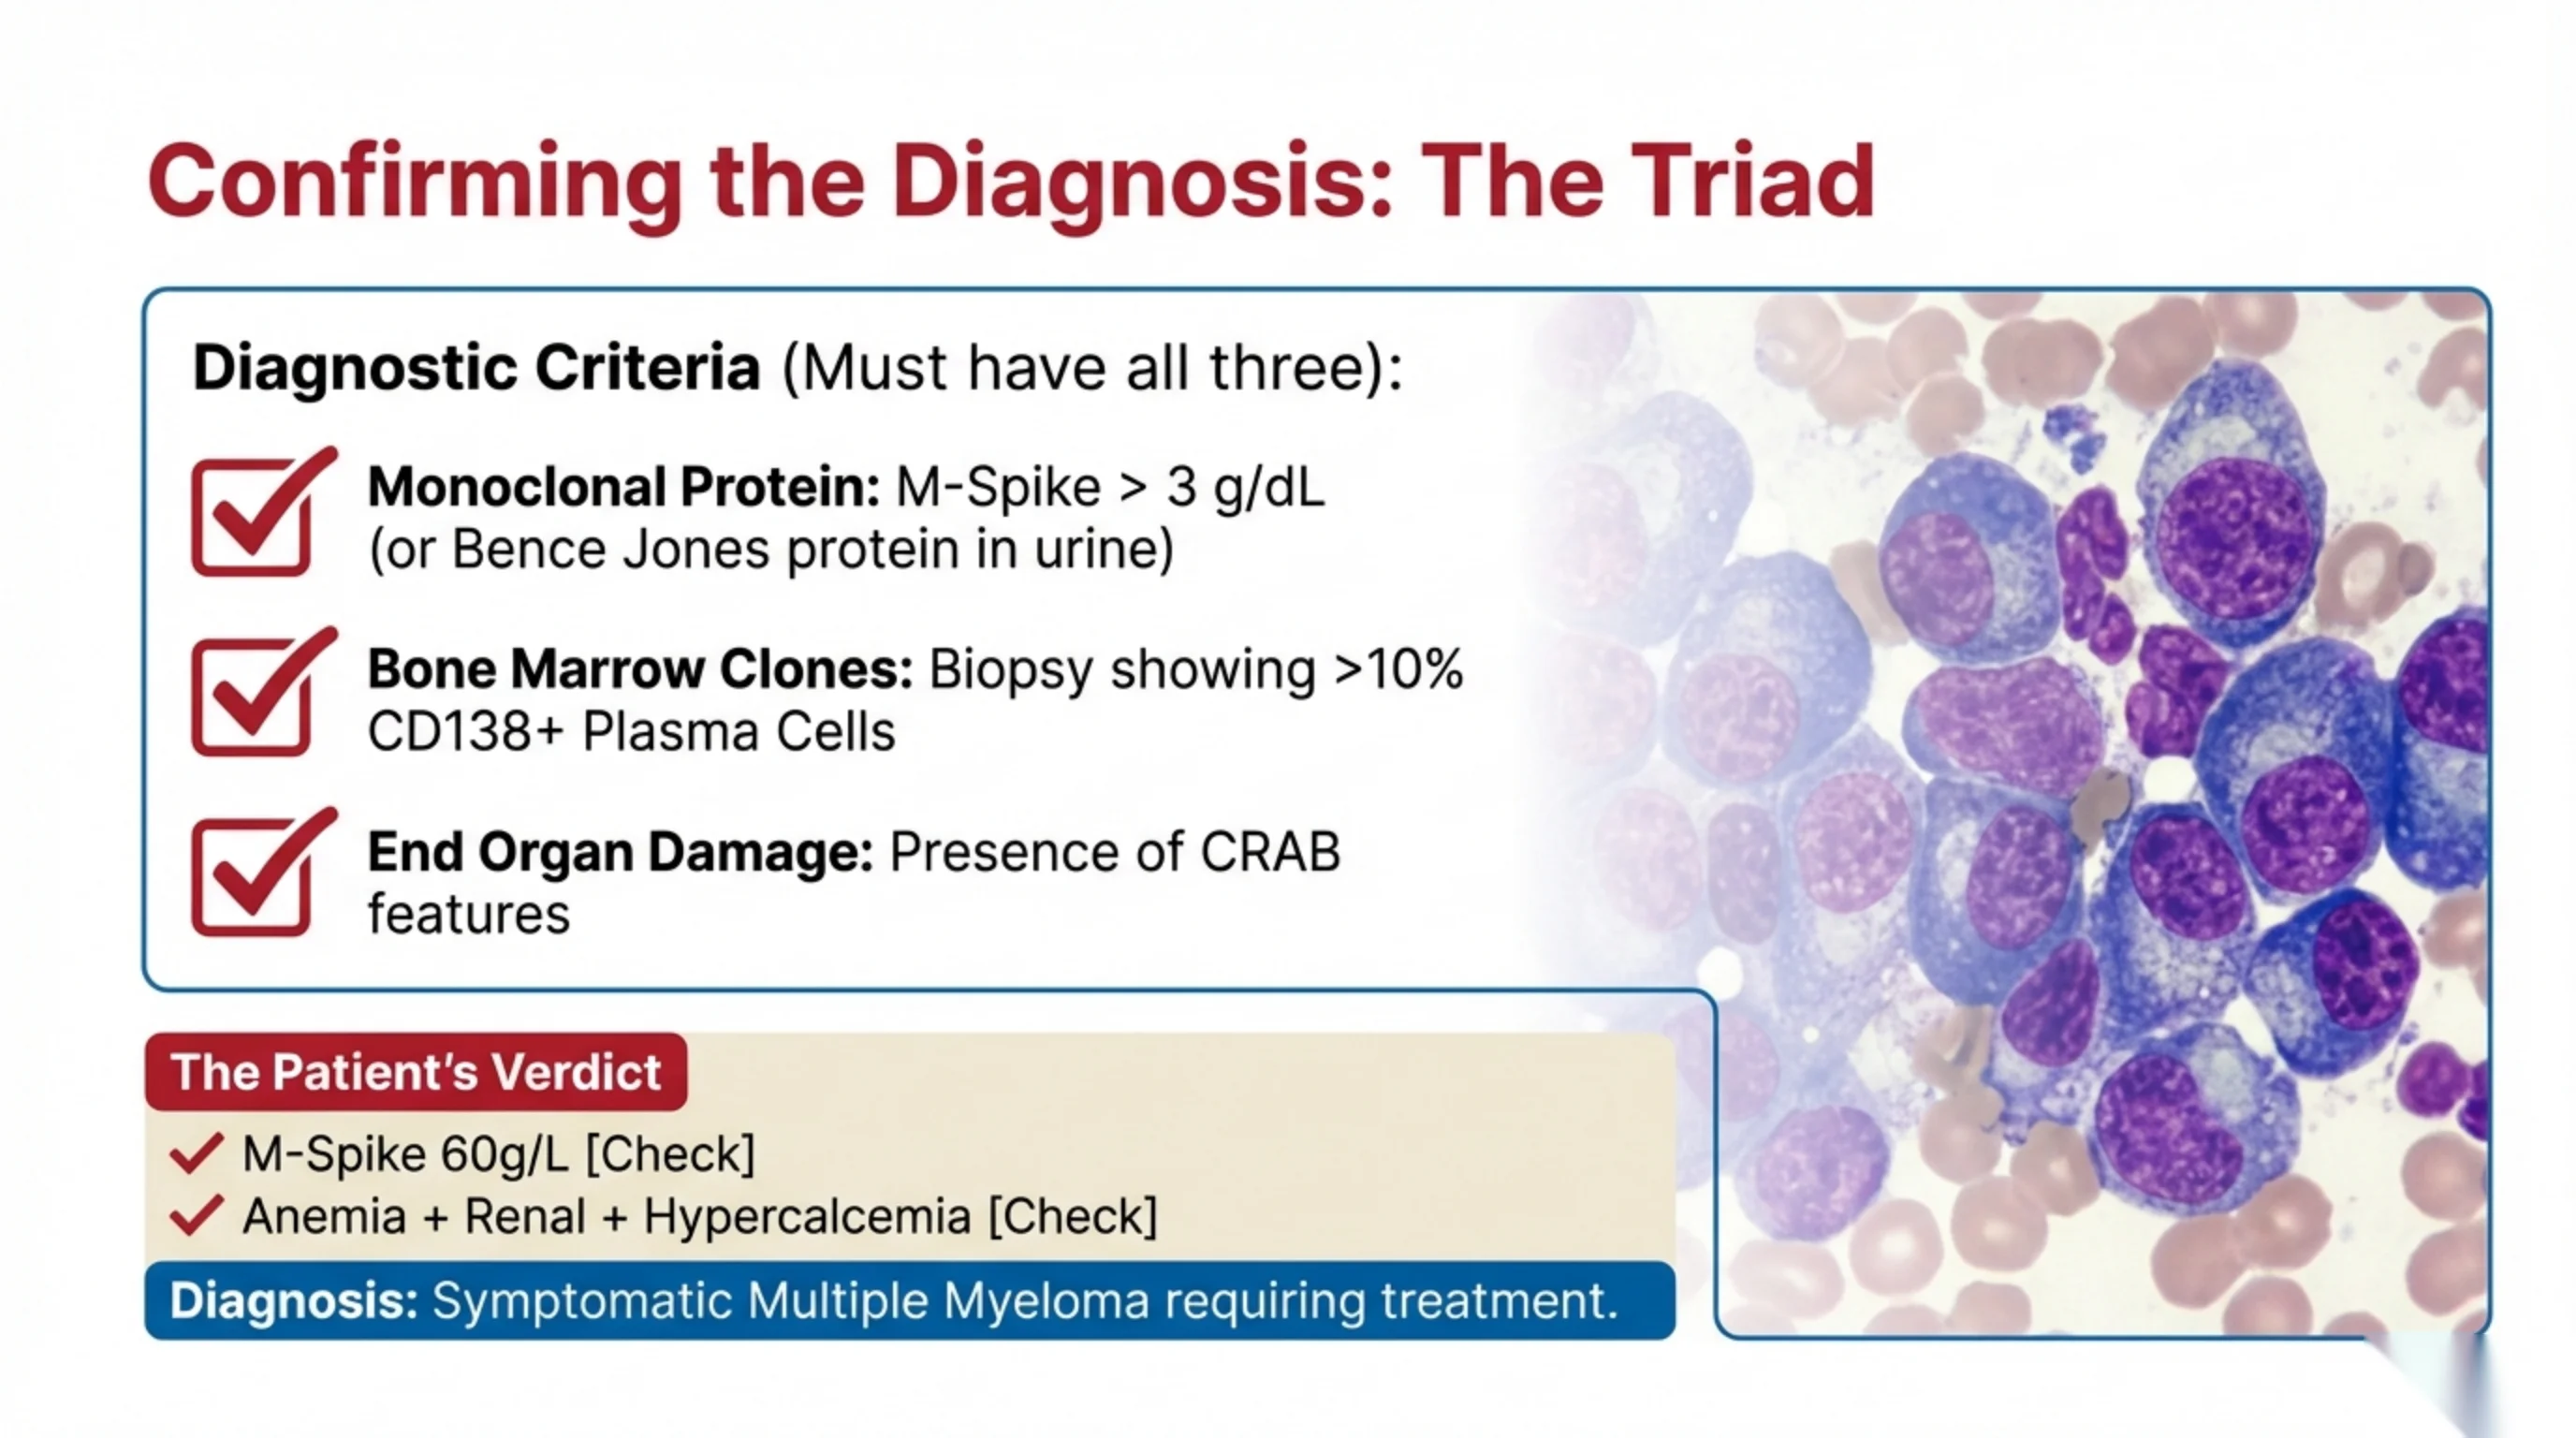
Confirming the Diagnosis: The Triad
Diagnostic Criteria (Must have all three):
- Monoclonal Protein: M-Spike > 3 g/dL (or Bence Jones protein in urine)
- Bone Marrow Clones: Biopsy showing >10% CD138+ Plasma Cells
- End Organ Damage: Presence of CRAB features
The Patient's Verdict
- M-Spike 60g/L [Check]
- Anemia + Renal + Hypercalcemia [Check]
Diagnosis: Symptomatic Multiple Myeloma requiring treatment.
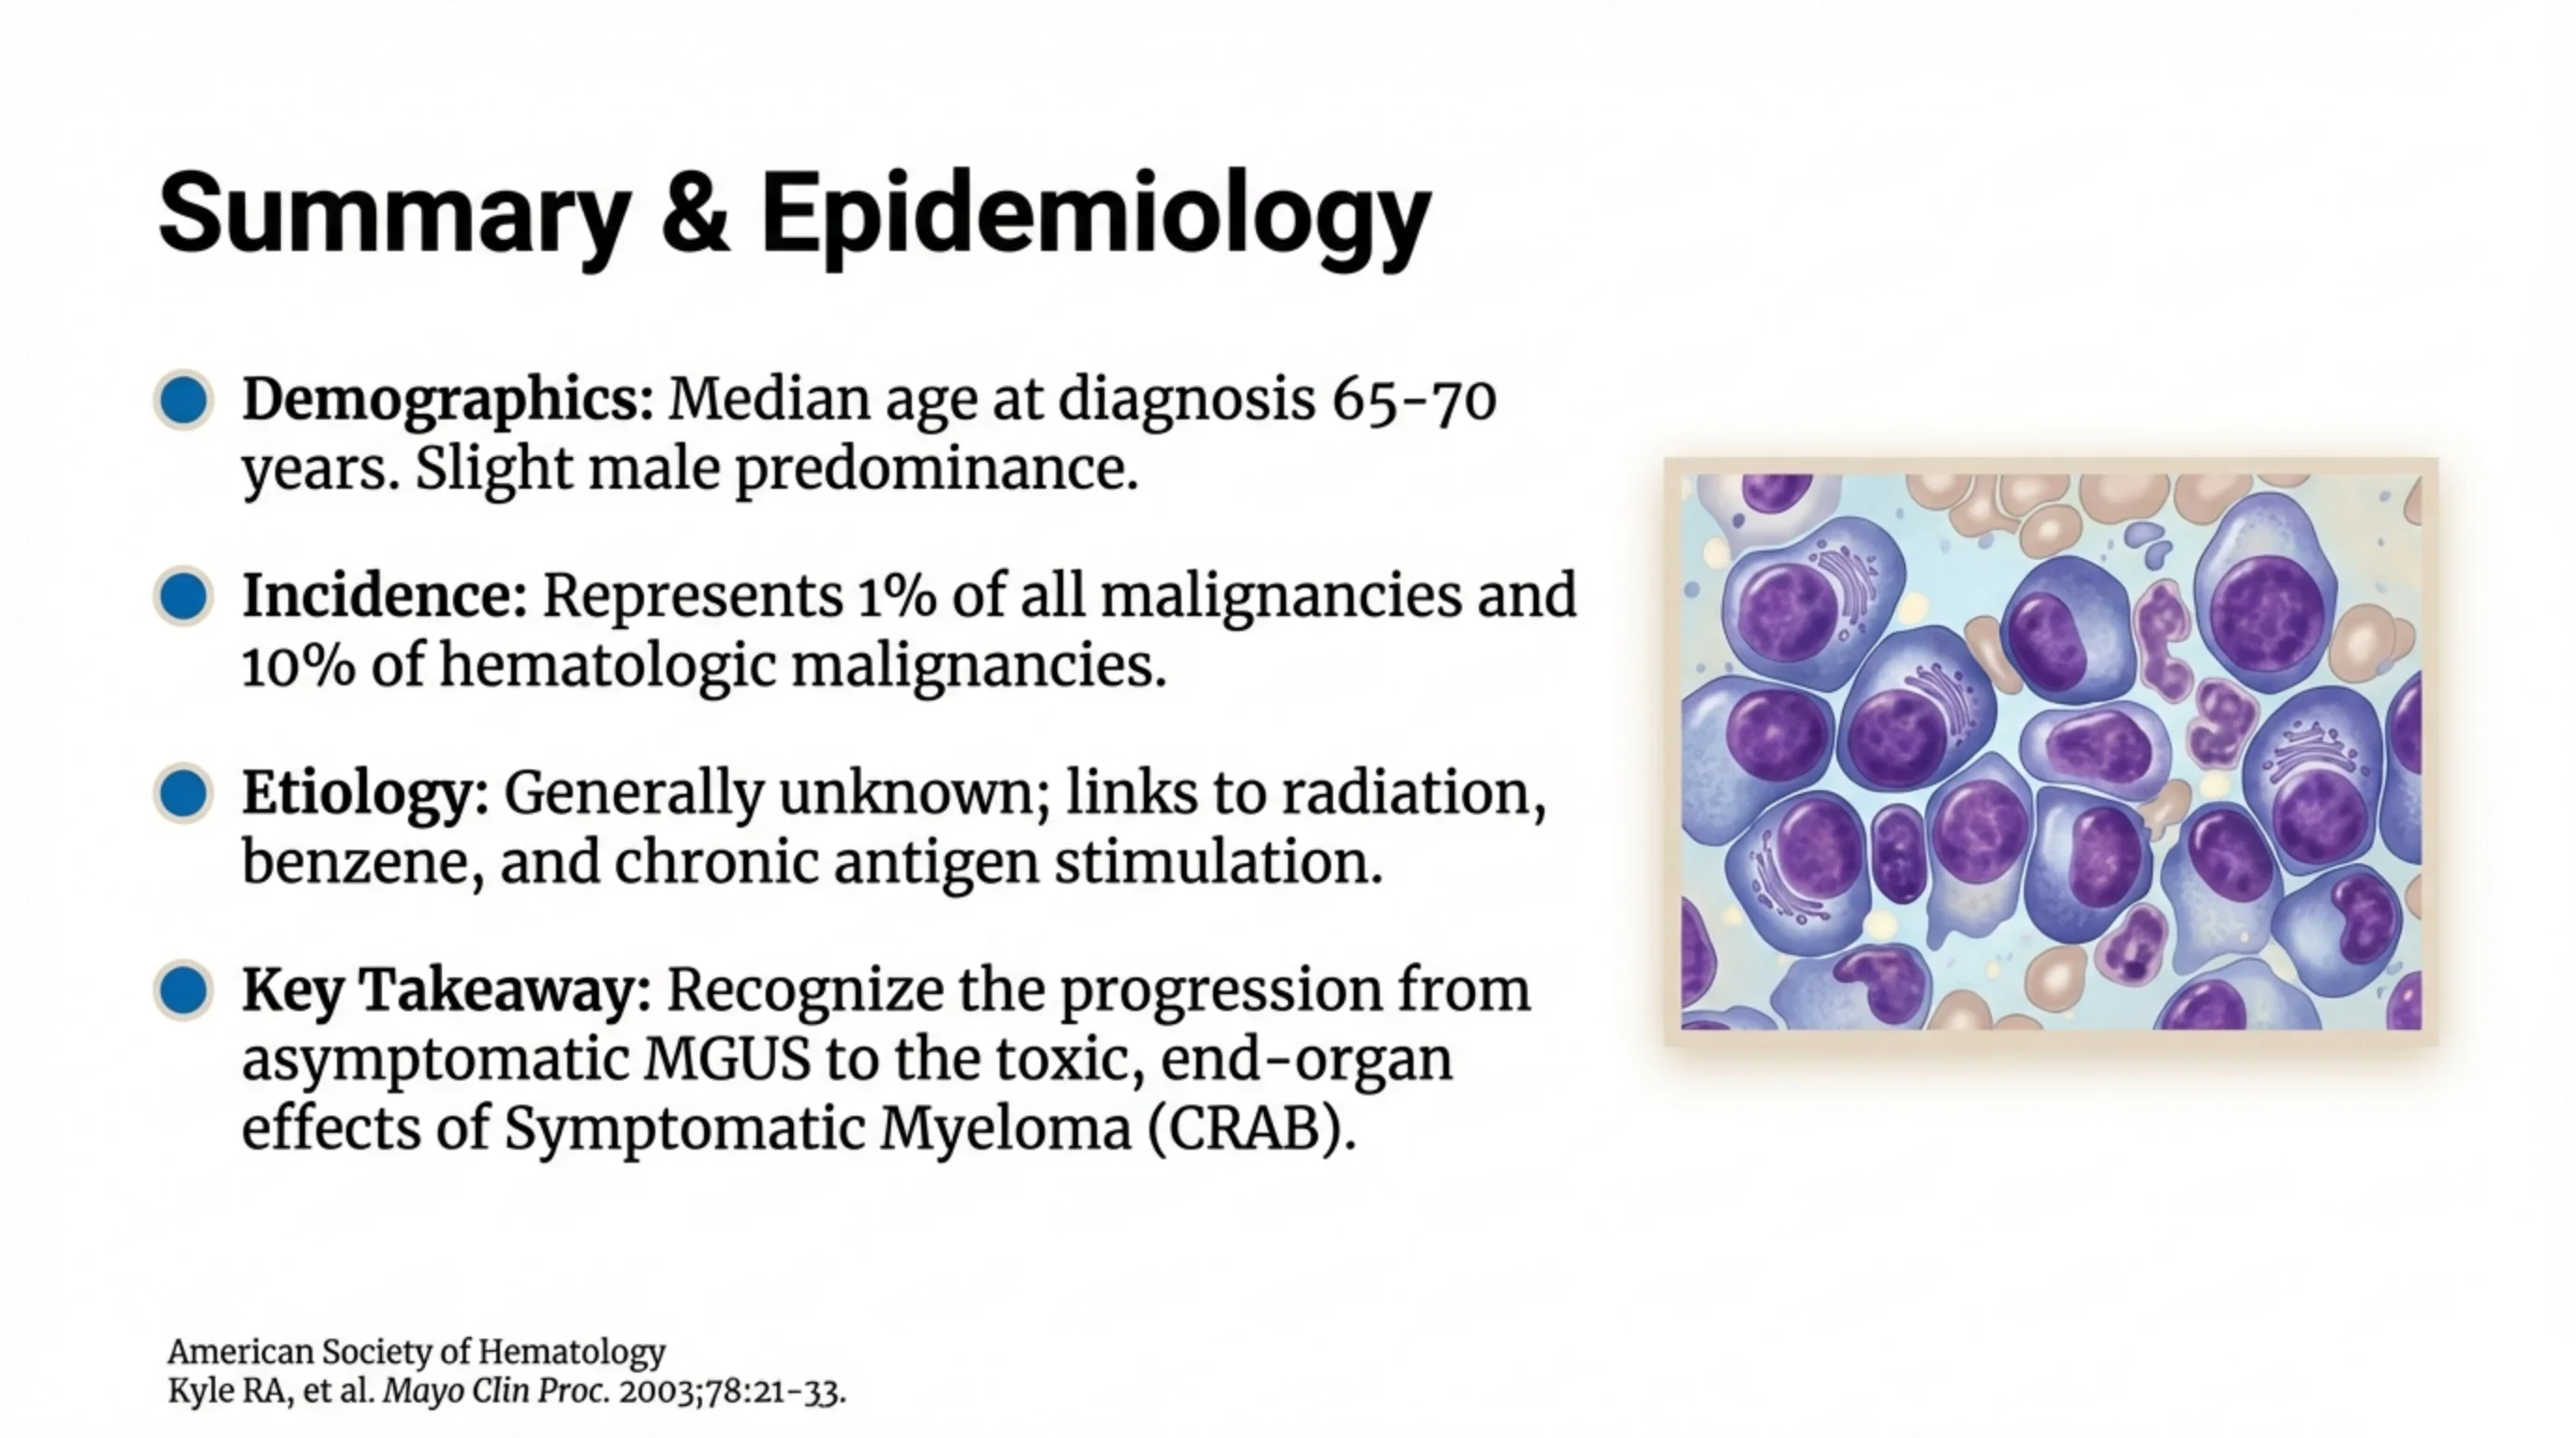
Summary & Epidemiology
- Demographics: Median age at diagnosis 65–70 years. Slight male predominance.
- Incidence: Represents 1% of all malignancies and 10% of hematologic malignancies.
- Etiology: Generally unknown; links to radiation, benzene, and chronic antigen stimulation.
- Key Takeaway: Recognize the progression from asymptomatic MGUS to the toxic, end-organ effects of Symptomatic Myeloma (CRAB).
Source: American Society of Hematology. Kyle RA, et al. Mayo Clin Proc. 2003;78:21-33.